10 Ways For Traders to Take Profit
By Galen Woods ‐ 10 min read
Taking your profits is as important as your trade entries. Here are 10 ways for you to realise your trading profits.
Taking profit is one of the most neglected topic among traders. The typical learning cycle goes this way.
- Trader thinks that the trade entry is all that matters.
- Trader depletes his trading capital and realised that he has overlooked stop-losses. Time to focus on stop-losses.
- Trader feels frustrated when he sees his paper profits vanish again and again. Only then, he realises that while he has an exit plan for losing trades, he does not have one for winning trades.
Without knowing how to take profits, a trader will never be profitable. Do not ignore this critical aspect of trading any longer.
Here are 10 techniques for grabbing profits off the table.
Targets
1. Chart Pattern Target Projection
2. Fibonacci Extension
3. Past Swing Pivot
4. Price Channel
5. Time Target
Trailing Stop-Losses
6. Parabolic SAR
7. Chandelier Stop
8. New Trading Signal
Ongoing Price Action
9. Reversal Signal
10. Climatic Move
Targets
The most direct way to take profit is to use a target limit order. This means that as we enter a trade, we place a limit order at a price objective.
How do we decide on the target price?
For the technical trader, there are several reliable options.
1. Chart Pattern Target Projection
A basic target projection method uses classical chart patterns as a basis. These chart patterns include Triangles, Rectangles, Head & Shoulder, and more. If you use chart patterns in your trading, why not use them to project targets as well?
Although we draw each chart pattern differently, the target projection method is similar. It always involves taking the height of the chart pattern and extending it from the break-out point.
The example below shows how to project a bullish target from a Rectangle chart pattern.
(For detailed steps of projecting targets from other chart patterns, refer to our 10 Chart Patterns for Price Action Trading.)
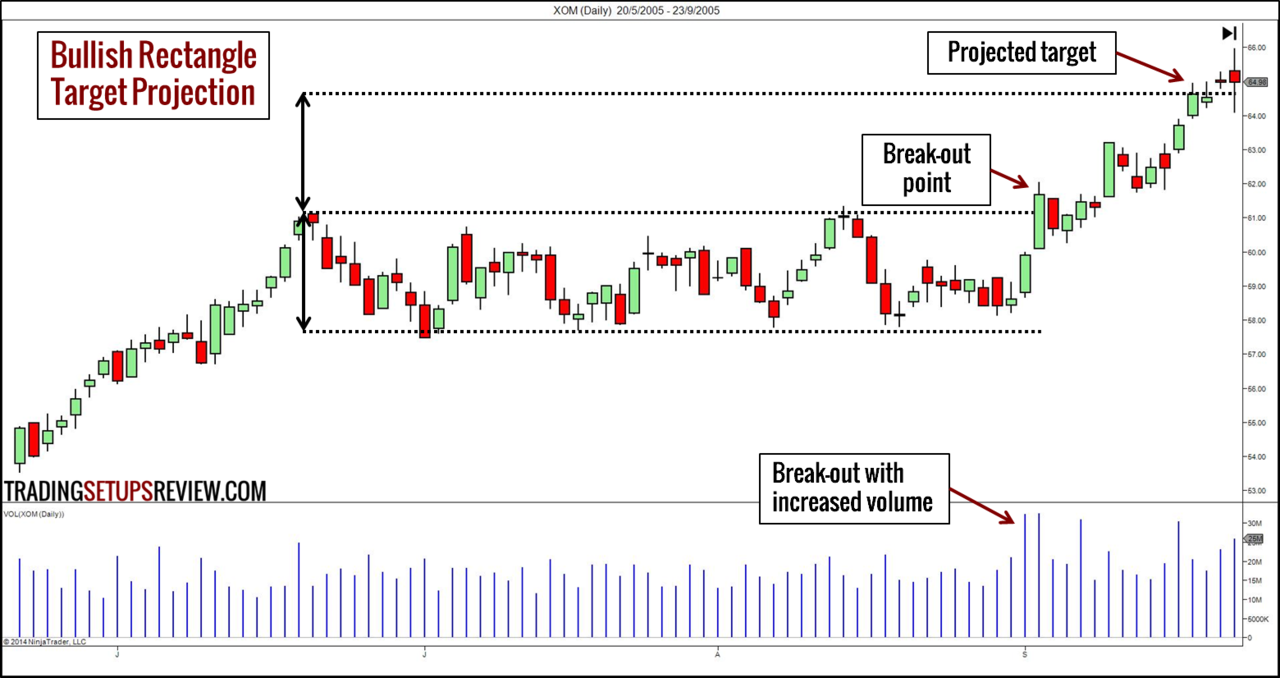
To project the target in this example:
- Measure the height of the Rectangle pattern; and
- Project the same distance from the break-out point at the top of the Rectangle to get the bullish target.
Likewise, we can arrive at a bearish target if we project the height of the Rectangle from its bottom.
2. Fibonacci Extension
Other than relying on geometric chart patterns, traders also use the golden ratio to project targets. The golden ratio is closely related to the Fibonacci sequence which is a common trading premise.
Fibonacci traders uses Fibonacci Extensions for projecting targets. Using a charting software with Fibonacci drawing tools, you can mark these potential target levels easily.
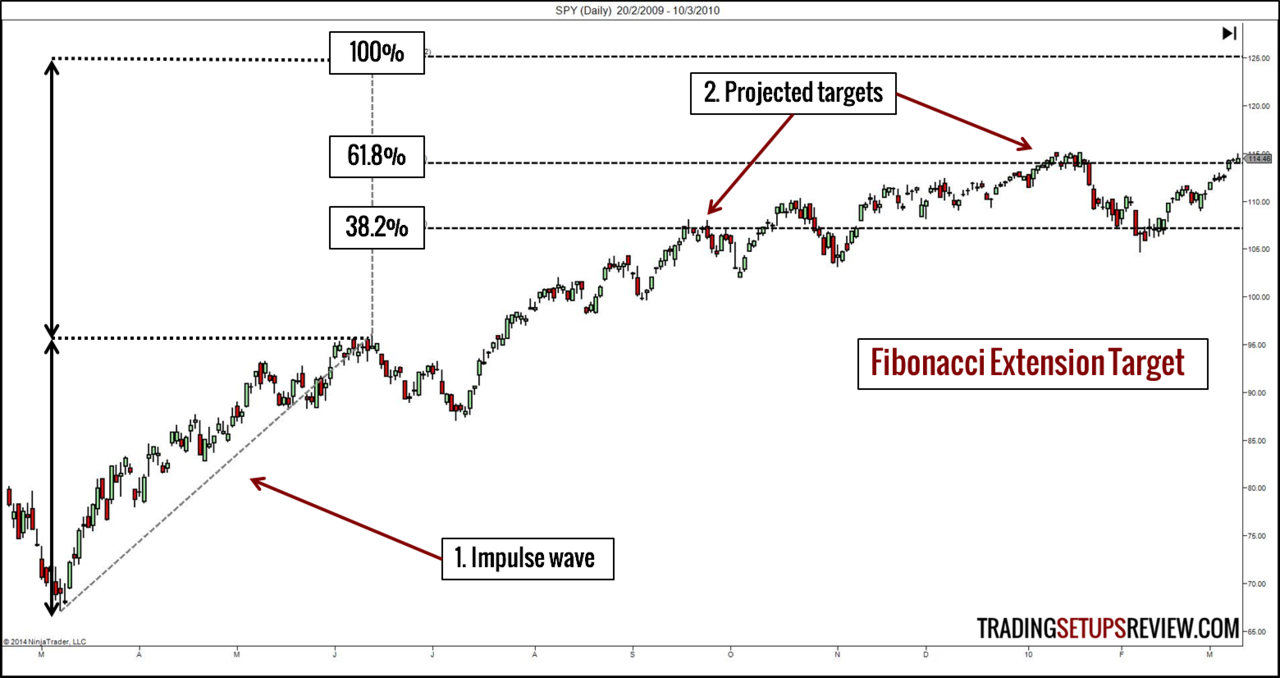
As shown above, drawing Fibonacci Extensions is a two-step process.
- Identify a significant impulse move. In this example, we want to find a bullish target. Hence, we selected a bullish impulse swing.
- Project the extensions using Fibonacci ratios (0.382 and 0.618). For instance, multiply the height of the impulse wave by 0.382. Then, extend the product from the high of the impulse swing.
For Fibonacci Extensions, the choice of the impulse wave is critical. Select a clear and major price thrust for best results.
3. Past Swing Pivots
Swing pivots are market turning points. These turning points are effective support and resistance levels, especially those at major market tops and bottoms.
Hence, by projecting them into the future, we get reliable price targets.
Generally, we look for bearish targets using past swing lows and bullish ones with swing highs.
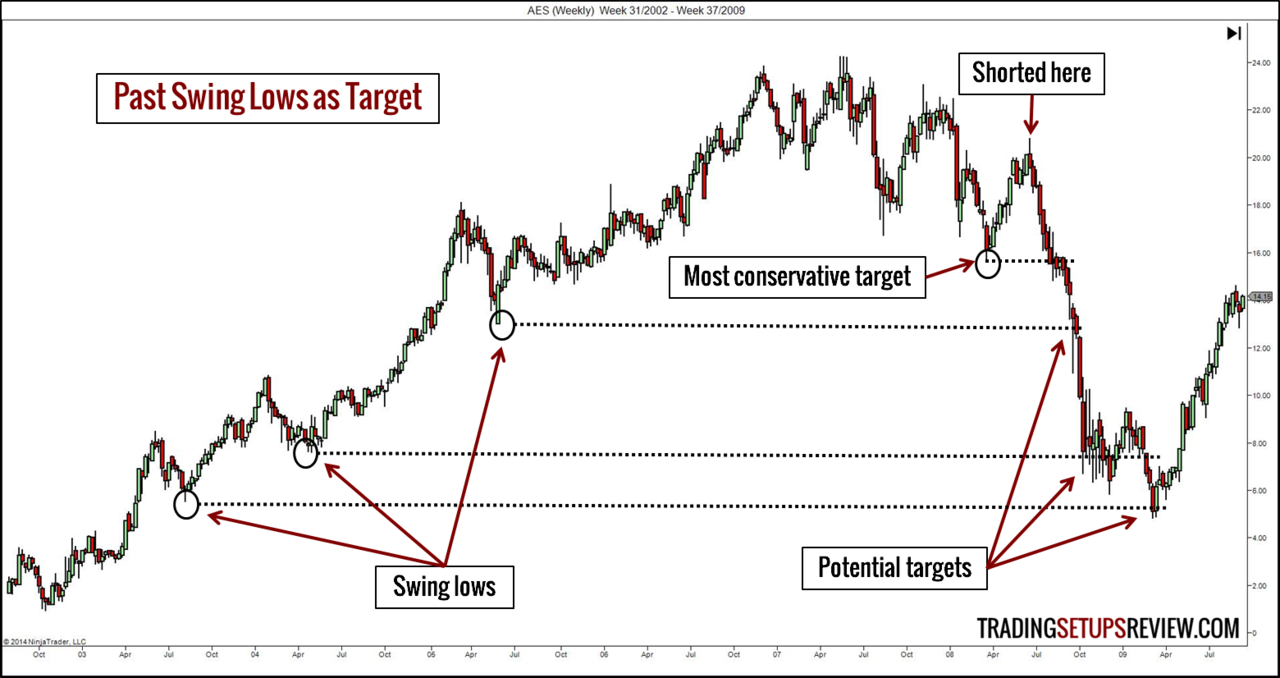
This example shows a short trade. Using past swing lows, we projected several resistance levels representing potential targets. The nearest resistance is clearly the most conservative target.
Observing past swing pivot points is a straightforward and robust way to find support/resistance.
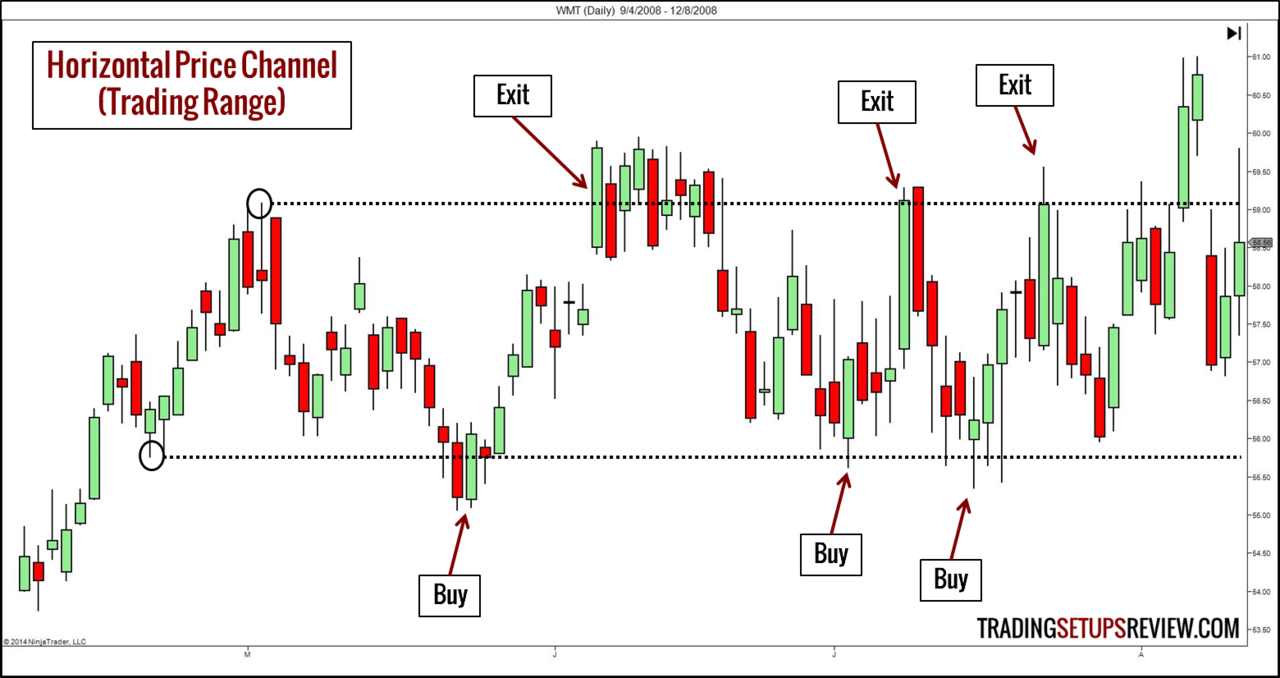
4. Price Channel Projection
A price channel consists of two parallel lines. The nature of the channel depends on its slope.
- Lines slope upwards - Bull channel
- Lines slope downwards - Bear channel
- Lines are horizontal - Trading range
Learn more about trading with channels with this article.
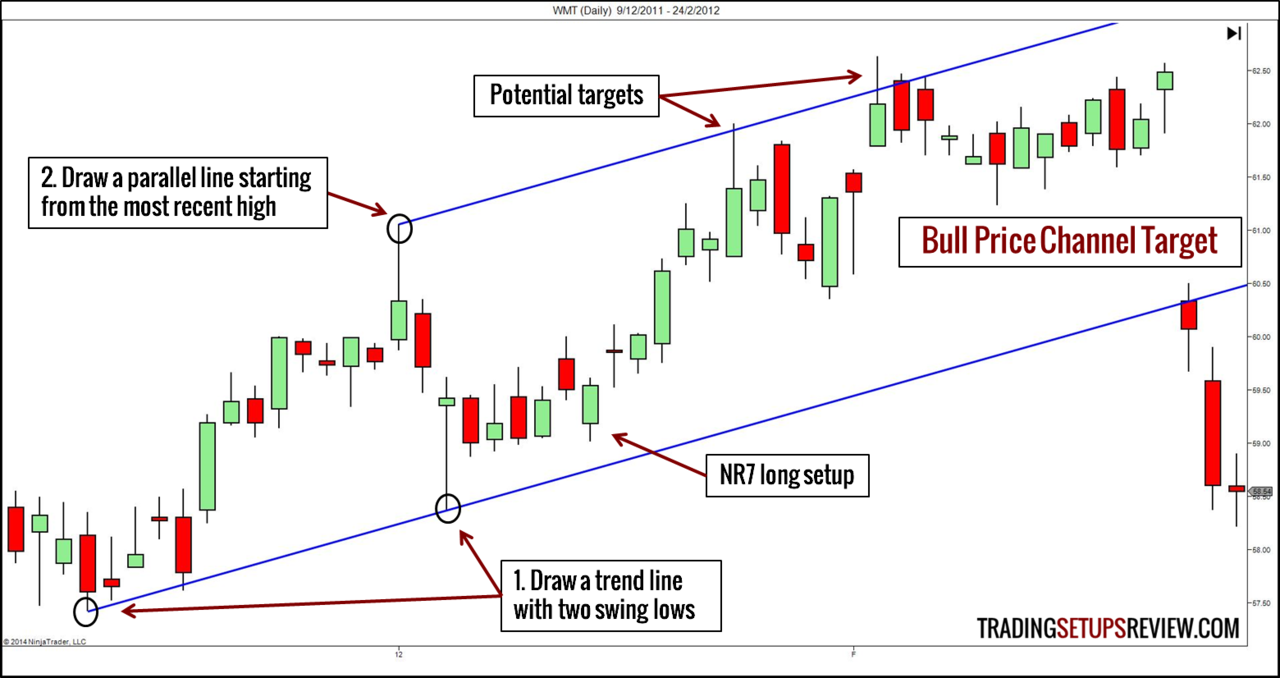
The chart above shows a NR7 long setup. We projected a target using a price channel.
- Draw an upwards sloping trend line with two swing lows.
- Draw a parallel line starting from the most recent high. (Channel line)
The plan is to exit once price hits the channel line. As the market progresses, the channel line rises. Hence, our target price is dynamic, and we need adjust the target order higher to keep up with the channel line.
This is in stark contrast to the tactics we discussed earlier. They are static targets which do not need adjustments.
In addition, as shown below, a channel method is the natural choice for traders operating within a trading range, aiming for small profits.
5. Time Target
Let’s look at targets from another dimension. Try time.
Having time targets refer to taking profits once a certain time period has lapsed. This method of taking profit is relevant and perhaps critical for options traders and day traders.
Options traders (specifically buyers) need to manage their prospect of gains versus potential loss due to time decay. Typically, the loss of time value accelerates as we approach the options expiration date. Hence, having a time target is useful for tackling the problem of time decay.
Most day traders work within the confines of a single trading session to enjoy intra-day trading margins and to avoid overnight risk. For them, there is a natural time target at the end of each session.
Combine a time target with a price target for the best of both worlds.
Trailing Stop-Loss
Let your profits run.
I’m sure you have heard this maxim before. If you want to adhere to this trading advice, using a trailing stop-loss is your best bet.
A trailing stop-loss is one that follows behind the market. It has the dual function of locking in profits and letting profits run.
However, the art of trailing stop-loss is demanding. If we trail the stop-loss order too closely, we might suffocate the trade. If we trail it too far behind the market, we risk giving back a large part of our profits.
For a systematic way of trailing stop-losses, use one of the following methods.
6. Parabolic SAR
J. Welles Wilder invented the ADX for tracking trends and the RSI for clarifying momentum. It is hardly surprising that he has something up his sleeve for trailing stop-losses.
Let us introduce Wilder’s Parabolic Stop-and-Reverse (SAR).
From its name, we can tell that clearly, Wilder intended to use the Parabolic SAR for more than just trailing stop-loss. He wanted to reverse the trading position after being stopped out.
However, here, we are only focusing on using it as a trailing stop-loss tool to lock in our profits.
This indicator plots a marker below each price bar in a uptrend and above each bar in a downtrend. Its underlying concept is that time is money. Hence, as time passes, the Parabolic SAR accelerates closer to the market price.
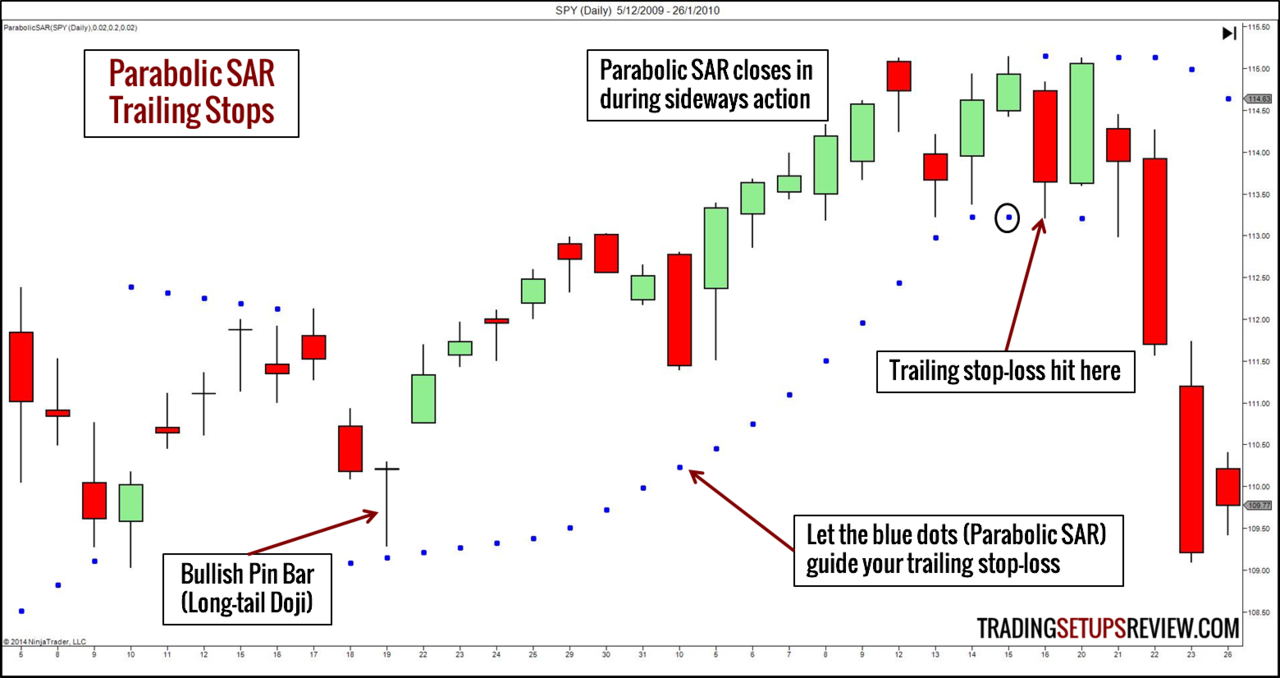
In this example, our entry was the bullish pin bar (doji). The blue dots plot the Parabolic SAR, which provides a natural trailing stop-loss for our long trade.
Towards the right of the chart, you could see that the blue dots are intolerant of prolonged sideways movement, and catches up quickly.

.
7. Chandelier Stop
The ideal trailing stop-loss should give enough room for minor pullbacks. Thus, a sensible approach is to consider how volatile the instrument is.
The Chandelier Stop does that by taking the Average True Range (ATR) as a measure of volatility. The ATR is another concept from Wilder. (Yes, we are really indebted to him.)
In a nutshell, the ATR measures volatility using the average range of each price bar and adjusts for any gaps. If you want to see the formula, it’s here.
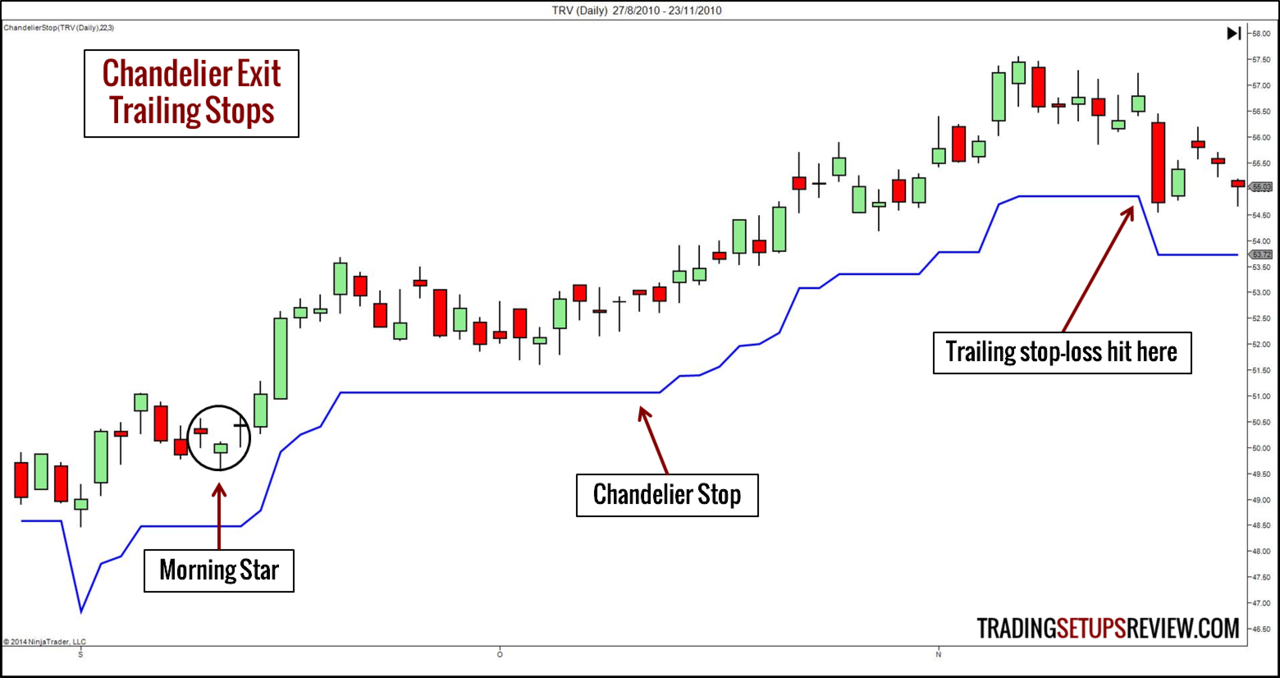
- Chandelier Stop (Long Position) = Highest High of a Period - (Multiple x ATR over a Period)
- Chandelier Stop (Short Position) = Lowest Low of a Period + (Multiple x ATR over a Period)
You need to decide on two inputs: Period and Multiple. A common setting is a Period of 22 and a Multiple of 3.
To find out where to place our stop-loss, multiply the ATR(22) by 3. Then, minus that product from the highest high of the past 22 bars for a bullish target.
The example below shows the use of a Chandelier Stop (in blue) for a Morning Star candlestick signal.
8. New Trading Signal
The basic idea is to trail stop-losses behind new trading setups that form in your trade’s direction.
This is a discretionary technique. It can take various forms depending the setups that catch your eyes. Just remember that if the setup is good enough for a new trade in the same direction, it is a sufficient basis for us to adjust our stop-loss.
The example below uses Pin Bar signals to trail stop-losses. But you can pretty much use any price pattern or indicator signal you are familiar with.
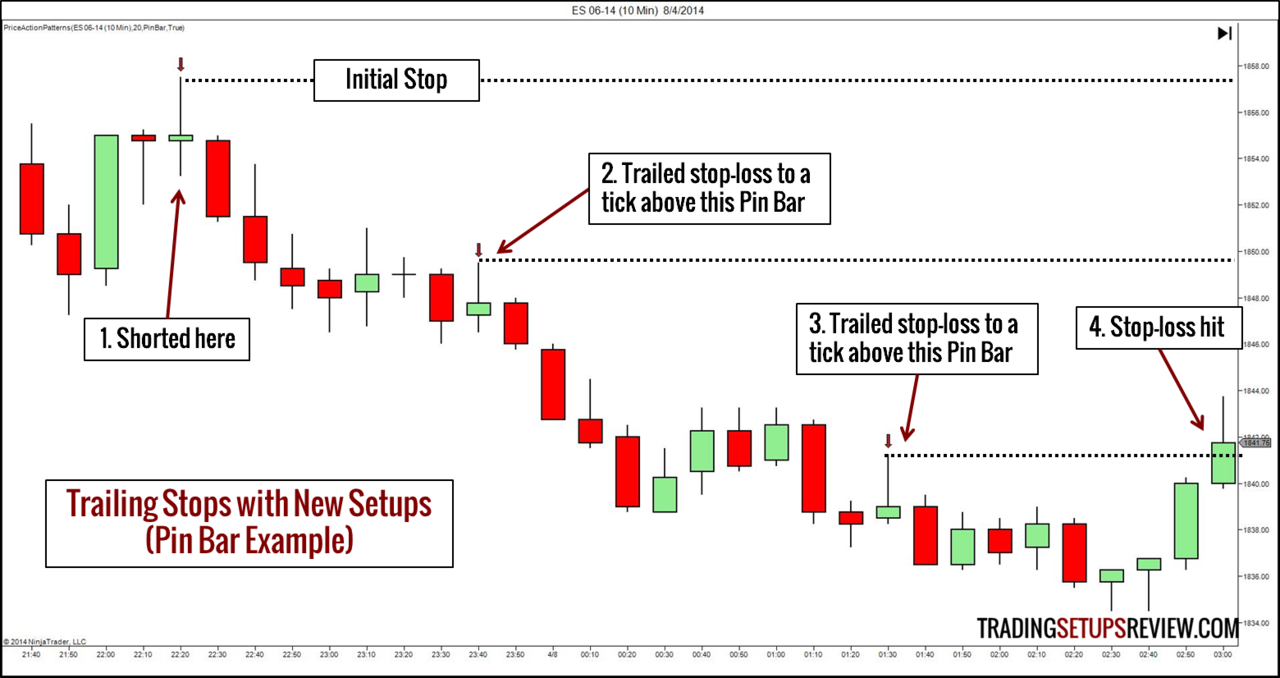
We marked out the Pin Bars in the chart above with our Price Action Pattern Indicator.
Ongoing Price Action
We covered taking profits with a target limit order. We have also talked about taking profits with stop-loss orders.
Now, let’s see how we can take profits with market orders. This is a flexible approach to decide if we need an immediate exit to keep our profits.
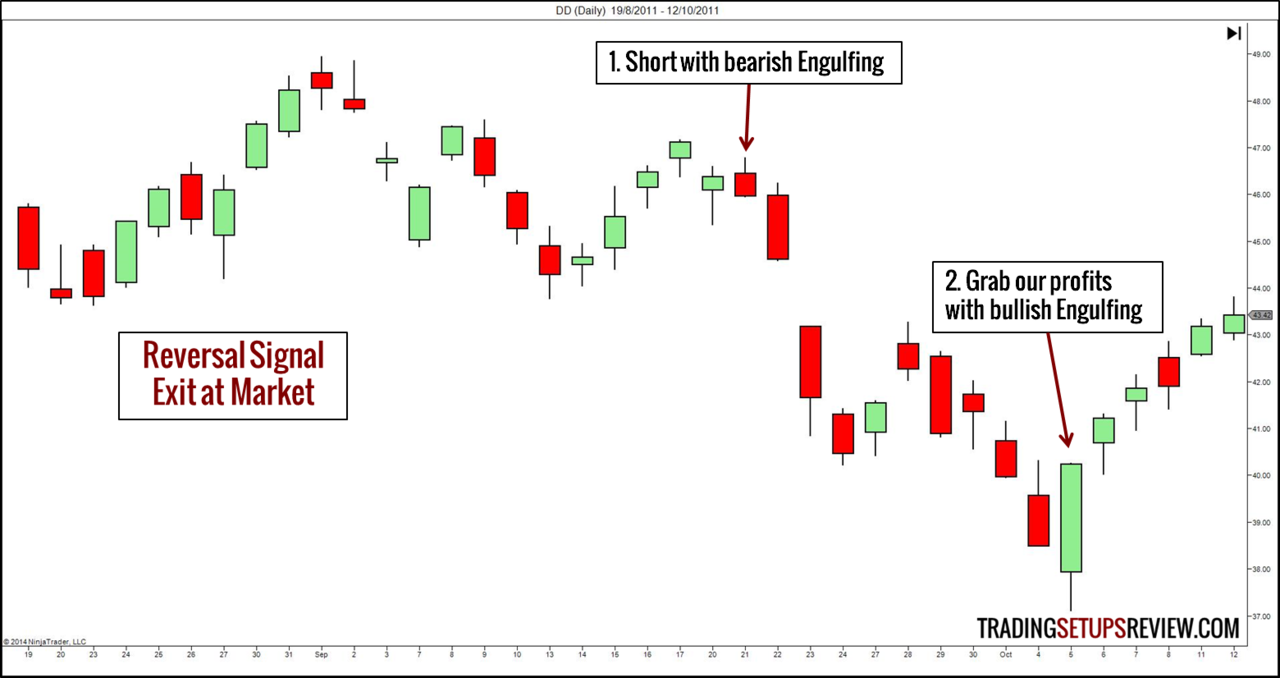
9. Reversal Signal
This is the commonsense exit.
- Enter with a bullish signal. Take your profits with a bearish signal.
- Short with a bearish signal. Cover with a bullish one.
This a nimble tactic. However, in trending markets, this method might cause premature exits and limit our profits. This is because a trend sustains itself by giving false reversal signals to trap traders out of the market and have them chase it.
In the example below, we entered with a bearish Engulfing candlestick. Then, a bullish Engulfing pattern prompted us to take profits.
10. Climatic Move
Climatic price action is a reversal signal that is particularly effective as a profit-taking cue.
Look out for:
- Bar range expansion
- Price movement at an increasing rate
- Extreme volume
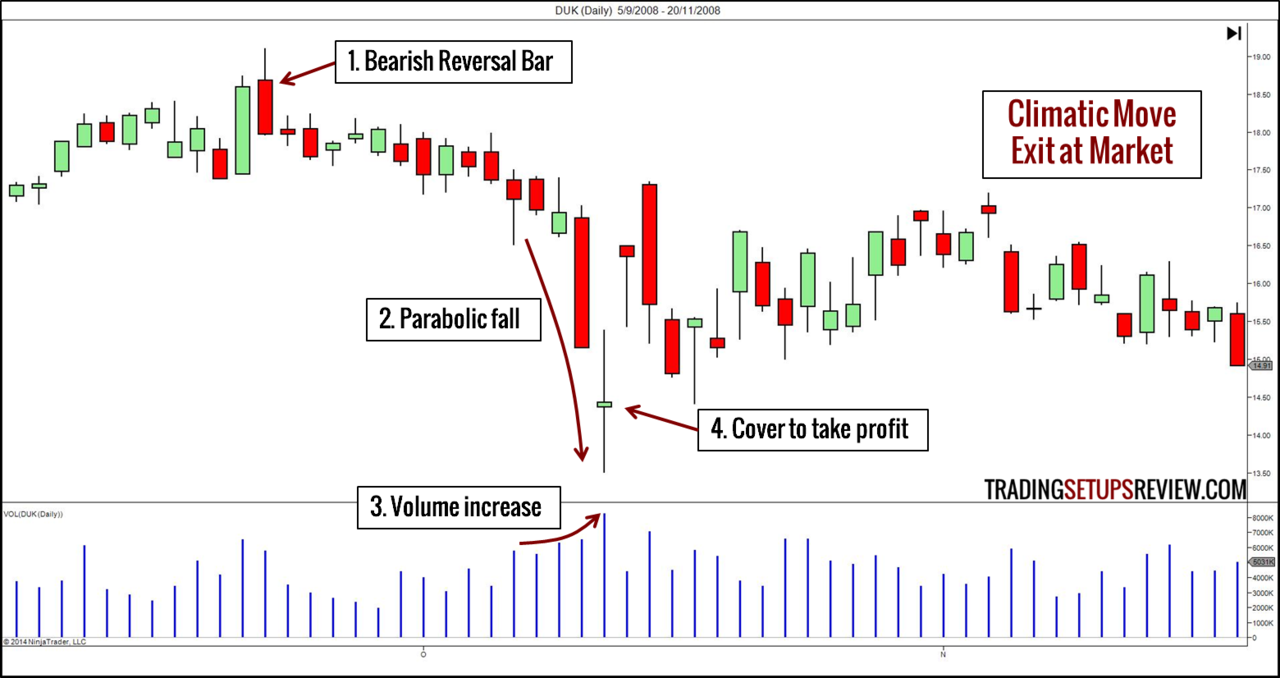
This chart shows an example of exiting at the market following a climatic move.
- We shorted at this bearish Reversal Bar.
- Price fell with a parabolic curve.
- Concurrently, volume increases.
- The above signs of a climatic move prompted us to cover our short position.
After a climax, the market tends move listlessly (as above) or reverses sharply.
Bonus 11 - Point & Figure (P&F) Chart Target Projection
P&F is a unique chart type that focuses only on price action and filters out small price movements (noise). For an introduction to P&F charting, read this section of our guide to price chart types.
It has its own set of chart patterns and unique target projection methods including the horizontal counts and vertical counts.
As P&F charts use pure price action, it might offer a more reliable price objective. At least, it gives us a second opinion for targeting.

.
The Perfect Trade Exit
There you go, ten ways to exit your trades with a profit.
How do we decide among these methods? Consider the following.
Trading Style (Trend or Range)
Let your trading style determine your bias towards target orders or trailing stop-losses.
If you trade trends and want to let profits run, use trailing stop-losses. (Like the Turtles who stop and reverse with each opportunity.)
If you scalp for small profits within a trading range, use target orders.
The premise of range trading is that the market is within a trading range. It follows that the trading range limits our profit potential. Hence, using trailing stop-losses to let profits run is inconsistent.
Trading Time-Frame
Your trading time horizon is also a key consideration.
Day traders will benefit from having target orders. The range of each session limits their profit potential. Facing such limits, there is little point in letting profits run with trailing stop-losses. Target orders are suitable.
If you can hold on to positions without time constraints, then trailing stop-losses might be preferable.
Look for Confluence of Targets
For those using target limit orders, find the best price targets using the concept of confluence.
This means that if you get a Fibonacci extension target, a chart pattern measured target, and a major swing pivot clustering around a price level, you smile.
Perfect Target? Wake up.
Trying to look for the perfect exit is as dangerous as attempting to find the Holy Grail of the perfect entry.
It does not exist, and you will never be happy if you chase it. You will end up hurting your trading performance.
No matter how you exit, you will regret.
Remember that we do not need perfection. We just need profits.