Beginner's Guide To Reading Price Action
By Galen Woods ‐ 8 min read
Reading price action helps to find natural trading opportunities in the market. Put on a different perspective with this guide for beginners.
Reading price action means knowing what the market has done and what it is doing now. Armed with this knowledge, we increase our chances of predicting what the market will do.
(If you have no idea what price action is, take a quick look at our Price Action Trading Primer. We’ll wait here for you.)
Most traders learn how to read price action by learning bar patterns and candlestick patterns. The problem with this approach is that we fixate on names and labels, and interpret them mechanically. As a result, we miss the rich details that reading price action adds to our market analysis.
Hence, in this guide, we will introduce price bars and price action patterns in a microscopic way. This will ingrain in you the skill of reading price action, instead of repeating a bunch of fancy nomenclature.
This is an overview of what you’ll learn in this tutorial.
One Price Bar
A price bar is a visual representation of price data in a given unit of time. Common time units include 5-minute, 30-minute, 1-hour, daily, and weekly.
In this guide on reading price action, we are using a particular type of price bar called candlesticks. And we will refer to bars and candlesticks interchangeably.
We need four pieces of information to draw a price bar.
- Open (O)
- High (H)
- Low (L)
- Close (C)
Plotting price bars with these basic price data (OHLC) is a simple affair.
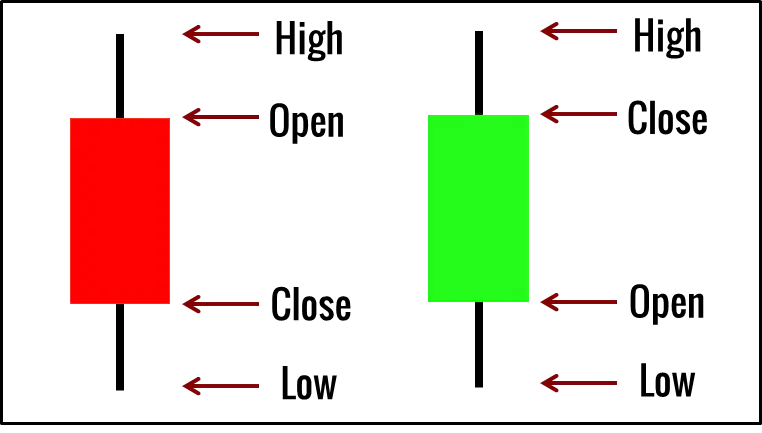
Just remember that when a bar closes higher than it opened, we color the difference green. If it closes below its opening price, we color it red. This distinctive colored body is the only difference between a traditional price bar and a candlestick.
These candlesticks are more than just pretty summaries of OHLC. Once completed, the price bar gives us another four pieces of information that are critical for reading price action.
- Range
- Body
- Upper Tail/Wick/Shadow
- Lower Tail/Wick/Shadow
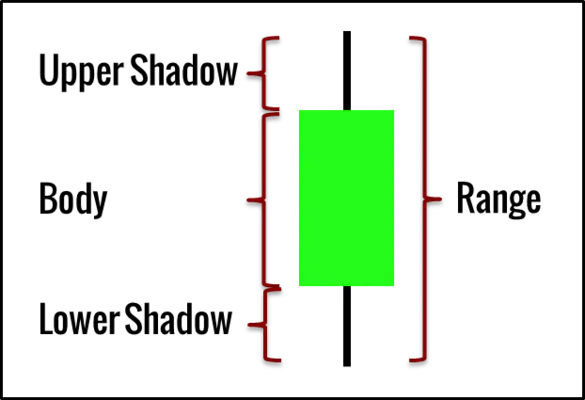
1. Range
The range refers to the extent of the market’s journey within the time unit we examining.
It shows us how volatile the market is. Dead markets move little and cover less ground per unit time. Active markets move around more.
By observing the range of a bar, we are able to assess how volatile the market is.
Is the market sleeping, or running amok? The bar range will tell you.
2. Body
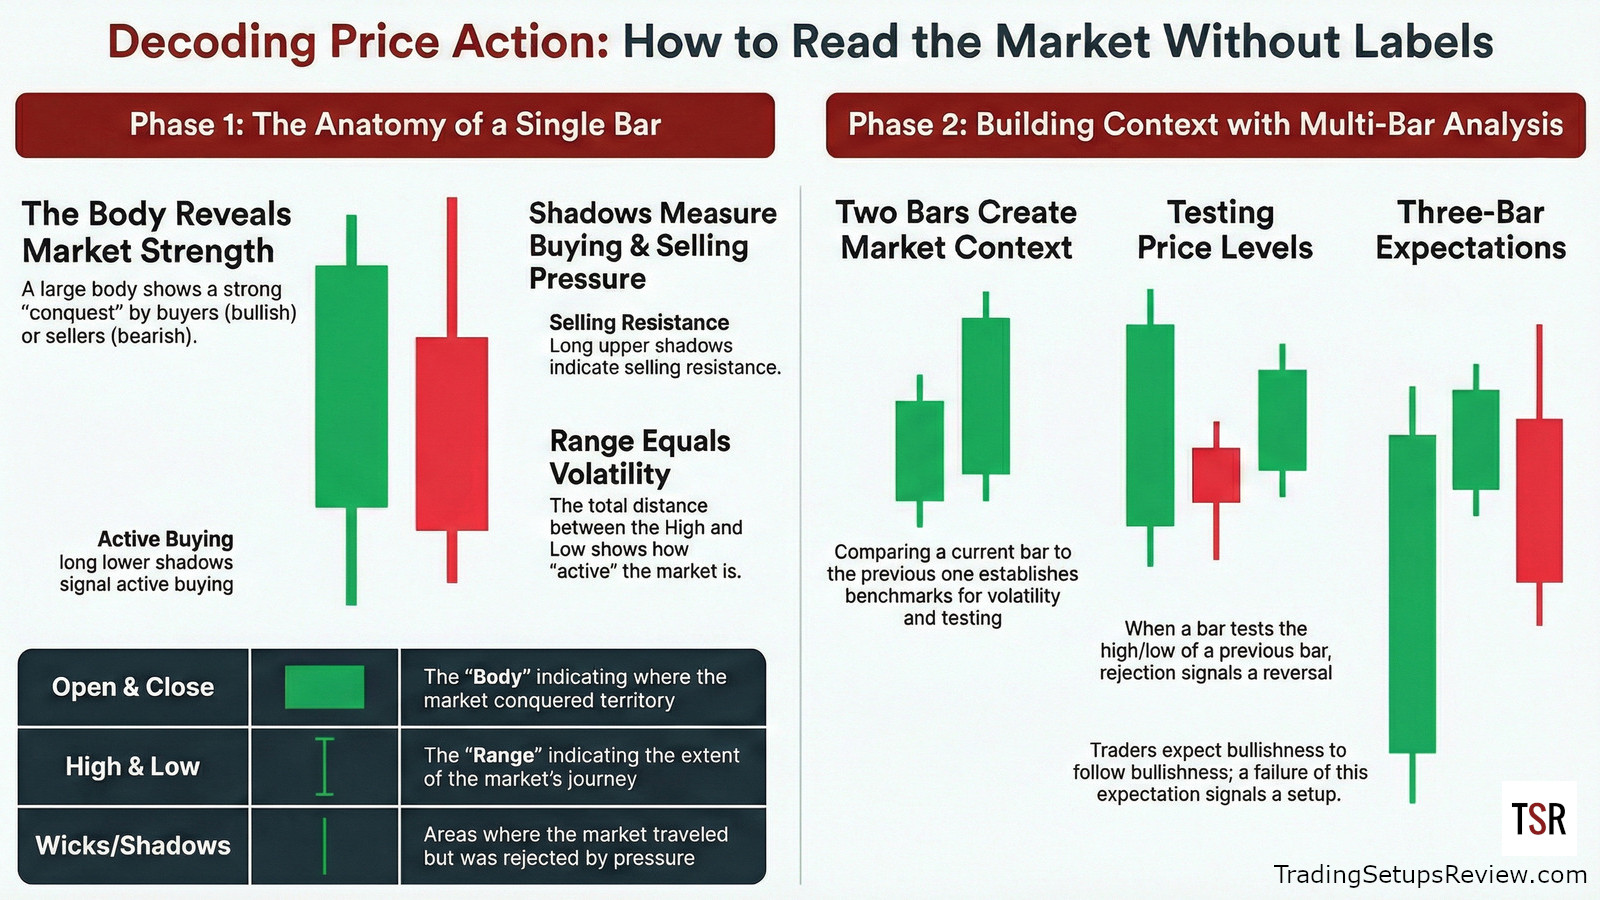
The bar range shows us where the market has battled. Its body shows us where the market has conquered.
It indicates the strength of the bar. The strength is either bullish or bearish.
If the bar closes above its open, regardless of what happened in between, the market has moved up. The bar is bullish. The opposite is true for bars closing below its open.
Furthermore, the size of the body demonstrates the size of the market strength. The diagram below shows the extremes.
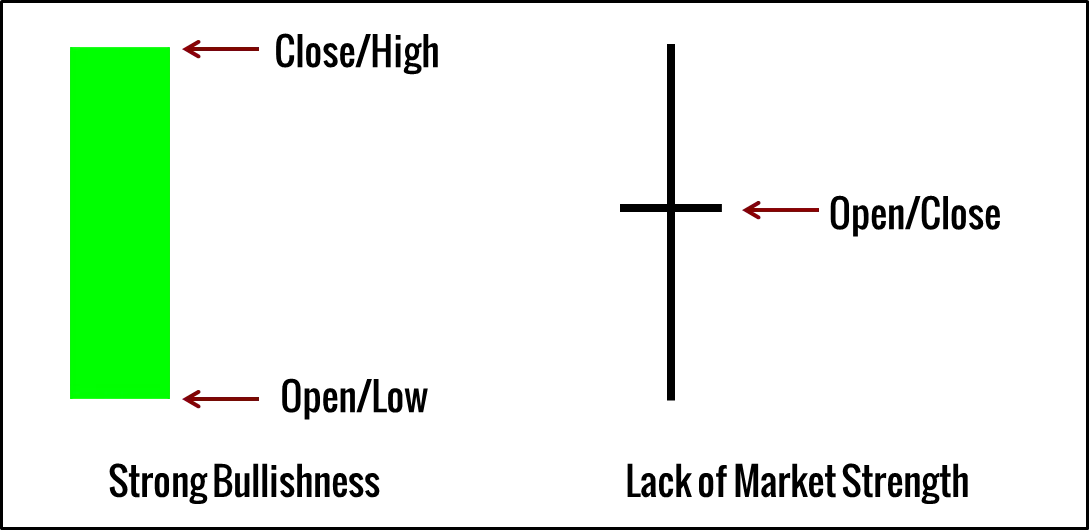
The candlestick body on the left takes up the entire bar. This is the strongest form of an upwards thrust in the market.
The candlestick on the right, however, does not even show a body. The market is undecided.
In candlestick jargon, the former is a marubozu and the latter is a doji. However, we are not talking about labels today, and the names are not important.
What is important is that we are able to answer these questions by observing the candle body.
- Has the market moved up or down?
- How strong was the move?
3. Upper Shadow
Once you understand what the range and the body of each bar signify, we are able to appreciate what the upper shadow implies.
The upper shadow represents the area where the market rose to (as part of its range), but was unable to conquer (as part of its body). It was unable to conquer that area because the market met eager sellers who were more aggressive than the buyers in the market.
Hence, the upper shadow measures selling pressure. The longer the shadow, the more selling pressure the bar exhibits.
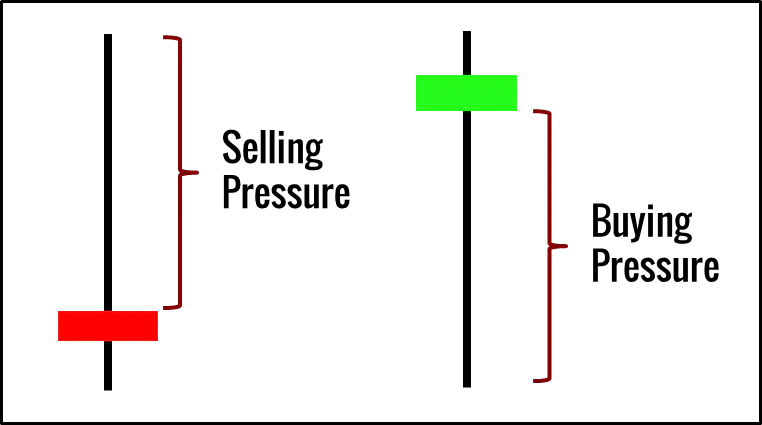
4. Lower Shadow
Apply the same logic to the lower shadow, and you will find the buying pressure of each bar.
The longer the lower shadow, the strong the buying pressure.
Two Price Bars
As we expand our vision to two bars, we are able to introduce two cornerstones in reading price action: context and testing.
Price Action Context
In trading, nothing works in isolation. The context is of utmost importance. The same goes for reading price action.
With two price bars, we gain a context for the second bar. The first bar provides a benchmark to aid us in reading price action.
We know that the range, body, and shadows of a candlestick discloses useful information. For instance, a wide range bar points to high volatility.
But how wide is wide? That is a difficult question.
Using the preceding price bar, we can propose a decent answer. At least, we can highlight bars with a wider range. Wider when we compare it with the preceding bar.
Now, we are more descriptive when we talk about the price action.
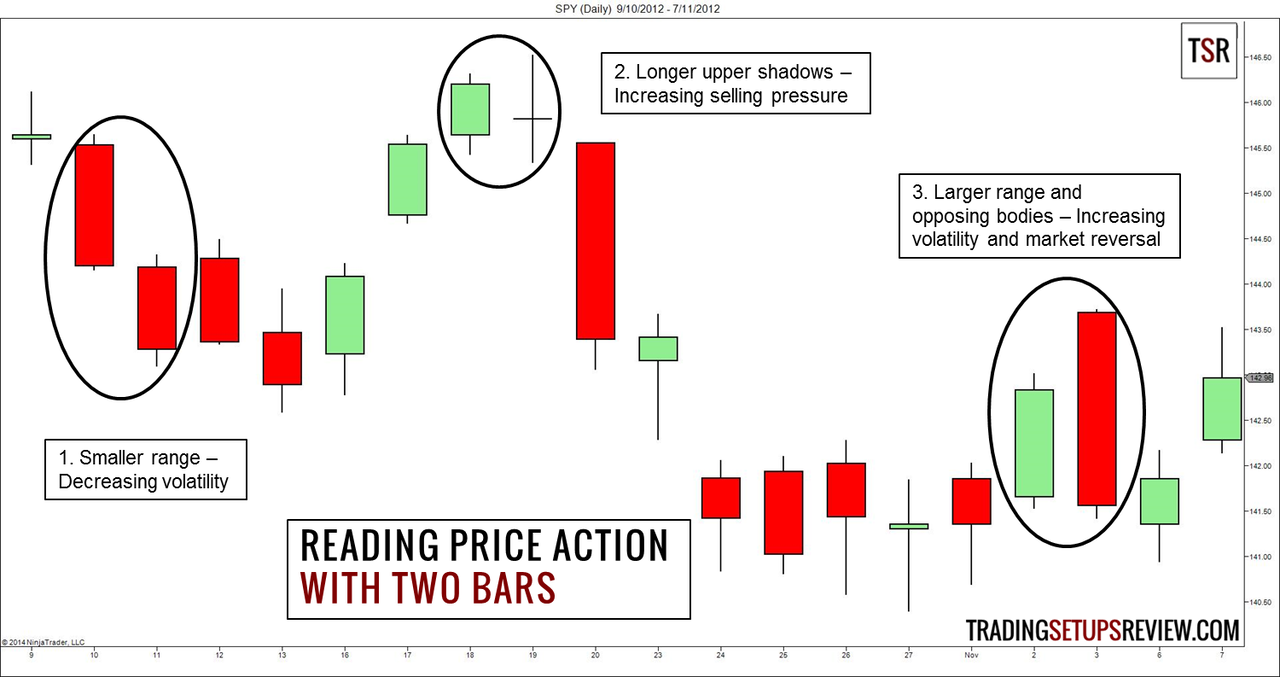
From the chart above, we picked random two-bar combinations to explain what the market was doing in the context of the first bar.
- The market was getting less volatile with decreasing bar range.
- Selling pressure increased as the upper shadows lengthened.
- The market got increasingly volatile as it reversed down.
Testing Price Levels
The concept of testing refers to the market moving towards a price level to “test” if the price level will reject the market’s advances.
The high and low of each price bar are natural support and resistance levels. The test of these levels show the undercurrents of the market and is critical for reading price action.
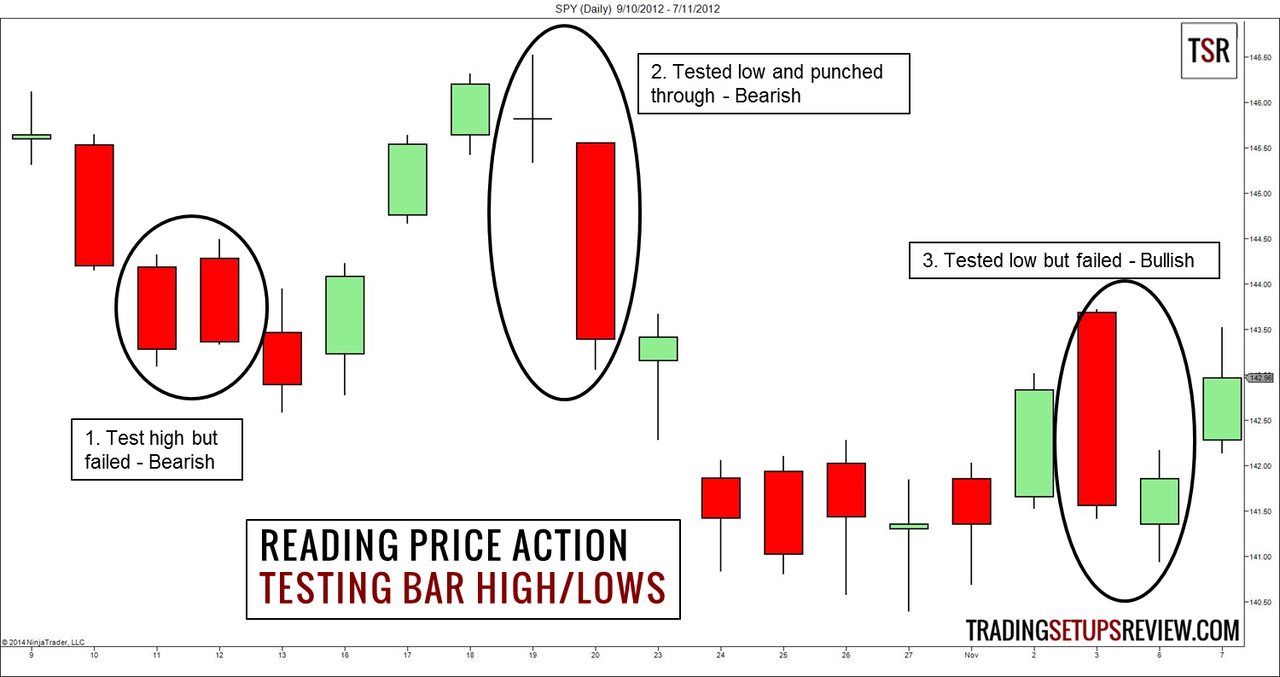
This is the same chart as the previous one. But here, we focused on the testing of bar highs/lows to see what it tells us about the market.
- The second bar rose above the high of the first bar but was rejected. (Bearish)
- The second bar punched below the low of the first bar and continued to become a strong bearish bar. (Bearish)
- After falling below the first bar, the second bar reversed up and closed higher. (Bullish)
Two-bar combinations allows us to see the context of each bar and brings a lot more depth into our price action analysis.
Three Price Bars
With a clear read of two-bar price action, we are able to form expectations of the market. We would expect the market to move in a certain way in the third bar. The confirmation or failure of our expectations reveals more about the market, and add to our price action analysis.
To form expectations, we need to make a very simple assumption about how the market should behave.
Essentially, the market has inertia. Bullishness should follow bullishness, and bearishness should follow bearishness. When it does not, we have to consider a possible change in market direction.
Remember that we are only looking at three bars here. It means that we are referring to very short-term expectations and consequences.
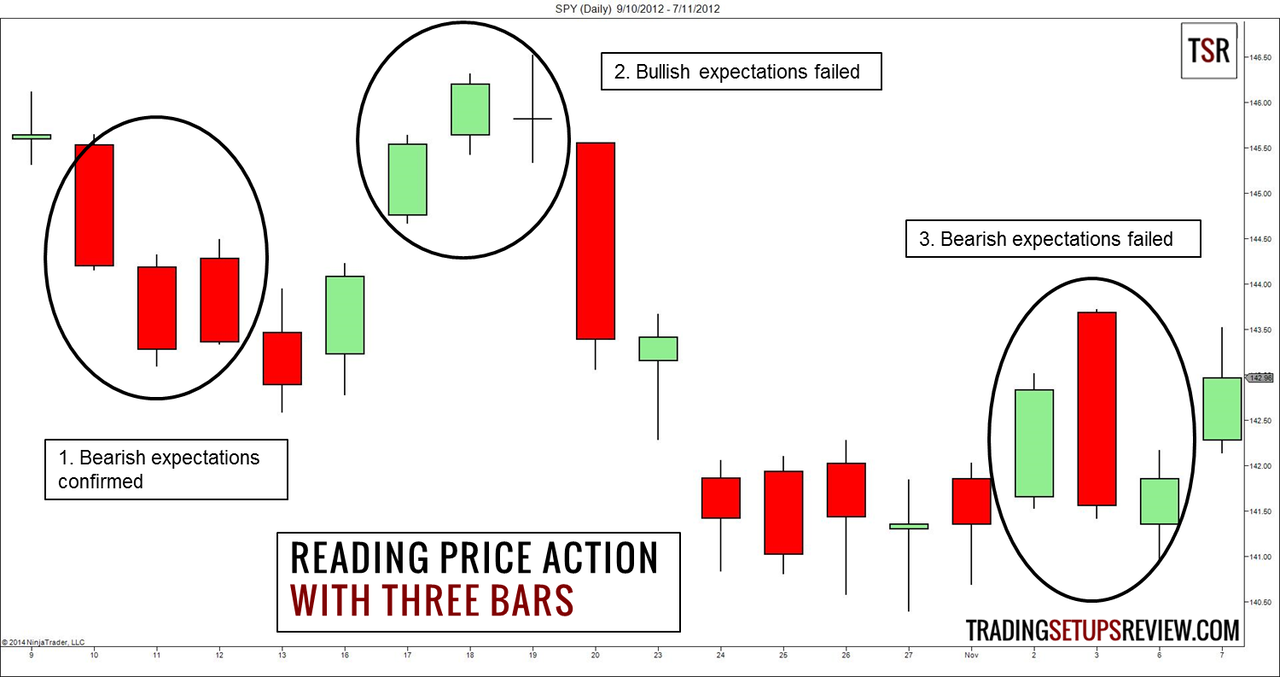
We chose random three-bar combinations from this chart. With the first two bars, we form either bullish or bearish expectations. Then, the third bar revealed if the market met our expectation.
- The first two bars moved down with good strength (body size). Furthermore, the second bar fell below the low of the first bar without much resistance. Hence, we expected that the third bar to turn out bearish. Indeed, the third bar tried rising above the high of the previous bar, but failed.
- The first two bars were the exact opposite of the first example. They led us to form bullish expectations. However, the third bar was rejected by the high of the preceding bar and showed increasing selling pressure. A bearish setup.
- The second bar was bearish regardless of how we looked at it. Hence, we expected the market to fall further. Instead, the third bar was bullish. This failure of our bearish expectations point north.
Reading Price Action
Our three-bar analysis process brought us through the essential concepts of reading price action.
Once you grow comfortable with reading price action with this generic approach, you have no need for names and labels, except for ease of communication with other traders.
To prove the practical value of the skills you have picked up in this guide, let’s take a look at the two examples below.
Morning Star Pattern
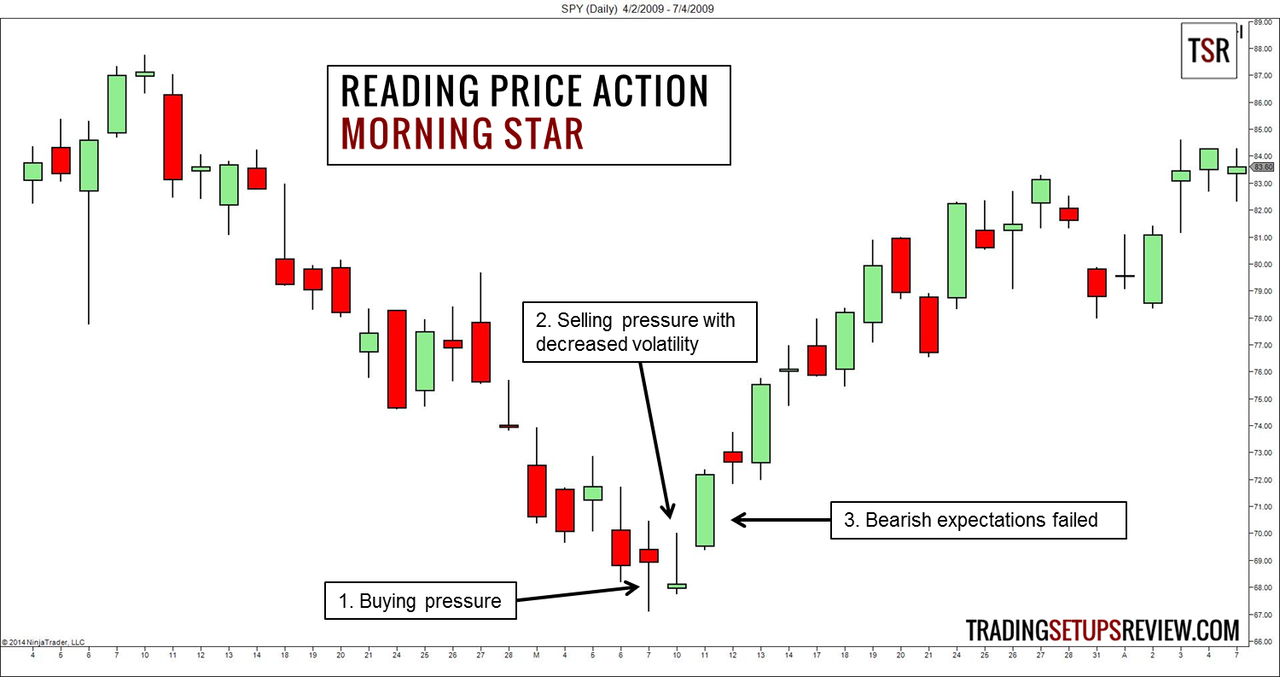
This chart bottomed out with a morning star pattern. What is a morning star pattern? Doesn’t matter.
- Long lower shadow implied buying pressure.
- Volatility decreased with some selling pressure. While these two bars were not clearly directional, our bet went with the bears due to the long upper tail.
- However, instead of falling, the market rose up strongly. This failure of bearish expectations presented a bullish setup.
This three-bar pattern is what candlestick traders call a morning star.
Pin Bar
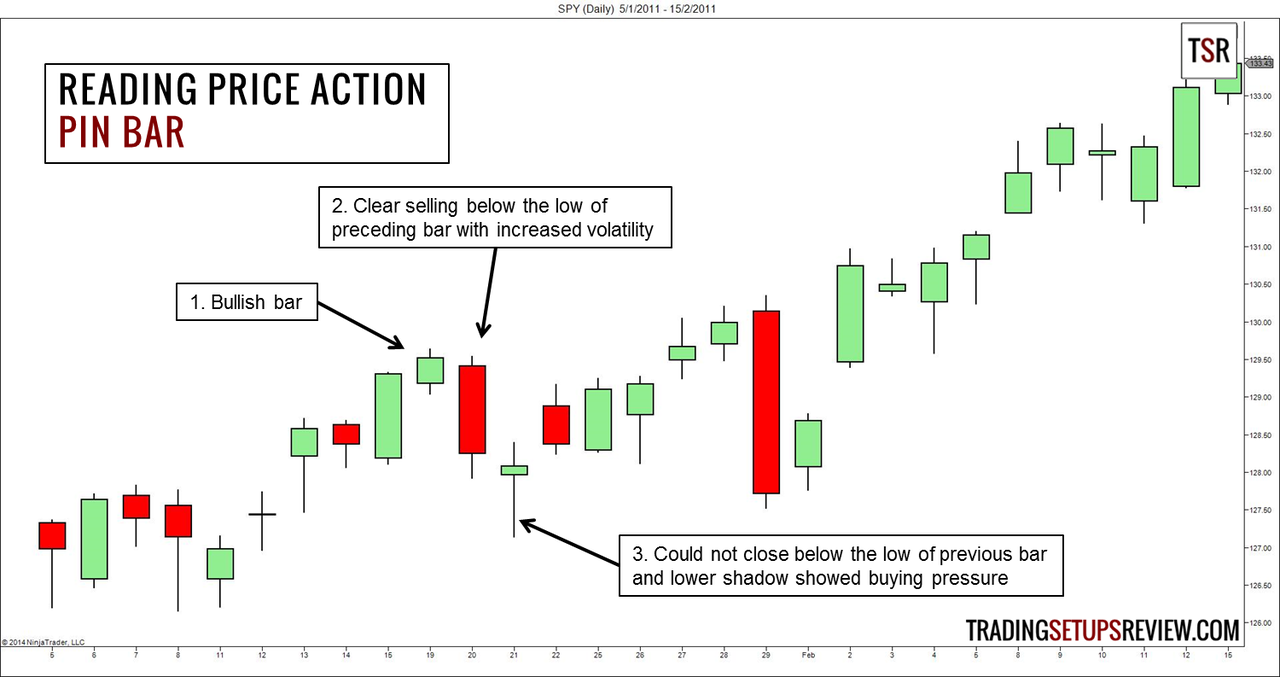
This chart shows the popular pin bar pattern.
- The first bar was a nice bullish bar.
- The second bar was a strong bearish bar that fell below the preceding bar with increasing volatility. Naturally, we expected the next bar to unfold in a bearish way.
- However, after testing the low of the second bar, buying pressure asserted itself and prevented the market from falling more. This unexpected bullish turn presented a bullish setup. (pin bar)
A Rose By Any Other Name Would Smell As Sweet
An unlikely Shakespearean source summarized a key idea for reading price action.
Reading price action is not about finding pin bars, outside bars, engulfing patterns, or any other names. It is about observing price bars as they form and understanding what the market has done and is doing. Once you master the skill of reading price action, you can pinpoint setups without relying on dozens of labels. Learn how to hone your trading instincts like the samurais.
However, reading price action is not enough for trading price action. It is a critical first step that many beginners overlook, but it is not complete.
The next step is to combine short-term price action with long-term support and resistance, and market structure. Proceed and conquer.