Chart Background Color Indicator
By Galen Woods ‐ 3 min read
Focus price action while monitoring an indicator's trend
Indicators are helpful, even for price action traders. But you should follow two principles to make the most out of indicators.
1st Principle - Focus on price action.
Indicators should take a secondary, supportive role.
2nd Principle - Pay attention to the direction of the indicator.
Many traders search for specific values of an indicator. An example is looking for oversold values using the Stochastics indicator (<25).
However, the trend of the indicator values holds valuable information too. The ADX is one example.
Moreover, some indicators like the OBV are meaningless unless you study its trend.
To apply these two principles with ease, use the Chart Background Color Indicator.
The Chart Background Color Indicator
This indicator colors the background of a price chart to show if the indicator value has increased or decreased compared to the previous price bar.
With a colored background highlighting the changes in indicator values, you can maintain price action at the forefront of your analysis.
You can get it from our Ko-fi shop.
Setting Up The Indicator
Not sure how to import the indicator? Refer to this article for instructions.
IMPORTANT
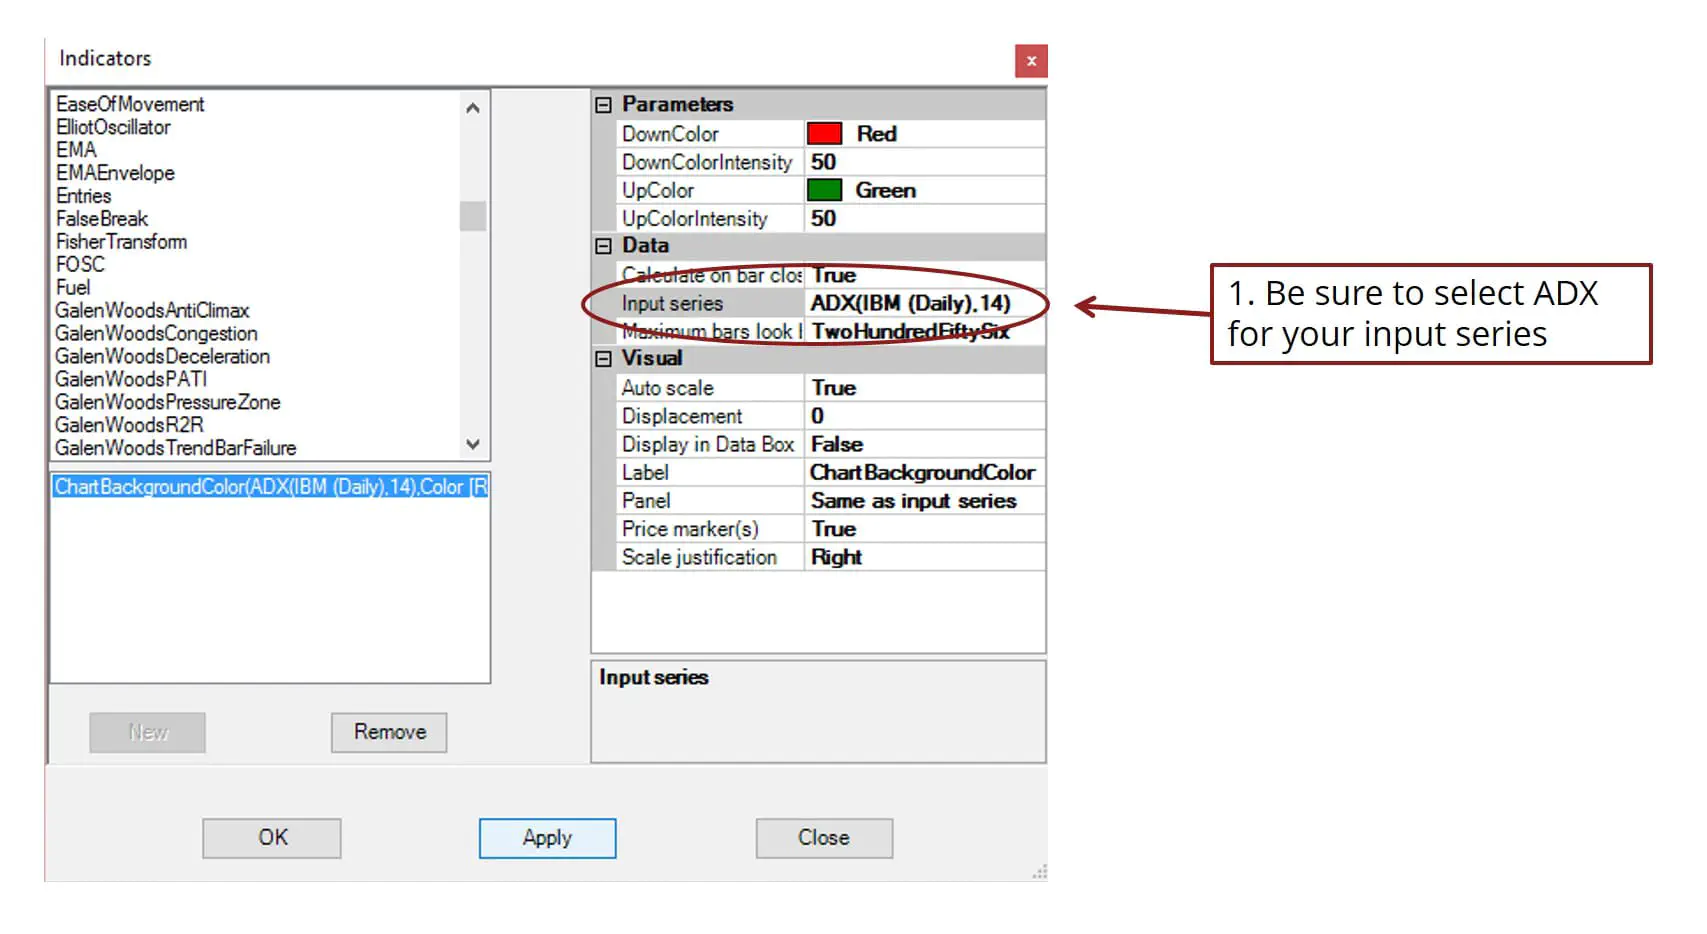
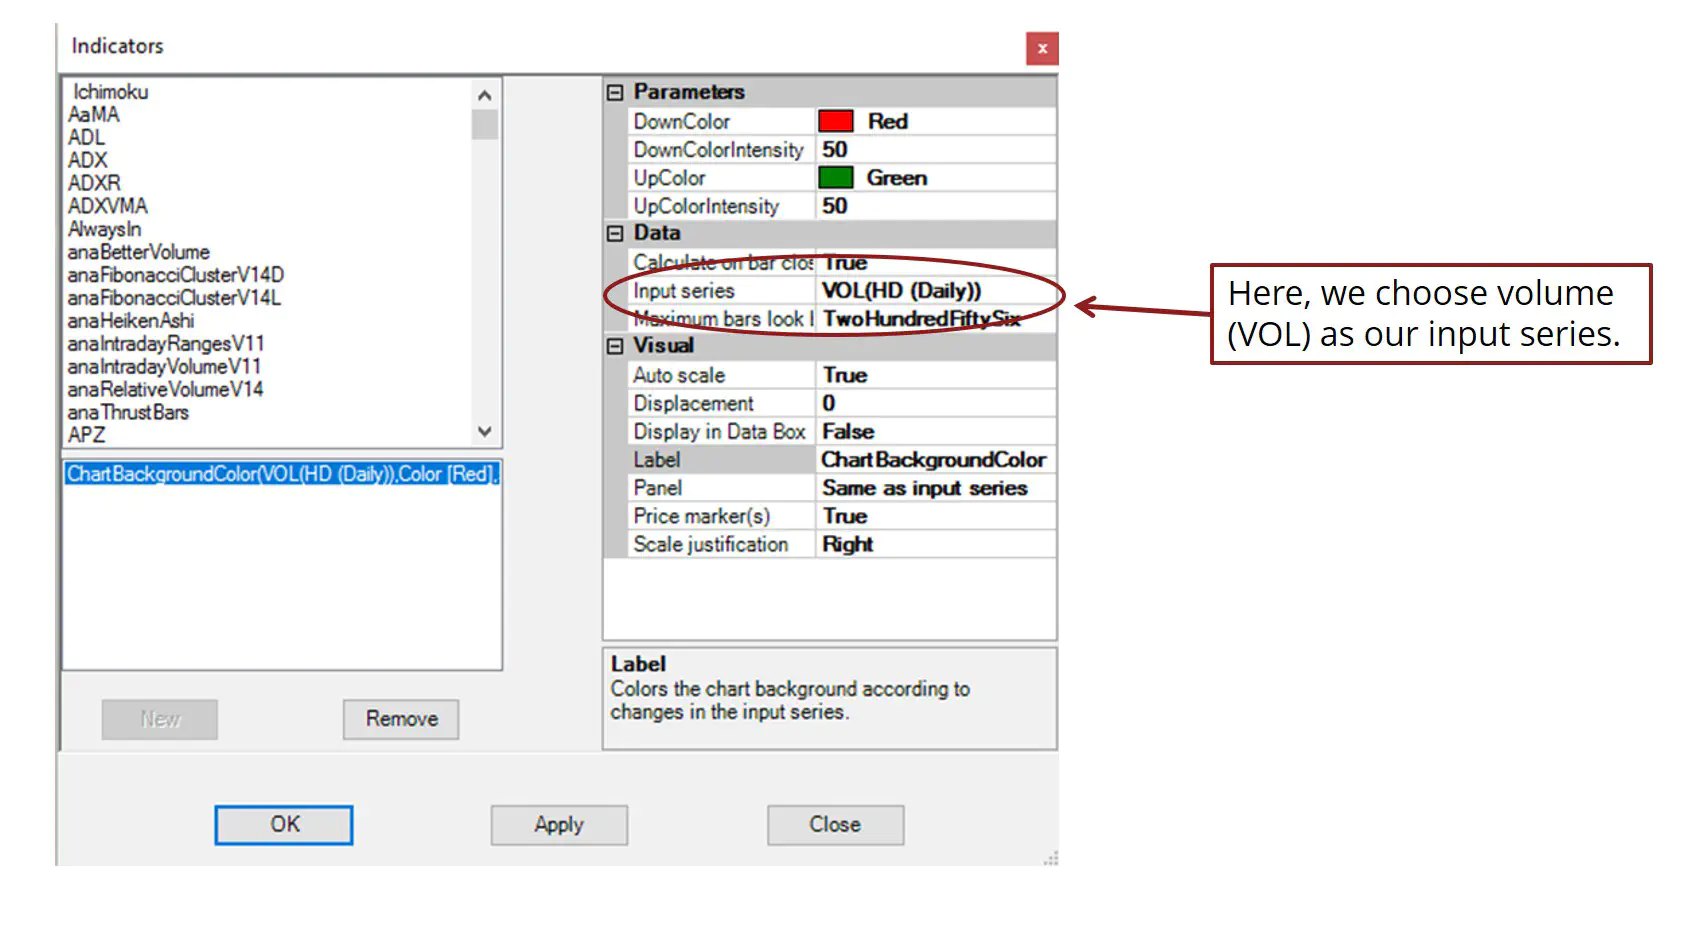
1. Under the indicator settings, click on “Data” > “Input series” > “…”
2. Choose your desired indicator from the dialog box. E.g., ADX
Other Parameters
DownColor - Background color for increasing values.
DownColorIntensity - Intensity of colored background increasing values.
UpColor - Color for volume decreasing values.
4. DownColorIntensity - Intensity of colored background increasing values.
Examples of Chart Background Color In Use
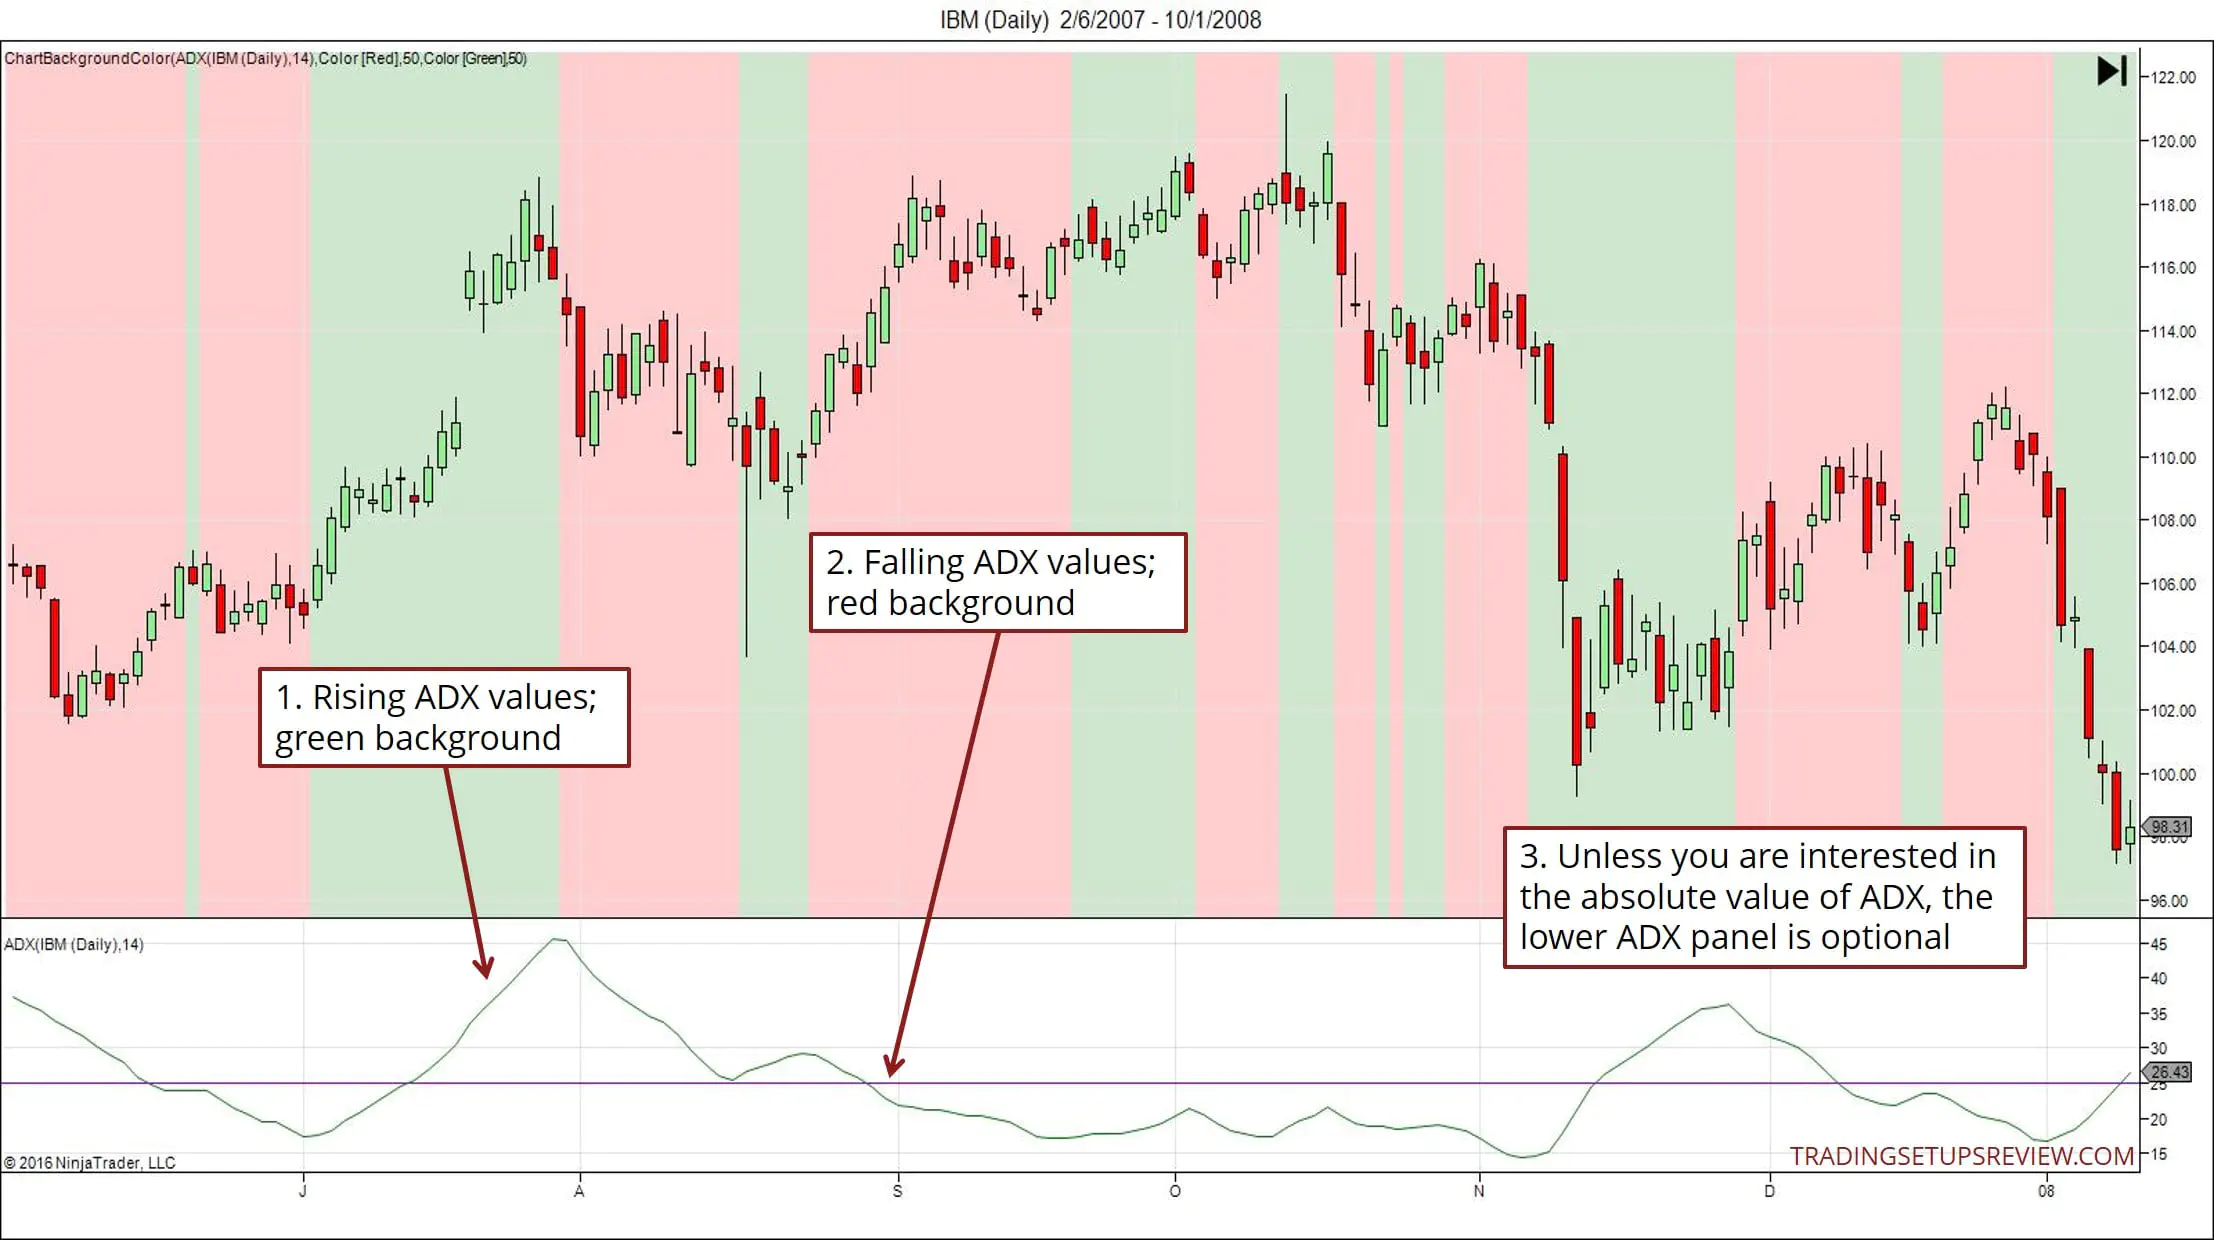
#1: Using the ADX indicator to track if the market is trending or ranging
Traders often overlook the slope of the ADX indicator, which gives an early signal of the market’s trending tendencies.
For more details and examples of using the ADX slope in your trading, read this article.
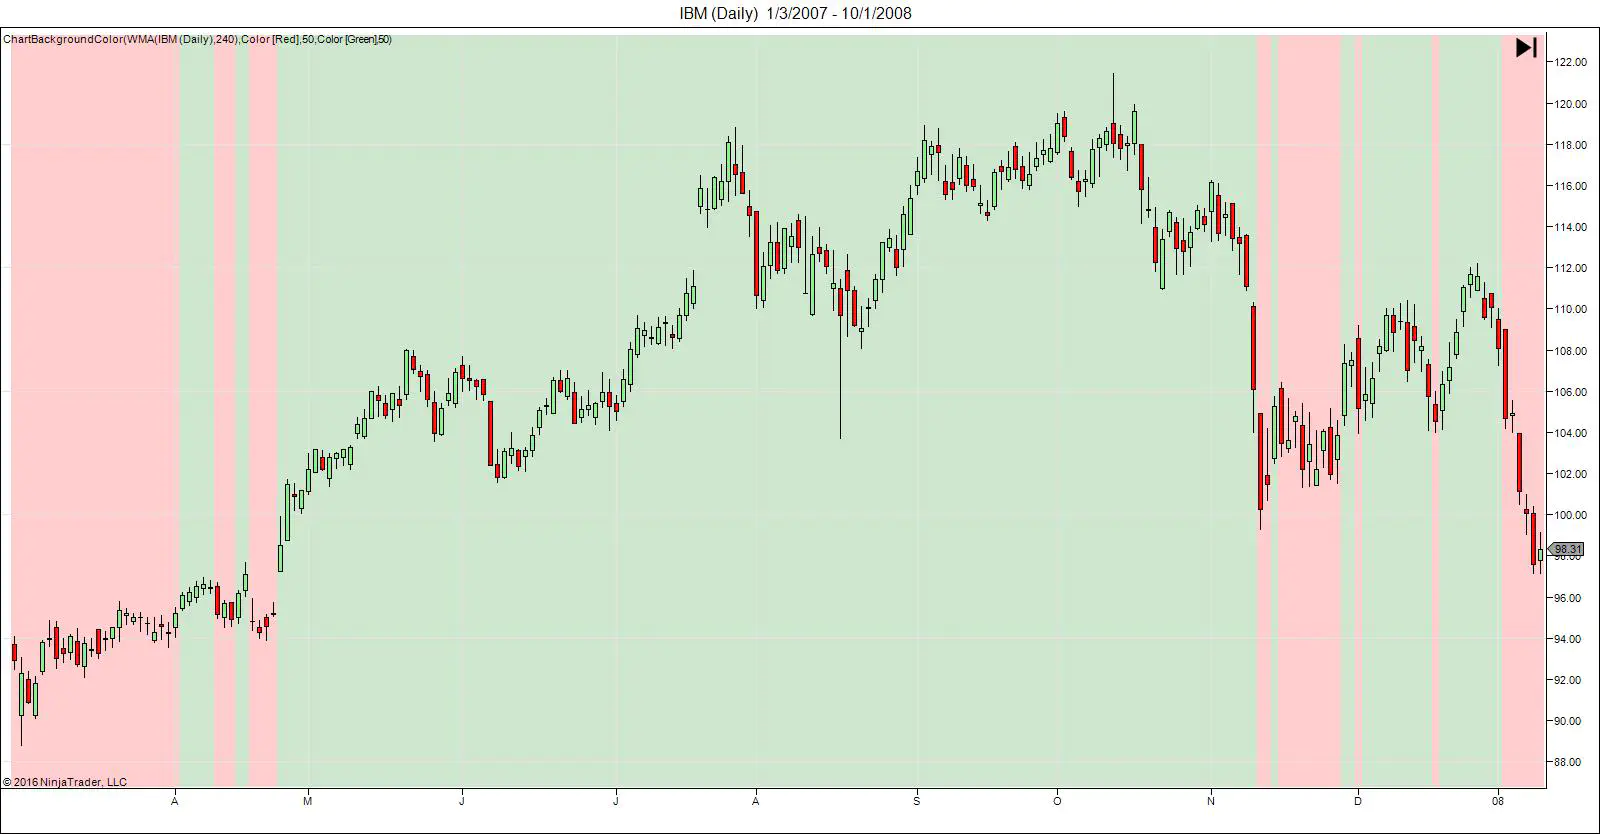
#2: Using a moving average to track market bias
You will find this chart configuration helpful if you like strategies that use moving averages.
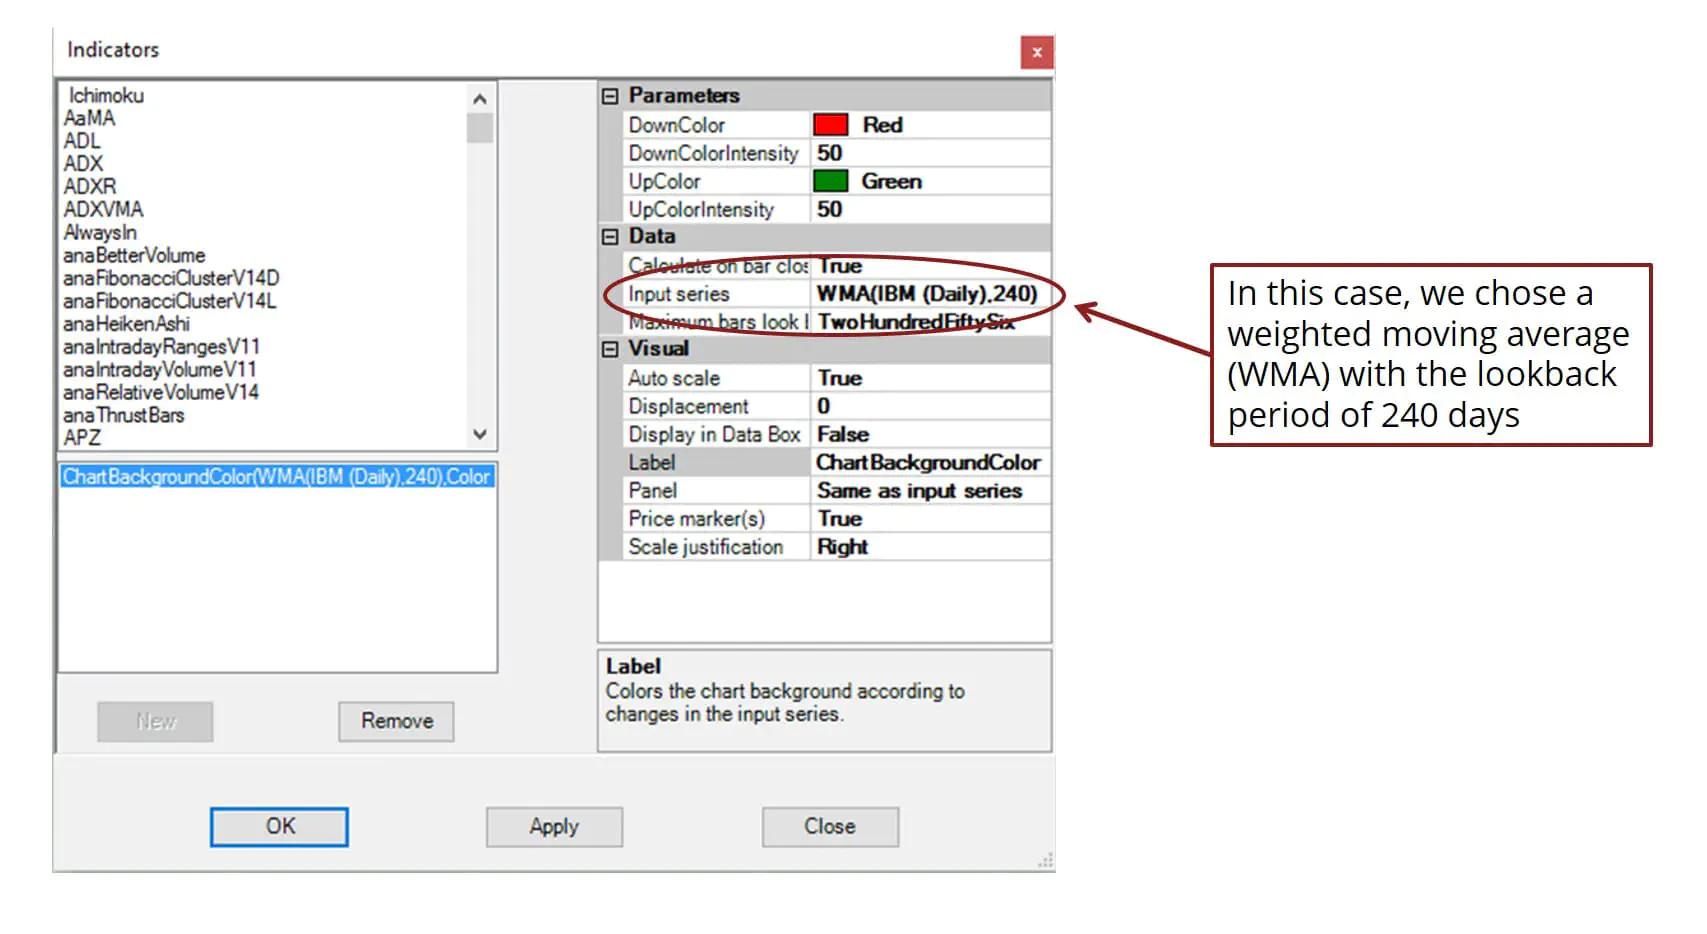
With this, you can enjoy the benefit of a clean price chart while keeping track of the long-term trend using the WMA.
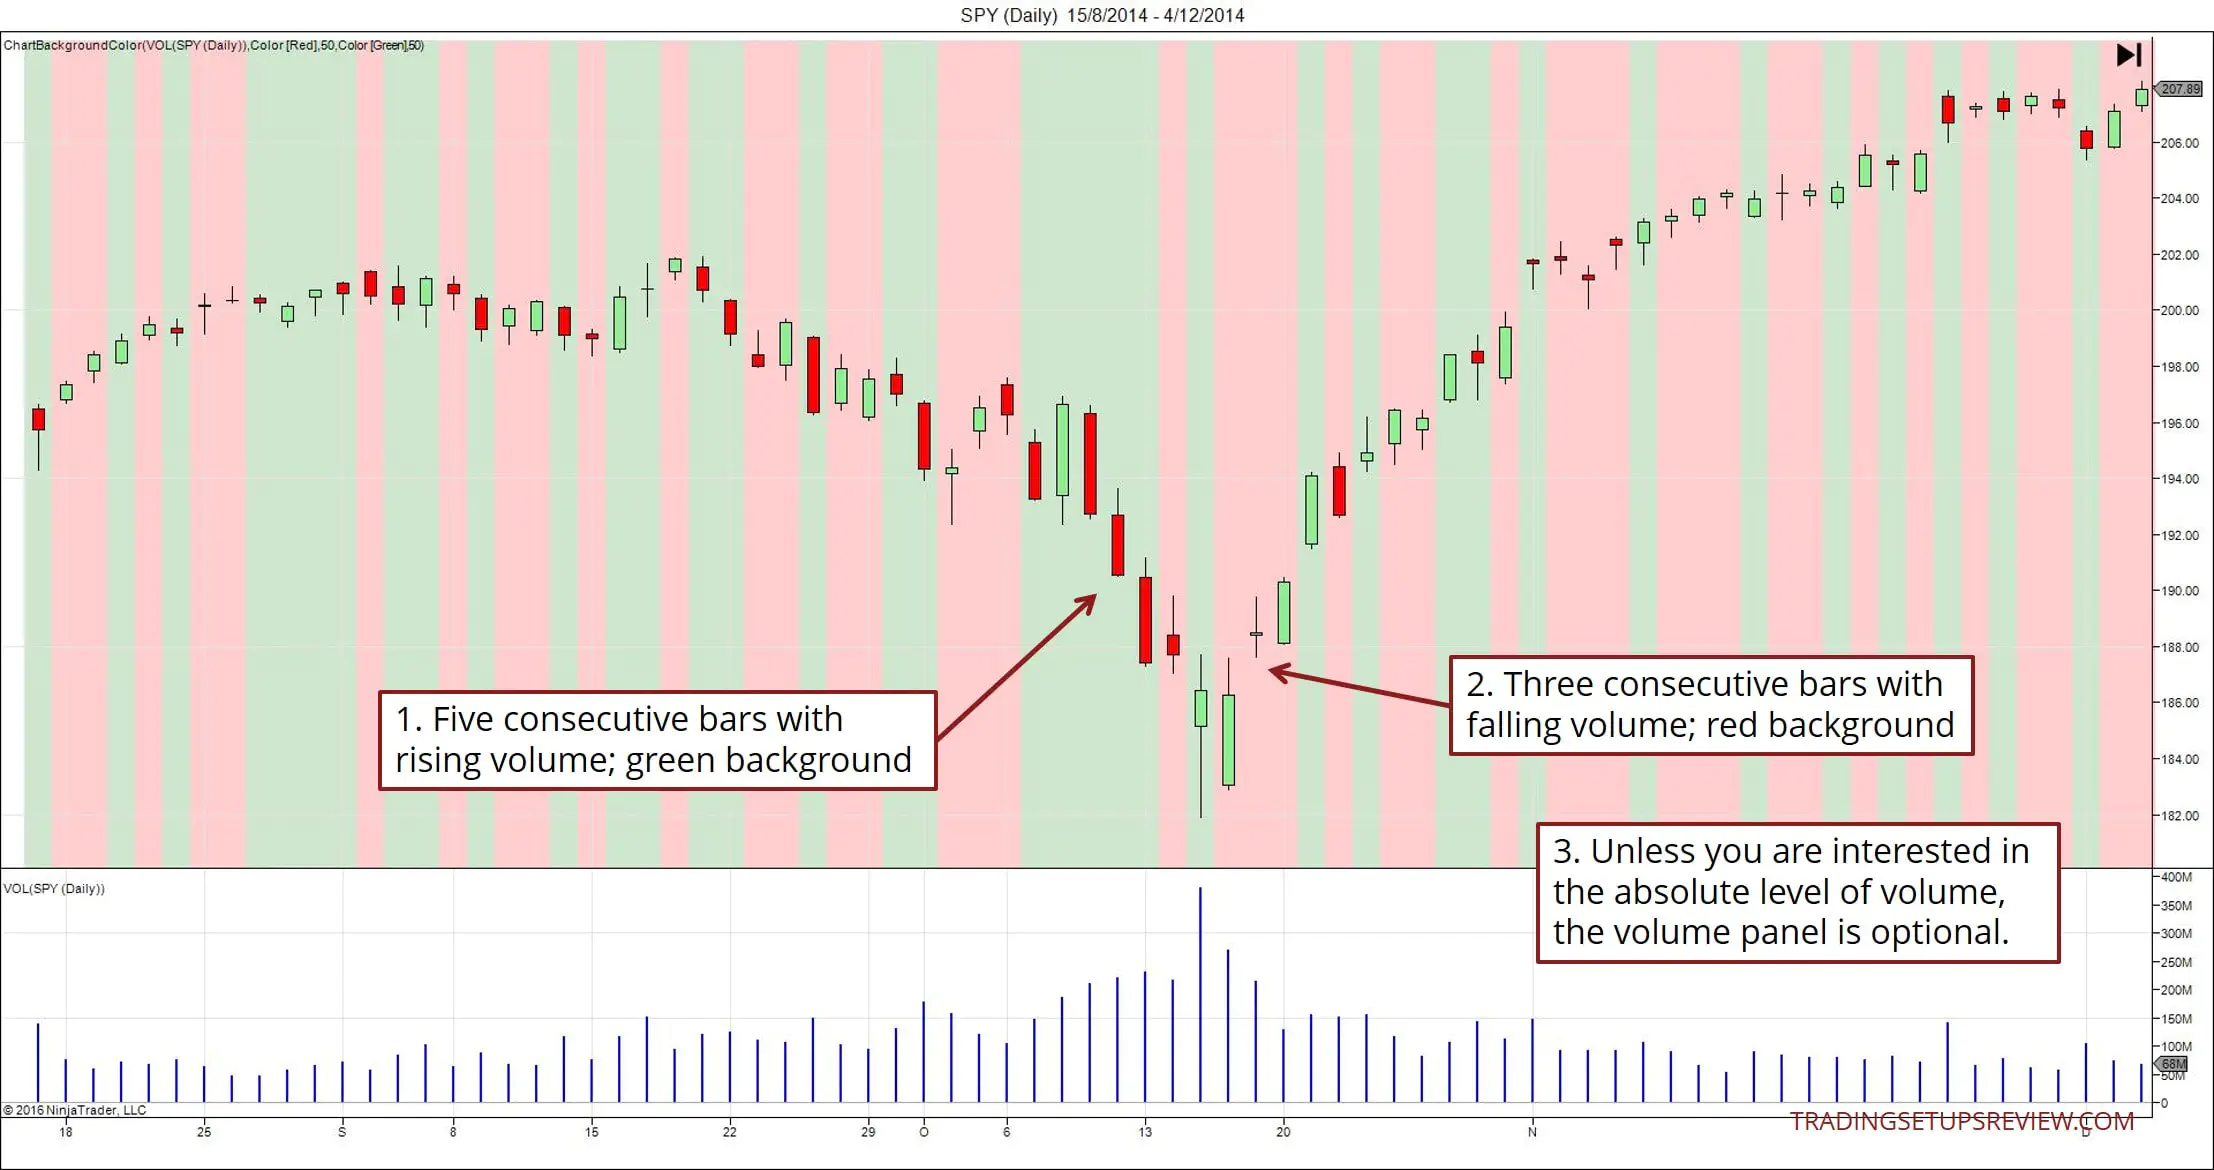
#3: Observe Price Action With Volume Changes
As a price action trader, you want to focus on price movement. But you might also appreciate the power of volume changes.
With this indicator, you can observe the impact of decreasing or increasing volume. Just choose “VOL” as your input series.
One of the most valuable signals arises when you see volume falling (or rising) continuously over three or more price bars. A sustained increase or decrease in volume always deserves a closer look.
For more examples of tracking volume with this indicator, refer to these articles:
Endless Possibilities
This indicator is a versatile tool. For its input series, you can select:
- Any indicator
- Price component (Open, high, low, close, typical)
- Volume
Experiment with it. Observing the trend of indicators and price/volume data is an excellent way to uncover new relationships you can exploit in your trading.
You can get it from our Ko-fi shop.