Swing Trading with Trend Lines
By Galen Woods ‐ 7 min read
Trend lines are like jackknifes. One nifty tool with several edges. Learn how to use trend lines to catch the next market swing in your favor.
The trend line is one of the most powerful tools for technical traders. If you are not already drawing trend lines, you have an excellent opportunity to add value to your market analysis with this simple tool. But first, what makes a trend line effective?
The effectiveness of the deceptively simple trend line comes from the many facets hidden within.
Just add one line to your charts. And you get help with clarifying the following:
- Trend
- Momentum
- Support/resistance
- Entry timing
In this article, instead of presenting a typical trading strategy with rigid rules, we will explore the potential uses of trend lines for swing trading.
Here, our primary goal is to understand trend lines thoroughly so that regardless of your current trading approach, you can find some ways to integrate this helpful tool.
How to Draw a Trend Line?
The first step is to lay some ground rules for drawing trend lines.
Basic geometry says that we need two points to draw a line. And this is exactly what we need to do to draw a trend line.
Drawing a Bullish Trend Line
Trend lines track trends, so drawing a bullish trend line only makes sense when the market is trending higher.

Steps to draw a bull trend line:
- Choose two support points.
- The more recent one must be at a higher price.
- Connect them. (Preferably, the line does not cut through other price bars.)
- Project the resulting line to the right.
- The resulting line is a bullish trend line.
Drawing a Bearish Trend Line
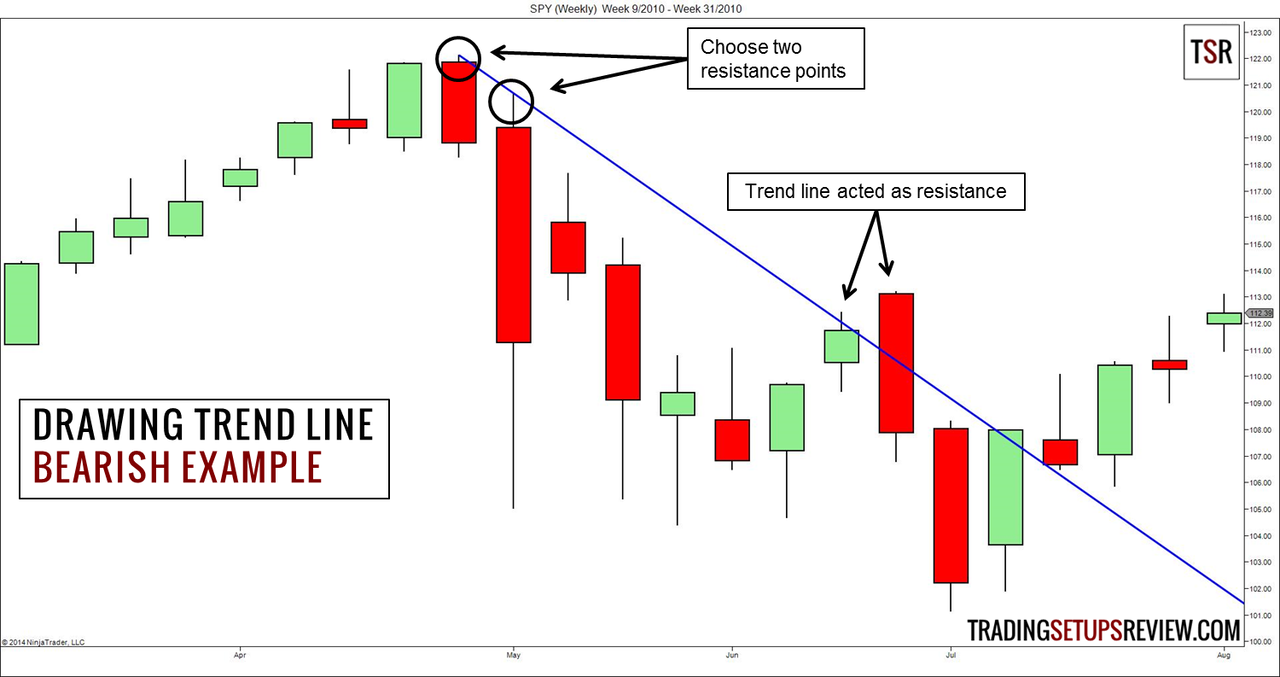
Steps to draw a bear trend line:
- Choose two points of resistance.
- The more recent one must be at a lower price.
- Connect them. (Preferably, the line does not cut through other price bars.)
- Project the resulting line to the right.
- The resulting line is a bearish trend line.
The Art of Drawing Trend Lines
The two examples emphasize that there are varying methods to select the two points you use to project a trend line.
- The bullish example used two major swing pivot lows for drawing the trend line.
- The bearish example used two consecutive bar highs to draw the downwards sloping line. (This article discusses a similar micro approach involving channel trend lines.)
Which is the right way to draw a trend line?
Both trend lines are valid, and the key is how you interpret them.
In most cases, if you choose two significant S/R points, the resulting trend line bears greater weight over a longer time. Conversely, if you select two minor S/R (like in the bearish example above), the trend line is more effective within a shorter period.
Think of them as tracking trends of different significance.
Why is a Trend Line Useful for Swing Trading?
Before we dive into an in-depth chart example, let’s go through the theory to understand the utility of trend lines in the context of swing trading.
Swing traders expect to profit from a market swing. Thus, a standard game plan is to find trending stocks and wait to enter on the retracement. (An example is the Holy Grail trading setup.)
Trend Line and Price Action
Let’s see how a trend line acts as an all-in-one tool for swing traders looking for trend retracement trades.
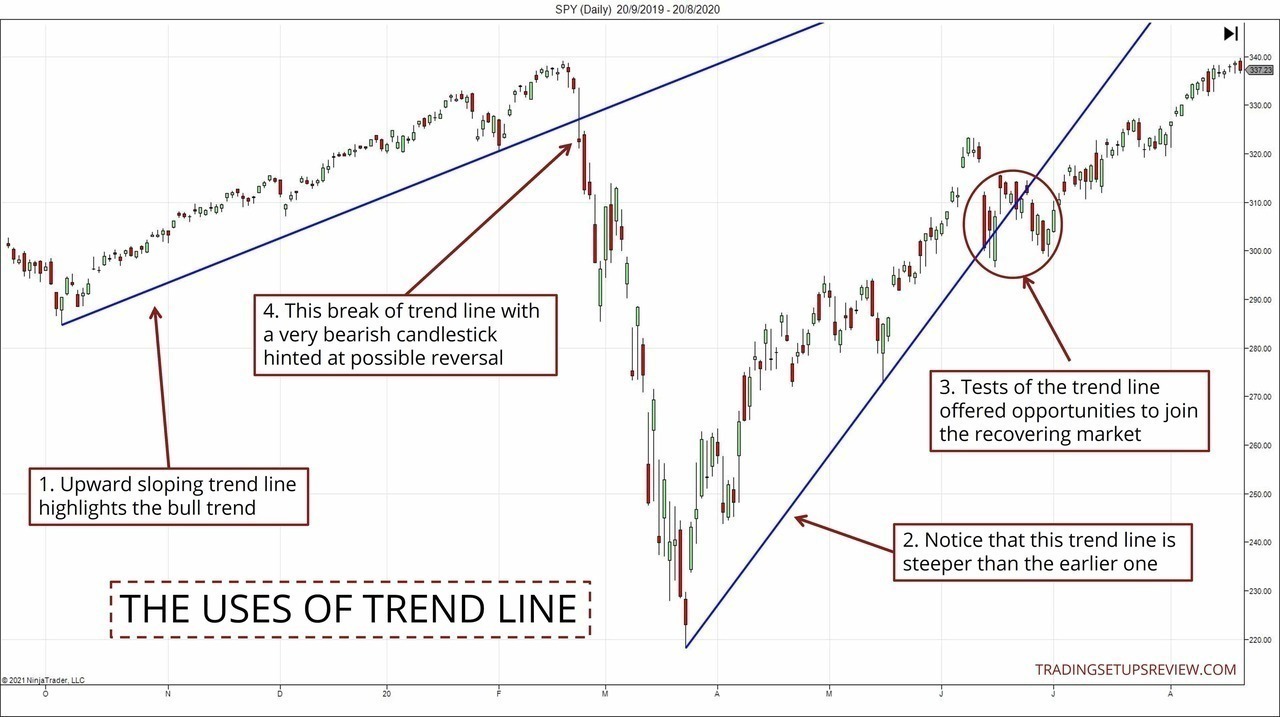
- First, the direction of a trend line (whether it slopes up or down) shows the established (and perhaps expected) trend. It tells the swing trader if the market is trending up or down.
- Next, the steepness of a trend line shows the trend’s strength. For example, observe the two bull trend lines in the chart above, and you can tell that the bulls were more eager during the recovery compared to the established trend before the crash in early 2020.
- In addition, the trend line itself acts as a support/resistance, offering a hot zone for trading setups. Hence, it provides swing traders with a practical way to find retracement entries as the market pulls back to test a trend line.
- Finally, a trend line break hints at a possible reversal, especially when a solid and decisive break occurs. However, remember that in a trending market, most trend line breaks are false alarms.
Another note on the trend line slope is that a healthy trend usually comes with a moderate slope.
Shallow trend lines show possible sideways action. In this case, stay out of the market or aim for a more conservative target. On the other hand, an ultra-steep trend line suggests an unsustainable trend. In this situation, lookout for signs of reversal or wait for a deeper retracement before entering.
Are you fascinated by this versatile tool?
Let’s study it further with a detailed example.
Swing Trading with Trend Lines - Example
In our trend line practice, we are using the daily candlestick chart of the United Technologies Corporation (UTX on NYSE).
A Confluence of Trend Line Support
A vital feature of the chart below is the flipping of the broken bear trend line into a support level.
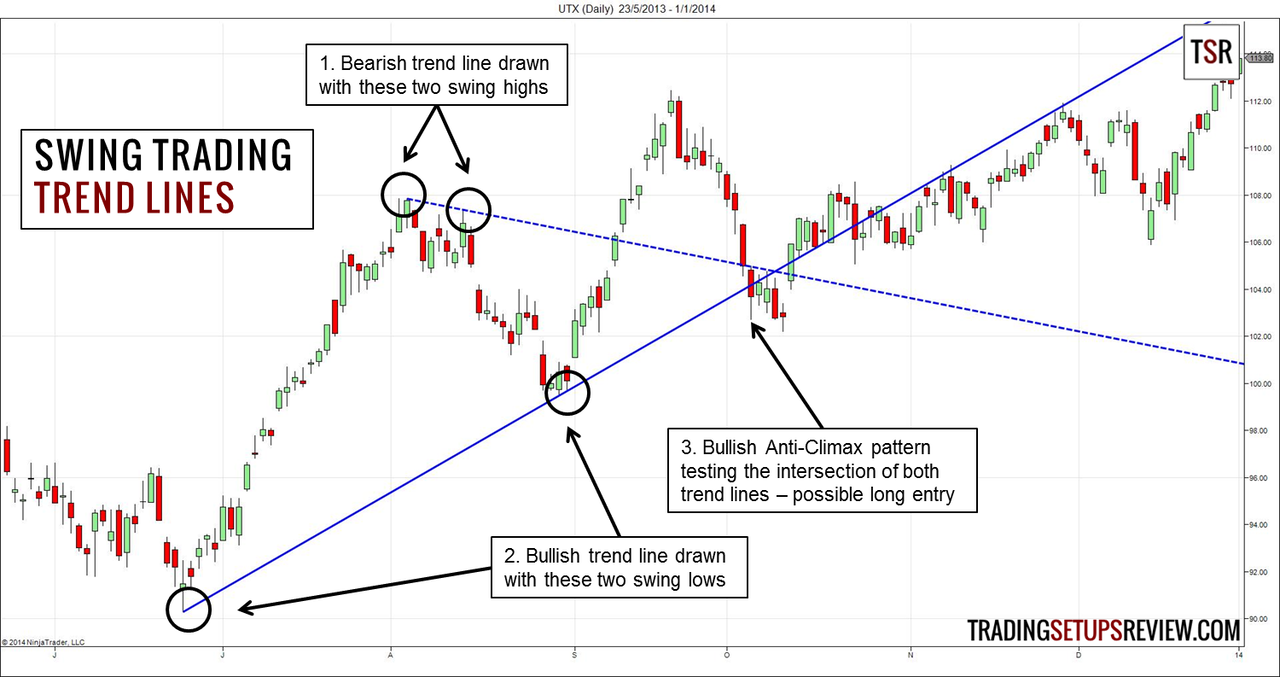
- With these two swing highs, we projected a bearish trend line. (dotted line)
- After falling for around a month, the market recovered and rose to a new high. At the same time, we drew a bullish trend line with the lowest low of this recent pullback and a preceding swing low.
- The market tested the intersection of both trend lines with a bullish Anti-Climax pattern. With the broken bearish trend line and the recent bullish trend line as support, we located a solid potential long swing trade.
Swing traders who like quick trades can exit after the first three consecutive bullish bars. Traders who are more patient can target the last extreme high of the current bull trend. In the latter case, you need more nerves to hold through the meandering, which was well worth it.
Trend Line Adjustment
The chart below shows the price action that followed.
This expanded example demonstrates how trend line analysis continues to offer value as long as we adjust the trend line to account for new price action.
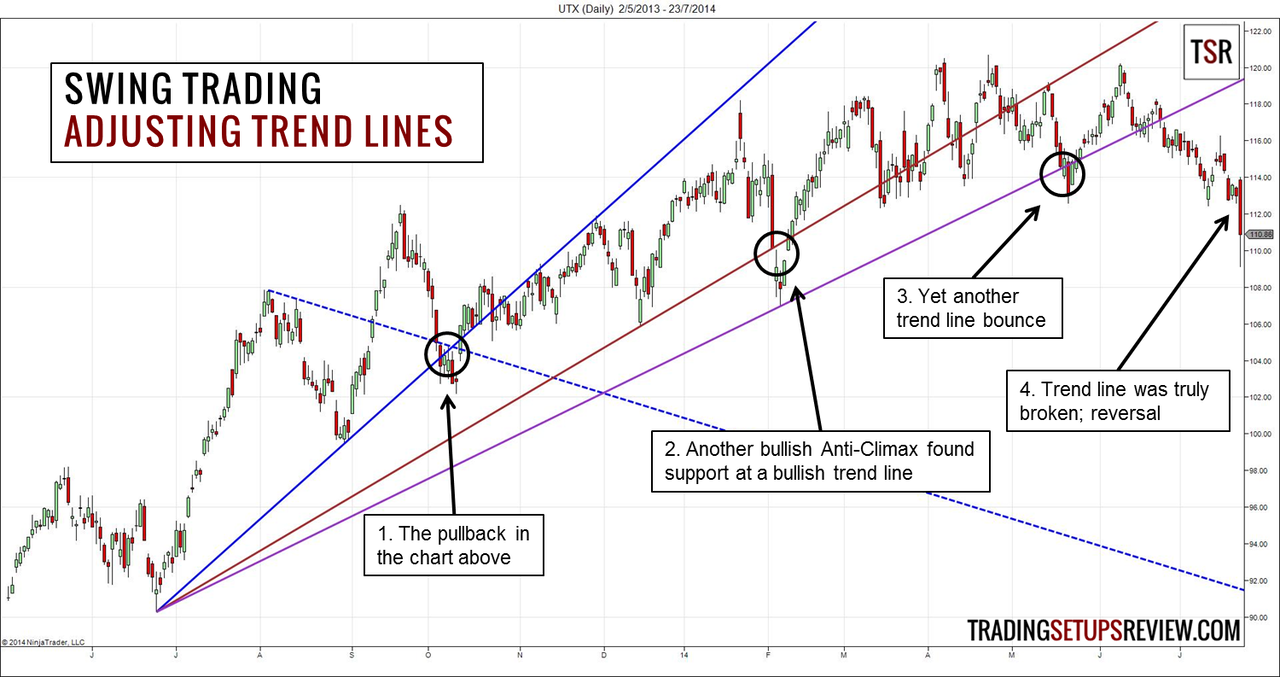
- This area corresponds to the first close-up chart above.
- As the market moved higher, we adjusted the trend line to a shallower one (in brown) which was again tested by a bullish Anti-Climax pattern.
- Another adjustment produced the third trend line (purple), which supported the market again. Critically, note that each trend line was shallower than the one before, showing a weakening trend.
- Despite a brief upswing, the market fell through the purple trend line. The robust and sustained downswing signaled a bearish trend reversal.
You might think that the examples above are textbook examples. This means that I must have looked at the chart ex-post and drawn the trend lines so that they seem to work well.
You are right, partly. Indeed, they are textbook examples, as I needed illustrative examples to show you how trend lines work, in theory.
However, the key here is that I did not draw the trend lines arbitrarily so that they seem compelling. Instead, I adhere to a consistent method of drawing trend lines, and I always draw my trend lines the same way.
(Traders who studied my price action trading course would be able to tell that those trend lines are drawn with valid pivots.)
Trend Line Trading - Consistency is the Key
Drawing a trend line is a simple method for swing traders to track their favorite stocks or currency pairs.
However, trend lines might seem perfect in hindsight but useless in actual trading.
To avoid that, do not aim to draw perfect trend lines.
If you try to draw perfect trend lines that work every time, you will become an expert in trading historical price charts. Your trend lines will seem flawless in historical charts but will do nothing to help you trade in real-time.
Because each time you try to draw a trend line in real-time, you will be filled with self-doubt over its efficacy. (And this will destroy you.)
Instead, draw consistent trend lines. Develop a method to draw trend lines. Always draw your trend lines according to the same rules. Then, you can draw trend lines confidently in real-time.
You should spend your effort analyzing price action with the help of trend lines and not worrying about how to draw them.
Your trend lines might not be perfect, but at least you can apply this powerful tool consistently. And that is what matters.
At some point, you will realize that consistency is the key to trading success.
If you are keen to extract more value from trend lines, check out trend line channels. They offer a way to gauge a trend’s progression and are extremely useful for profit-taking.
The article was first published on 28 October 2014 and updated on 9 December 2021.