What Is The Best Price Action Trading Time Frame?
By Galen Woods ‐ 7 min read
Want to find out the best time frame for price action? This guide brings you through a self-review to find the best trading time frame that works for you.
Every day, I get questions from people looking to trade better. A common question is what is the best time frame for price action trading.
Some of them are looking for a magical time frame that will bring them profits. Others are looking for a starting point to tinker with.
And it’s no wonder. A time frame is the first input you need when you open up a price chart. With infinite time frame choices, it can be difficult to choose.

First, understand that there is no magical time frame. There is no time frame that will work for you forever.
If you are looking for a magic number for your trading time frame, you can stop here.
But if you want to know how to:
- Arrive at the trading time frame that works for you now
- Know when you need to change your trading time frame
Then you are at the right place.
To find the best price action trading time frame, start by answering the questions below. (Be prepared to do some work.)
#1: How much can you risk? How much do you want to risk?
A price action trader typically enters the market based on a price pattern. And a stop-loss is placed on the opposite side of the pattern or setup bar.
Some price action traders enter with limit orders at areas of support and resistance. These traders tend to place their stop-loss orders at swing pivots. They might also use a volatility tool like the Chandelier Stop.
The key is that in both cases, generally, the larger the average bar range, the higher the trade risk.
The table below shows a random sampling of the 233-period average true range for different time frames in EURUSD.
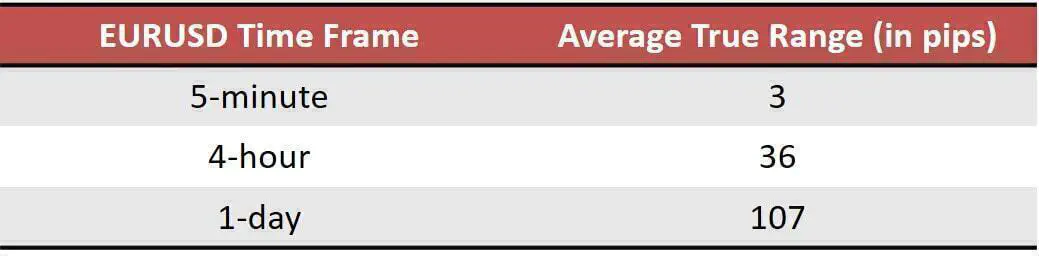
The conclusion is that higher time frames require the price action trader to risk more per trade. To trade the slower time frames, you need to be well-capitalized.
This is exactly why new and less capitalized traders gravitate towards fast time frames. This is acceptable if you can overcome the problems of fast time frames, which we will discuss later.
Another common workaround is to trade higher time frames with tight stop-losses. Unfortunately, this is not viable. Such stop-losses are illogical, and your trading setups will not make sense. (Unless you are using a faster time frame to refine your entry.)
Do This
- Figure out how much you can risk for each trade.
- Observe the market to learn how much you need to risk for different time frames, given your trading strategy.
- Stay with the time frame that requires an amount of trade risk that you can accept. If not, save up and increase your trading capital so that you can trade the slower time frames.
#2: How much time can you spend on trading?
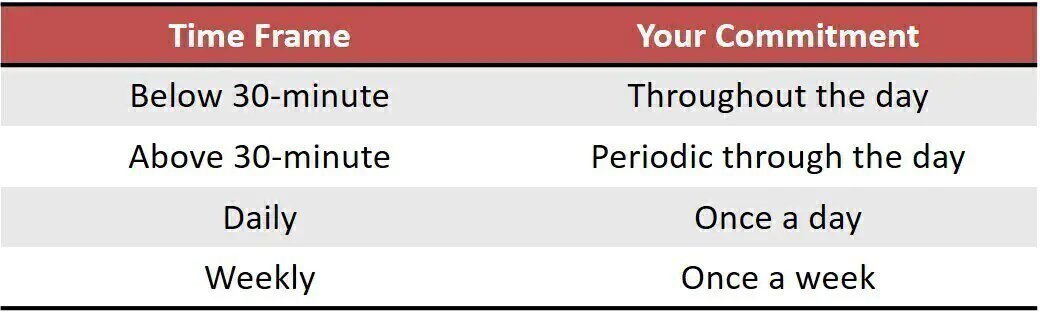
The trading opportunities on time frames below 30-minute are fleeting. To trade effectively, you need to keep your eyes on the price action constantly.
For intraday time frames above 30-minute, you need be able to check on the price action periodically throughout the day.
If you can only spare a block of time each day, you should definitely consider trading off daily charts.
If you can only spare your weekends for analyzing the markets, then the weekly time frame is ideal.
In a nutshell, the time frame you can trade depends on how much time you can spend on trading.
Do This
- Review your current work and life routine.
- Assess how much time you can spend on trading.
- Use the guidelines above to help you to shortlist your time frame options.
#3: How fast can you analyze price action?
Even if you can afford the time to stare at the market all day, it does not mean that you should.
You might be able to look at the daily charts of the past six months and arrive at superb analysis. It might take you half an hour, but that’s alright, because you have time.
But if the price bars are forming at a rate of one per minute, can you still analyze price action effectively?
The faster the time frame, the less time you have to perform price action analysis. You need to be able to interpret price action confidently to do well with fast time frames.
Consider both your price action reading skill and your trading personality.
You might have the skill to analyze the market fast. But if you are not comfortable with split-second decisions, a fast trading time frame is not a good idea.
The reverse applies. You might enjoy the rapid action of fast time frames. But you cannot trade it unless you can analyse price action fast enough.

Want to find out if a trading time frame is compatible with your trading ability and personality?
Do This
You need to actually trade under each time frame and observe yourself.
- If you are making mistakes with your analysis, then the time frame is too fast for you.
- If you are missing trade setups due to indecision, move to a slower time frame.
- If you are dozing off because the price action is too slow, drink some coffee. Or, if you are confident of your price action reading skill, drill down to a faster time frame.
Try out different time frames and keep observing your performance. This is the key to fine-tuning your trading time frame.
#4: What is the volatility and liquidity of your trading market?
The volatility of your trading market plays an important role.
A volatile market offers good profit potential for fast time frames.
However, a dull market might not move enough to offer reasonable profit in fast time frames. In that case, you need to increase your time frame.
As a general gauge of the profit potential, look at the ATR and the average length of price swings of the time frame.

The liquidity of your trading market matters too.
For instance, you want to trade stock options. But most stock options are not liquid enough for intraday trading. Hence, trading the daily time frame is a better idea.
Do This
If you want to trade fast intraday time frames, make sure that the market is volatile and liquid. If not, stick to trading daily charts.
#5: How do your setups look like?
Some traders claim that setups on the slower time frames are more reliable. And that there’s more noise in the fast time frames.
That’s not always true.
What is more important is that your trading strategy is compatible with your time frame.
Some methods work better on daily charts, while others do well in fast sub-minute time frames.
The acceptable time frames also depend on the type of setups and price patterns you trade. Clearly, the price patterns on a 30-second chart look different from those on a daily chart.
Do This
Ultimately, you need to evaluate your time frame in light of your trading strategy. Make sure that they are compatible.
Since you are the expert on how you trade, you are in the best position to judge compatibility.
In my trading course, I’ve explained a few concepts I use to select and monitor my trading time frame.
- Price Action Trading Index - a measure of price bar normality
- Minimum Trading Time Frame - the smallest time frame amenable to price action analysis
- Optimal Trading Environment Index - a measure comparing volatility to trade risk
I won’t explain these concepts in detail as I’ve designed them for my trading framework. If you are not using the framework, they are of no use to you. You should be formulating your own system to decide on your trading time frame.
Finding a Price Action Trading Time Frame that Works for You
It’s clear that the optimal trading time frame depends on the individual trader.
Stop asking what is the best time frame for price action trading. Start learning how to find the best trading time frame.
By understanding the “how”, you will know when you need to change your time frame.
But once you have a workable time frame, it’s unlikely that you need regular and drastic changes. You need to maintain a fixed time frame to develop other aspects of your trading process.
Do not keep switching your trading time frame. It messes with your trading perspective.
Now, perform a thorough self-review with the questions above. Then, study the market that you want to trade. Finally, put them together and you will find the trading time frame that works best for you.