On-Balance Volume Trading Strategy For Fading Dumb Money
By Galen Woods ‐ 5 min read
The On-Balance Volume Trading Strategy uses a classic indicator by Joseph Granville. He was a technical analyst who could move markets with his words.
What’s the most important market data after price?
One of the key tenets of Dow Theory is that volume confirms the trend. Volume increases when the market moves along with the true market trend. Volume decreases when the market is moving against the trend.
Joseph Granville recognized how important volume is for confirming trends and created the on-balance volume (OBV) indicator. Joseph Granville’s track record was controversial but his influence of the stock market was extraordinary for a technical analyst. There was a time when Joseph Granville could send the market plummeting by issuing a bearish outlook. Read this Bloomberg article on him.
What is the On-Balance Volume?
The on-balance volume indicator is a cumulative sum of volume.
- If the bar closes up, add the volume of that bar to the indicator.
- If the bar closes down, minus the volume of that bar.
The absolute value of on-balance volume is irrelevant as it depends on when you started calculating it. Its direction is the key to effective analysis.
Most of the time, the on-balance volume matches price movement. When they diverge, look out for opportunities to fade ‘dumb money’ that does not have the support of volume.
(Read: 4 Trading Strategies that Profit from Trapped Traders)
On-Balance Volume Trading Rules
In our on-balance volume (OBV) trading strategy, we use the OBV indicator to fade the weak hands on trend pullbacks with the help of a weighted moving average (WMA).
Long Strategy
- 233-period WMA of price is sloping up
- 233-period WMA of the OBV is sloping up
- Slope of price WMA turns negative but slope of OBV WMA stays positive (divergence)
- Go long when price WMA turns positive again
Short Strategy
- 233-period WMA of price is sloping down
- 233-period WMA of the OBV is sloping down
- Slope of price WMA turns positive but slope of OBV WMA stays negative (divergence)
- Go short when price WMA turns negative again
How to Create the Weighted Moving Average of the OBV
To create the WMA of the OBV, you will need a charting platform that enables you to nest indicators. Nesting indicators refers to using the output of one indicator as the input of another indicator.
Here, it means that we take the output of the OBV indicator and use it as the input of the WMA. In other words, we are nesting the OBV indicator in the WMA.
TradingView calls this ability indicator on indicator and offers an easy way to do so. However, it is limited to just one nested indicator, unless you upgrade to the Pro+ plan. Click here to learn how to nest indicators on TradingView.
On-Balance Volume Trading Examples
In this section, you’ll find two chart examples applying the trading rules above.
Winning Trade - Long Trade
This is a daily chart of CVS Caremark Corporation (CVS on NYSE).
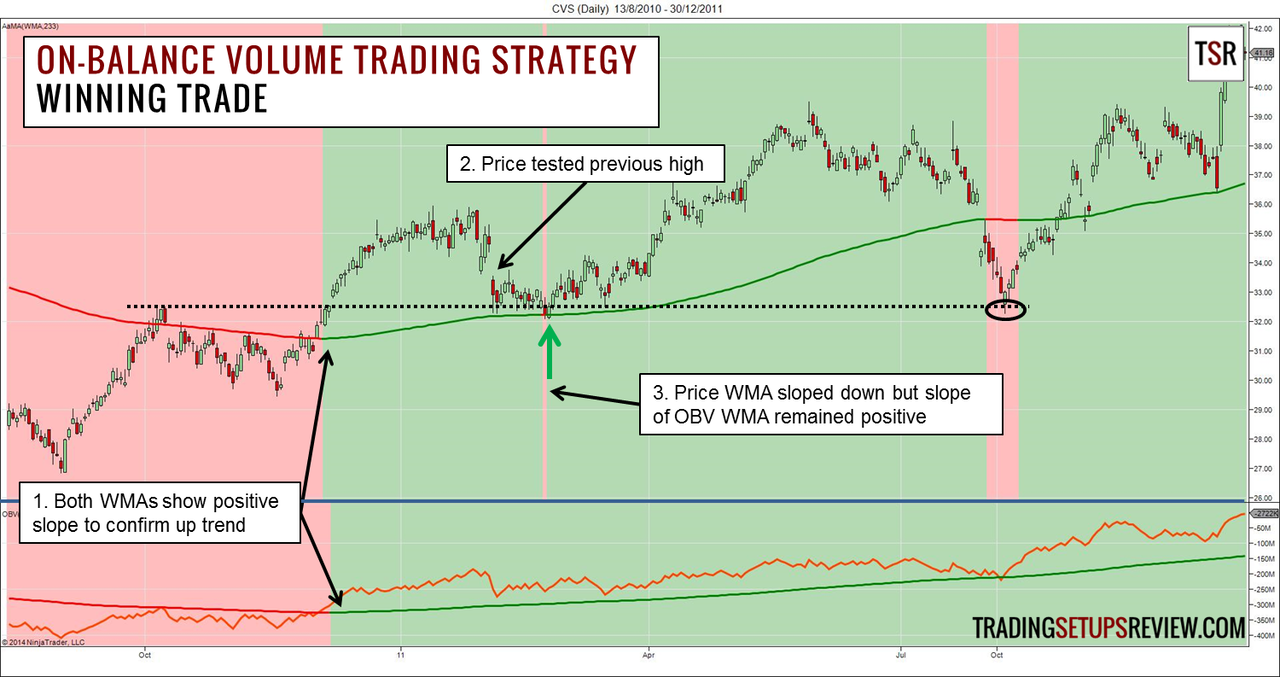
The lower panel below the blue line shows the OBV indicator. Both panels have a 233-period WMA. The background color of the panels shows if the WMA slope is positive or negative.
- Both WMAs had positive slope. Volume confirmed trend.
- Price fell to test a previous swing high and went sideways.
- The slope of the price WMA turned negative (note red background), but the slope of OBV WMA stayed positive. It showed that the price pullback did not have the support of volume. The ‘dumb money’ was pushing their luck. Once the price WMA slope reverted to positive, we bought into a strong bullish move.
Look at the black circle on the chart. The test of the same support level showed another pullback that did not have volume support. That is another potential win from our on-balance volume trading strategy.
Losing Trade - Short Trade
This daily chart of Walgreen Company (WAG on NYSE) shows a flat market.
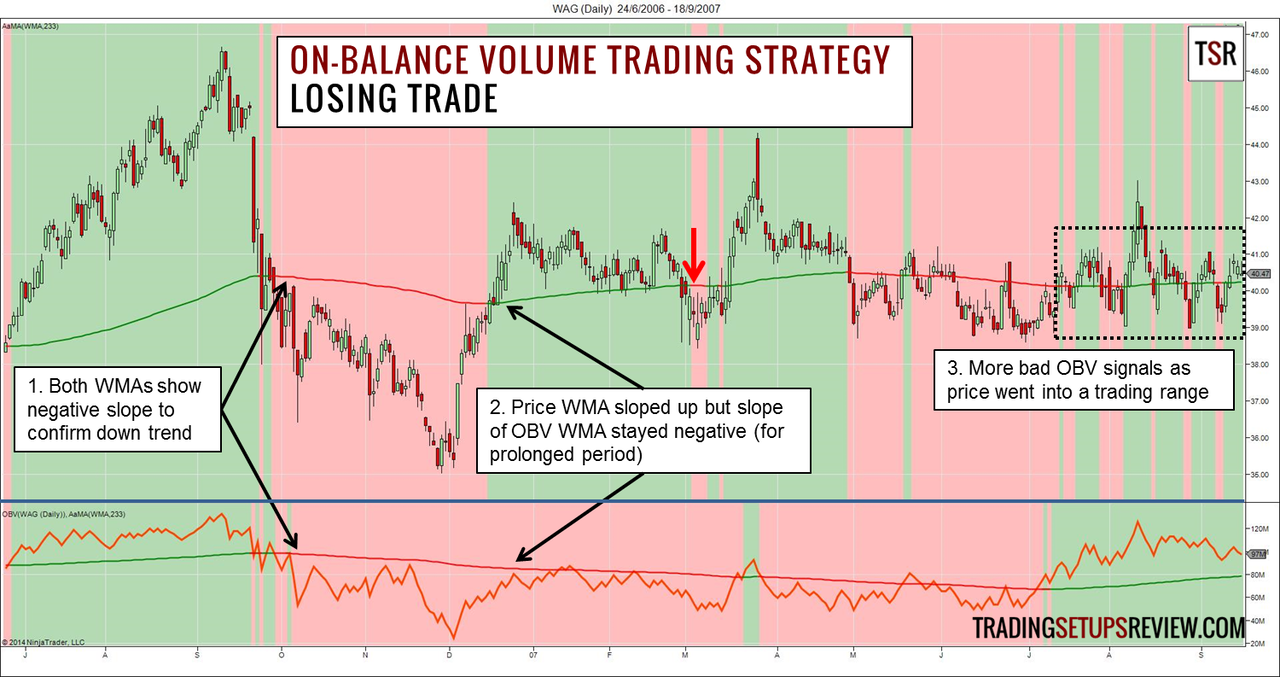
- Both WMAs turned down to confirm the downwards trend.
- Price rose up sharply and turned the WMA slope positive. The slope of the OBV WMA stayed negative and implied that ‘smart money’ did not take part in that upwards swing. Following the trading rules, we shorted at the red arrow as the WMA turned down. However, price moved against us with another strong bullish move.
- WAG caught prices within a trading range, and many more bad OBV signals emerged. The WMA was almost flat in this chart.
The retracement mentioned in Point 2 lasted unusually long and was a warning sign that the downwards trend was not longer intact.
Importantly, this example highlights the danger of using this on-volume balance trading strategy mechanically.
Review - On-Balance Volume Trading Strategy
In formulating this on-balance volume trading strategy, I used weighted moving averages to help us pinpoint divergences before zooming in for detailed analysis. The rules are effective for picking up potential weak movements to fade.
However, our trade trigger certainly has room for improvement. Our current trade trigger of entering when both WMAs move in the same direction again requires larger stops. Our usual stop placement at the other end of the signal bar is not effective. Place stop at the last swing high/low to avoid whipsaws. Consider using reversal patterns for trade triggers.
The look-back period of 233 is my arbitrary parameter for long-term analysis. It works well on daily time-frames. However, for intraday time-frames, you might want to experiment with shorter periods.
As shown in the first example, in trending markets, this on-balance volume trading strategy coupled with support/resistance levels offers a reliable trading approach. Furthermore, the on-balance volume indicator provides another dimension of the market to help us confirm trends.
To avoid bad trades, do not take signals in ranging markets. If the WMA slopes are fluctuating up and down, the market is probably in a trading range. Also, if the WMA slope divergence (Trading Rule 3) lasts too long, do not take the ensuing signal.
Learn more about this classic volume indicator with Joseph Granville’s New Key to Stock Market Profits.