The Ultimate Guide to Volatility Stop-Losses
By Galen Woods ‐ 14 min read
Professional traders favour volatility stop-losses. Learn everything you need to use it properly, including 8 types of volatility stop-loss methods.
Placing a stop-loss requires delicate balance. We want a stop-loss to be as tight as possible, while giving the trade enough room to whipsaw.
The key to this balancing act is volatility.
According to Wikipedia, volatility is:
the degree of variation of a trading price series over time…
You need the stop-loss to be tight to control your risk. But it must be wide enough to let the market wiggle, so that you are not stopped out prematurely.
Hence, the study of volatility offers a logical method of placing a stop-loss. Moreover, it is backed by statistics. This is also why volatility stop-losses are common among professional traders.
Here, you will learn everything you need to use this powerful stop-loss technique.
The Typical Construct of a Volatility Stop-Loss
There are three ingredients for a volatility stop-loss:
- Volatility measure
- Safety multiple
- Price anchor
First, you choose a way to measure volatility. (e.g. standard deviation is 7)
Then, you decide on a safety multiple. Its purpose is to add a buffer for market noise. It is also a reflection of how aggressive you want to be in placing your stop-loss. (e.g. multiple of 3)
Take the product of the volatility measure and the safety multiple. The result is the stop-loss distance in terms price. (e.g. 7 x 3 = 21)
The next step is to choose a price anchor. (e.g. last closing price is 215)
Finally, from the anchor price, project the stop-loss distance. That will help you find out where to place the stop-loss.
The direction to project depends on your direction of your position. (e.g. for a long position, the stop-loss will be placed at 215 - 21 = 194)
First Ingredient: Volatility Measure
There are two common measures of volatility among traders.
- Standard Deviation
- Average True Range
#1: Standard Deviation
Standard deviation is the default volatility measure in the finance industry.
According to StockCharts.com, Standard Deviation is:
A statistical term that measures the amount of variability or dispersion around an average.
Imagine a price series in which every single price data equals to its average. (i.e. zero dispersion around the average)
How would such a price series look like? Constant. Flat. Completely devoid of volatility.
Hence, the dispersion around the average of a series (above or below) measures volatility.
Most charting platforms can calculate standard deviation for you. But it’s always good to know what goes into the computation. Work through this Excel guide by Adam Grimes to compute the standard deviation.
Examples of stop-loss methods that use standard deviation:
- Bollinger Bands
- DevStop
#2: Average True Range (ATR)
Welles Wilder introduced the ATR in his book, New Concepts in Technical Trading Systems.

According to Investopedia
, true range is the greatest of the following:
- Current high less the current low
- Absolute value of the current high less the previous close
- Absolute value of the current low less the previous close
The ATR is a moving average of the true ranges. The typical look-back period is 14.
Wilder came up with the idea of a true range to account for gaps between price bars. If you were to take the average range, you would have missed the volatility due to price gaps between bars.
True range accounts for gaps with points 2 and 3 above.
In a market that does not gap, ATR is simply the average range. This is because the price bar range (point 1) will always be the greatest.
Examples of stop-loss methods that use ATR:
- Chandelier Stop
- Keltner Bands
Second Ingredient: Safety Multiple
The safety multiple is a key feature of a volatility stop-loss.
The volatility measure is an objective calculation of the market’s price tendencies. On the other hand, the safety multiple is the subjective input from the trader.
A low multiple means a tight stop-loss that places risk control above profit potential. A high multiple produces a stop-loss that risks more but offers the market more room to breathe.
This means that the multiple reflects the trader’s expectations of price action.

2 and 3 are common safety multiples used in volatility stop-losses. You can use them as a starting point to experiment.
The best approach is to derive a default multiple based on back-testing your markets. Then, refine them based on the circumstances of each trading setup.
For instance, for a long term trend-following trade, a higher multiple is wise. For a breakout trade that you expect to hit the target swiftly, a low multiple is suitable.
Third Ingredient: Price Anchor
Once you get a stop-loss distance, you need to project it from a reference price (anchor).
Common price anchors are the high, low, and close of the price bar. Some traders also use a price moving average as the anchor.
For a long position, using the bar high as a price anchor produces a tighter stop-loss. For a short position, using the bar low has the same effect.
Using the closing price is a good compromise. A stop-loss that updates with the completion of each price bar uses the closing price as the anchor.
Traders who want a smoother series of price anchors will prefer using a moving average.
Types of Volatility Stop-Losses
In this section, we take a look at 8 different volatility stop-loss methods.
The point of this section is not to offer an exhaustive reference.
It aims to show how you can combine the three ingredients above to produce various volatility stop-loss strategies.
#1: Chandelier Exits

This powerful image was used by Chuck Lebeau to describe his volatility stop approach. (Alexander Elder discussed the Chandelier Exits in his book - Come Into My Trading Room.)
It uses a multiple of the ATR and “hangs” it down from the highest high of a look-back period. Typically, it uses a 22 look-back period with 3 x ATR. (Exact formula here.)
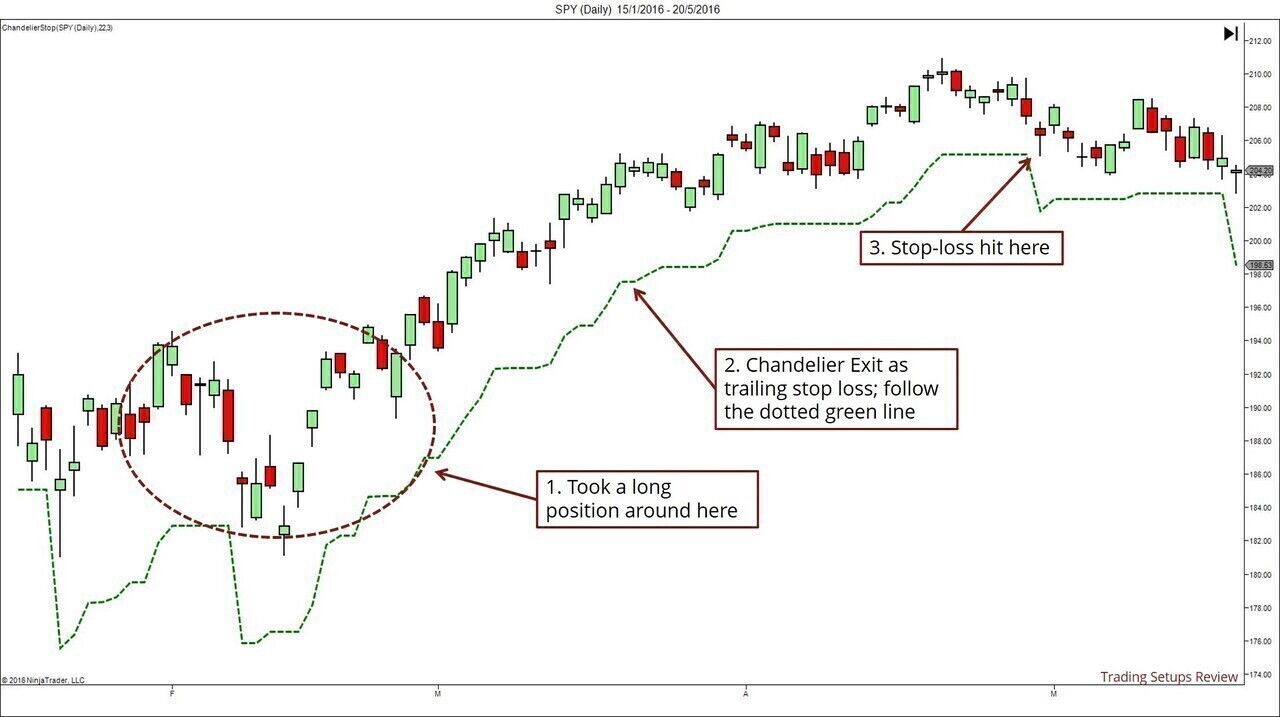
Making sure that you understand how Chandelier Exits work is worthwhile. A few of the stop-loss methods that follow are improved versions of the Chandelier Exit.
#2: Bollinger Bands
Bollinger Bands are rarely touted as a stop-loss tool. But its usage of standard deviation makes it a natural candidate.
For instance, the lower Band works well as a stop-loss for a long position. I’ve kept the Chandelier Exit on the example below for comparison.
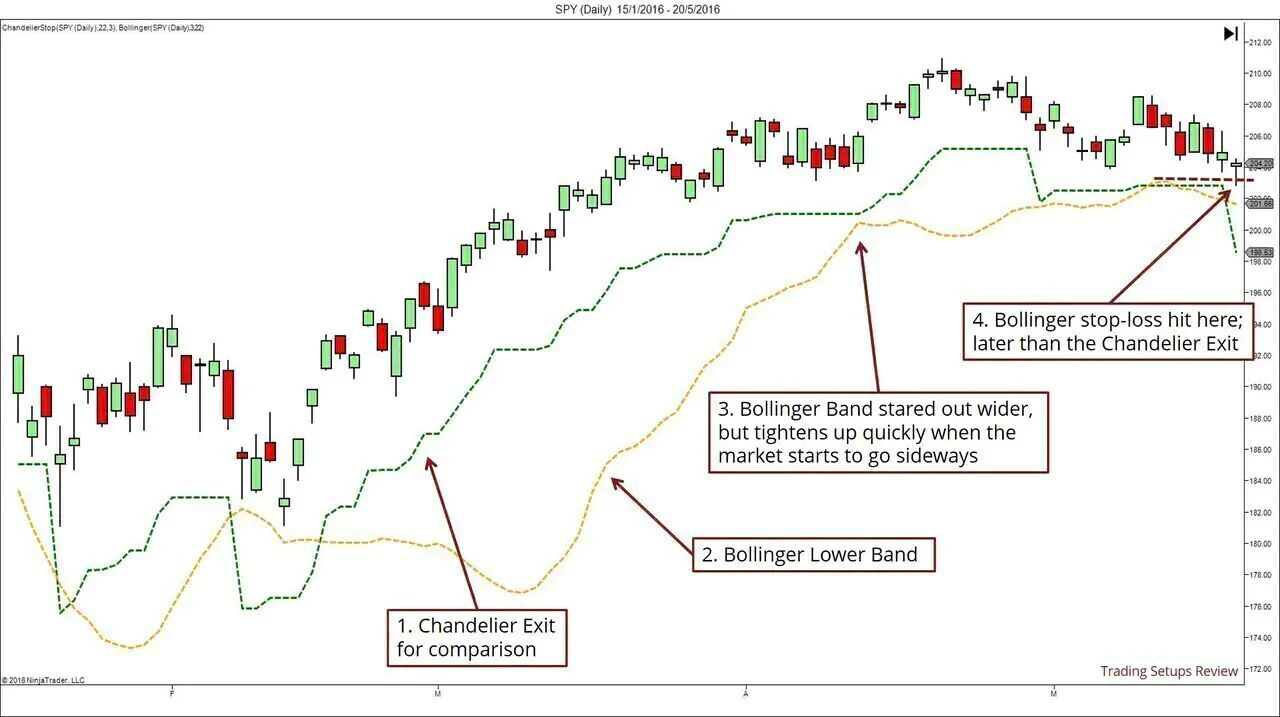
As the Bollinger Band is not designed as a stop-loss tool, it widens when volatility is high. Hence, when you use it as a stop-loss tool, remember to ignore the parts where the Band moves away from price. Adjust the stop-loss only in the direction of the trade.
Common multiples used for standard deviation are two and three. Why?
Around 95% of the fluctuation stays within two standard deviations around the average. Around 99.7% of the variation stays within three standard deviations above and below the average.
While this is only true of normal distributions, it’s a good starting point.
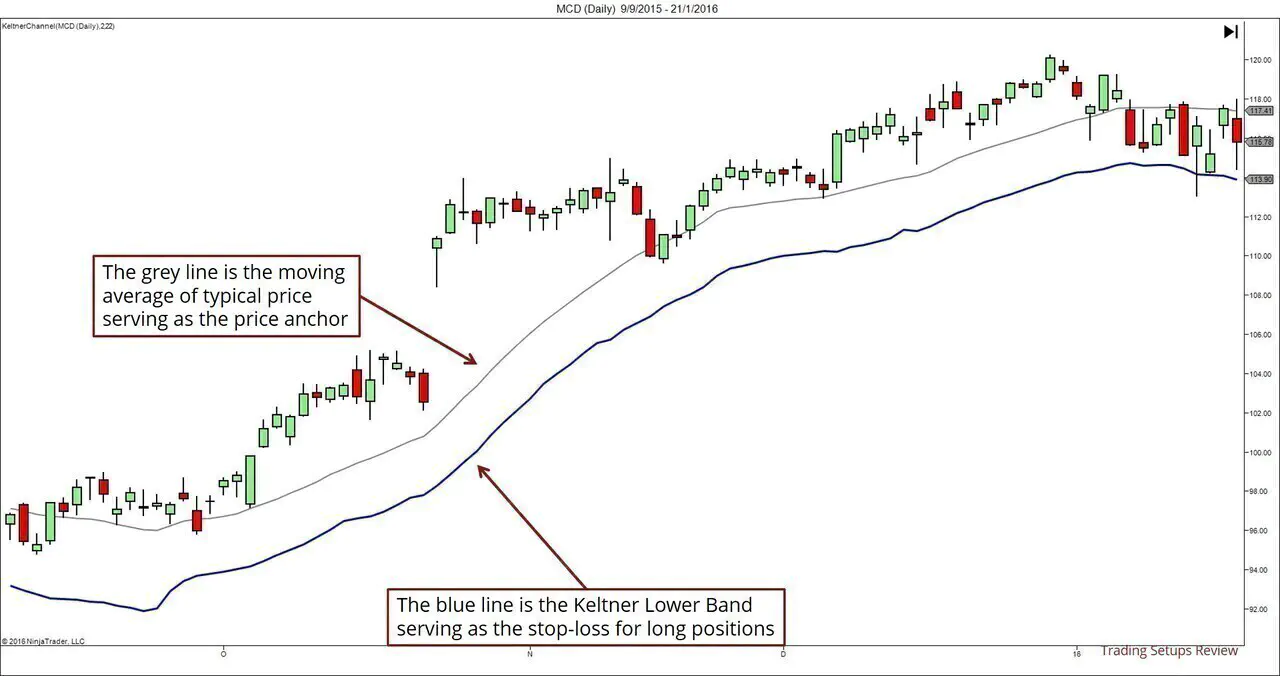
#3: Keltner Bands
Like Bollinger Bands. But in this case, ATR is used instead of standard deviation.
Also similar to the Chandelier Exit. But in this case, the price anchor is a moving average instead of a price high/low.
#4: Kase’s DevStop
Cynthia Kase’s DevStop seeks to enhance the Chandelier Stop.
The main idea is that ATR is not the only important factor to consider when it comes to setting stop-losses. The variation of ATR is critical as well.
To understand the DevStop, let’s break it down into the three parts of a volatility stop-loss:
- Volatility measure
- Multiple
- Price anchor
DevStop replaces the ATR with the True Range of 2 Bars (TRD) and uses it as the basic building block.
For the volatility measure, it uses the standard deviation of TRD instead of simply using the TRD.
The safety multiple ranges from 1 to 3.6. The seemingly odd number with decimal is in fact an attempt to account for the skew in the distribution of TRD. (TRD does not follow a normal distribution.)
The price anchor is a moving average of the TRD.
To see the DevStop in action, take a look at this article by Cynthia Kase.

Learn more about DevStop in Cynthia Kase’s book - Trading With The Odds.
#5 Kaufman’s Volatility Stop
Perry Kaufman discussed this stop-loss method in his book A Short Course in Technical Trading.

Again, you can think of it as a result of tweaking the Chandelier Exit.
Instead of using ATR, he uses an average of the simple range as the volatility measure. (i.e. high - low)
As for the price anchor, the most recent price low is used for a long position. The most recent price high is used for a short position.
Bulkowski has discussed this method on this website here. There’s also a nifty calculator here for this stop-loss strategy.
#6: Elder’s SafeZone Stops
Alexander Elder described the SafeZone Stops in his book - Come Into My Trading Room.
In Chandelier Exits, ATR is a direction-neutral volatility measure. It ignores the fact that with-trend and counter-trend price action have different volatility.
To account for this, Elder uses DM instead of ATR as the volatility measure. DM is a directional movement system designed by Wilder.
DM is an intuitive concept. Positive DM is the difference between current bar high and last bar high. Essentially, it is the price territory that the bulls have managed to conquer in one price bar. The same logic applies for negative DM.
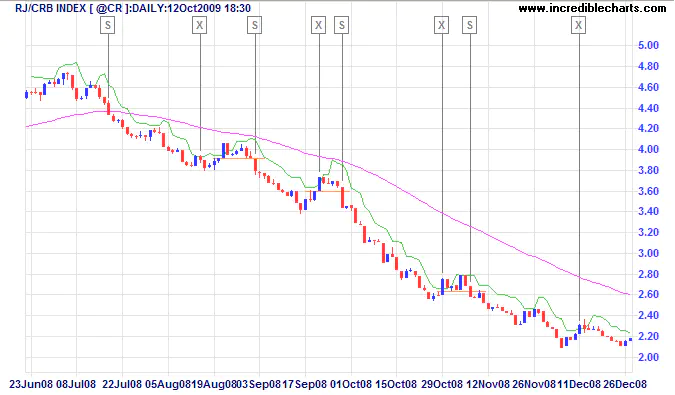
Elder’s improvement on the classic volatility stop-loss makes sense. But as the formula is more complicated, it might not be among the default indicators on your platform.
If you want to give SafeZone stops a try, check out Incredible Charts, Motive Wave, or MT4.
#7: Bulkowski’s Beta-Adjusted Trailing Stop-Loss
This trailing stop-loss method was first featured in a 1997 article.
The volatility measure used here is beta. While beta is common in portfolio management, you don’t see it much in technical trading.
β
According to Investopedia, beta is:
A measure of a stock’s volatility in relation to the market.
The beta of the entire market is always 1. Stocks that are more volatile than the market has beta greater than 1. Stocks that are less volatile than the market has a beta smaller than 1.
Note that beta is a relative measure of volatility. This is different from the other measures mentioned earlier.
Due to this difference, this volatility stop-loss strategy differs from the typical template.
It does not use a safety multiple to determine the stop-loss distance. Instead, it prescribes one based on combinations of a stock’s beta and price. The prescribed distance is based on Bulkowski’s intensive back-testing.
The table of prescribed stop distance is a useful reference. But it’s difficult to derive your own values without having solid back-testing skills.
#8: Wilder’s Parabolic SAR
Parabolic SAR is an impressive indicator that incorporates both price and time to place stop-losses.
Thus, it’s not surprising that the formula of Parabolic SAR is one of the hardest to grasp. If you want to get a complete understanding, you can refer to Wilder’s book or this web page.
The defining parameter of Parabolic Sar is the Acceleration Factor (AF). The default value is 0.02. Each time the trend advances, the AF increases by 0.02. This explains its distinctive parabolic shape.
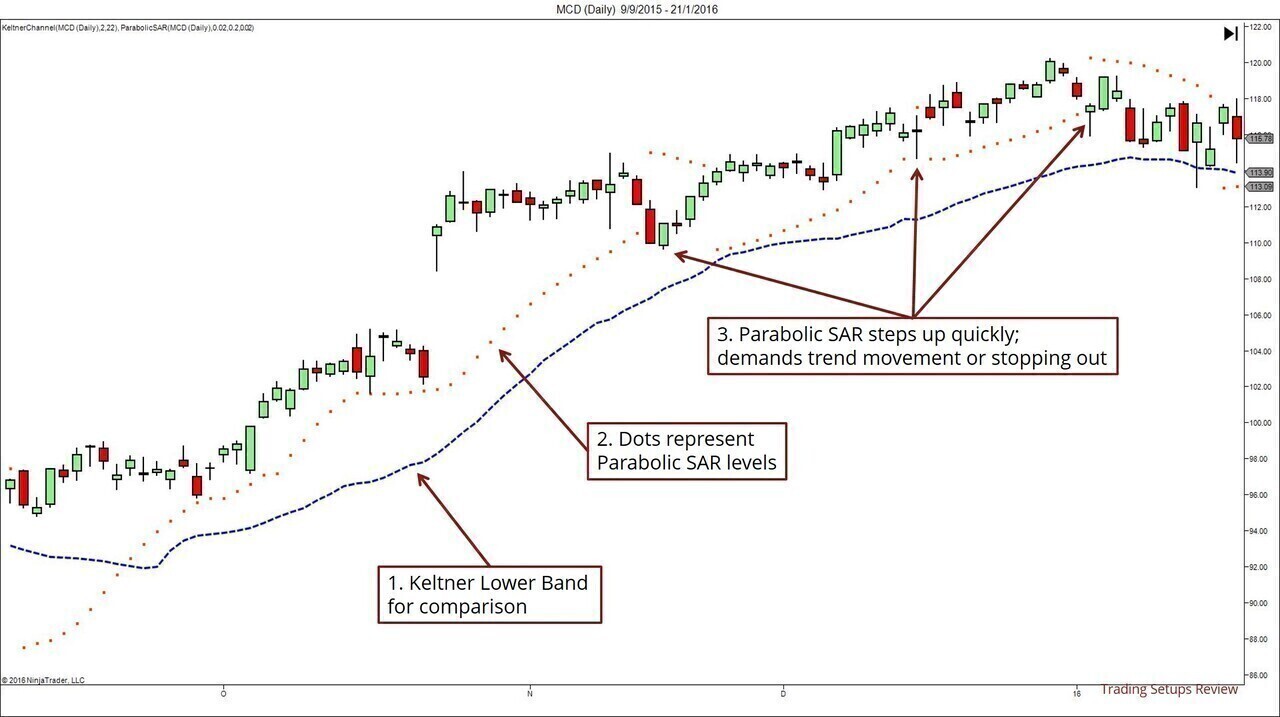
“SAR” stands for Stop-And-Reverse. It refers to a trading approach that seeks to be in the market at all times. Once a long position is stopped out, reverse into a short position. And vice versa.
This approach is not always suitable. But it does suggest a creative use of volatility stop-losses - for trade entries.
In the right context, the trigger of a stop-loss might be a signal to enter a trade in the opposite direction.
Pros and Cons of Volatility Stop-Losses
Pros
Stop-losses are often based on price patterns, and support and resistance. It might also be based on a reversal signal, be it from price action, volume or an indicator.
However, you might not always find appropriate price action formations for stop-loss placement.
This is where volatility stop-losses shine. Regardless of the price action, you can always place a stop-loss based on volatility. It’s always a viable stop-loss method.
Due to this reason, it is also effective as a trailing stop-loss. A trailing stop-loss should trail, regardless of the price patterns that form.
Furthermore, volatility stop-loss is based on an objective method and is easily programmable. This makes it especially useful for algorithmic traders.
Cons
The key disadvantage of volatility stop-loss is that it requires input parameters. And these parameters have a great impact on their effectiveness.
There’s a huge difference between a safety multiple of 1 and 4.
Most traders start with the default setting. Many will go on to optimise them based on their testing results. However, it does not guarantee that they will work in the future.
a̶s̶s̶u̶m̶p̶t̶i̶o̶n̶
Another disadvantage of volatility stop-loss stems from its main assumption. The volatility measure used is based on historical volatility. Hence, we are assuming that future volatility is similar to historical volatility.
This assumption does not always hold true.
One example is when there’s news release with huge market impact. When there’s important news, volatility rises and stop-losses based on historical volatility become ineffective. A recent instance is the Brexit result.
The Sensible Way To Use Volatility Stop-Losses
#1: Remember Price Action
Volatility stop-losses bring out the statistician in traders. It’s certainly helpful to try out different volatility measures, multiples, and price anchors. But never forget price action.
Let’s say you are in a long position. Your volatility stop-loss is just above a major support level which the market is likely to test.
In this case, do not follow your volatility stop-loss strategy blindly.
Adjust your stop-loss to a safe distance below the support level. You can do so by using the support level as the price anchor for your volatility stop. Or you can increase the safety multiple.
#2: Incorporate Other Stop-Loss Methods
Two other common stop-loss methods are patterns stops and time stops.
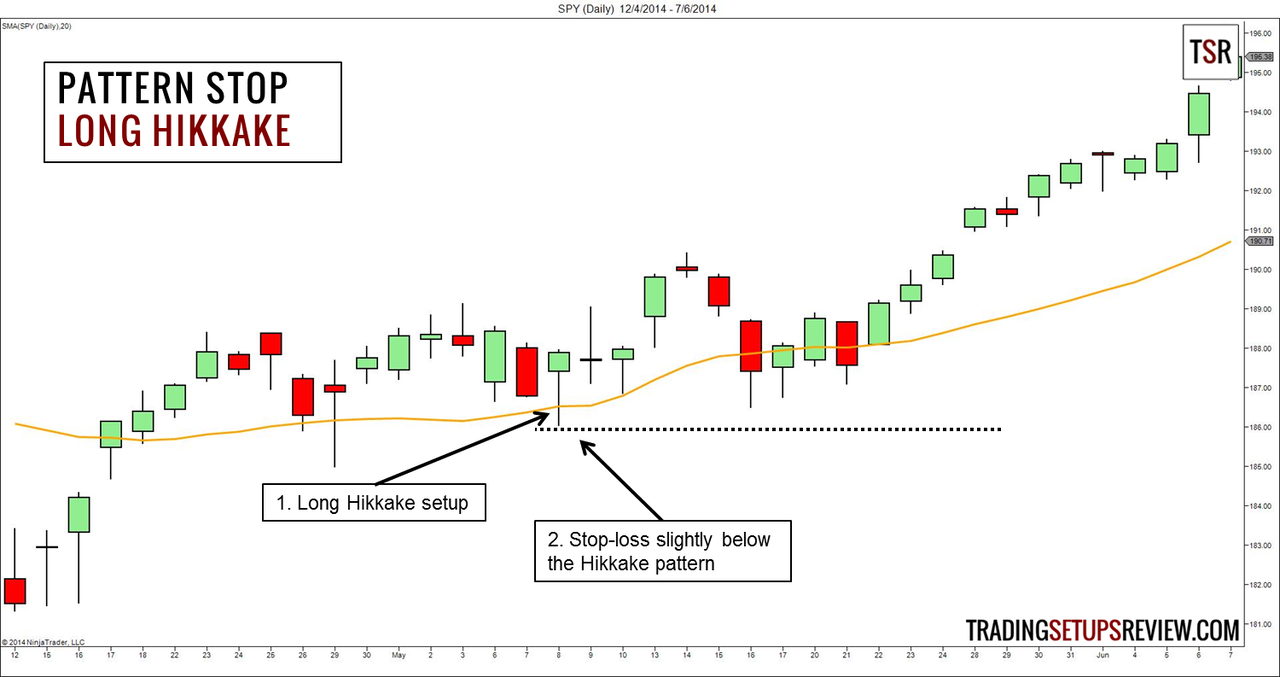
If you entered the market based a chart pattern (e.g. Head & Shoulders), you should definitely make use of it in your stop-loss placement. This approach is a pattern stop and is extremely relevant for price action traders.
The same goes for a bar pattern like the Hikkake shown below. To incorporate volatility, you can set the pattern stop one ATR wider to accommodate for whipsaws.
Time stops are critical too, especially for options traders. Even if you don’t trade options, using a time stop can improve the efficiency of your trading capital.
(The Parabolic SAR accelerates over time and is a stop-loss method that integrates time.)
#3: Employ Discretion For Targets
It might be tempting to use trailing stop-losses guided by volatility. But for some trades, you might be better off taking your profits before your trailing stop-loss is hit.
Your targeting decision boils down to the type of trade you are taking. Trailing stop-loss might be ideal for capturing the long term trend. But a well-placed target order is superior for a quick intraday scalp.
#4: Pay Attention To The Stop-Loss Trigger
This is a small detail that might have a big impact on your expected results. What price are you using to trigger your stop-loss?
Most traders use the continuous current price. This means that at any point, once your stop-loss is hit by the market, your stop order will be executed.
However, there is an alternative tactic that’s common among swing traders. They use the closing price of the day to trigger their stop-loss. This means that intraday hits of the stop-loss level do not trigger the stop order. Only the closing price matters.
The advantage of this approach is that wild intraday spikes are avoided.

The disadvantage is that you lose control over your potential loss. This is because the market might close far beyond your stop-loss and cause huge unexpected losses.
In any case, you must understand the implications of the exact stop-loss trigger.
#5: Prioritise Risk Control
A volatility stop-loss is just one part of the risk control puzzle.
Don’t forget to adhere strictly to your position sizing model. If not, you might risk too much without realising.
Take a look at The Logical Guide To Setting A Stop-Loss.
Conclusion
Never forget this: stop-losses are meant to be hit (when the market does not go your way).
When a well-placed stop-loss is hit, rejoice. Because the stop-loss has performed its duty. It has limited your risk.
The caveat here is that the stop-loss must be well-placed. It should not be random. When a random stop-loss is hit, well, it’s just random.
Volatility is a remarkable tool to help you place great stop-losses. With it, you can achieve that delicate balance between profitability and risk control.
(There aren’t many resources devoted to stop-losses. Being associated with losses, it’s not an attractive topic to most traders. If you want to get serious about placing stop-losses, this book is a good place to start.)