Price Action Trading Primer
By Galen Woods ‐ 9 min read
Learn about price action trading in our comprehensive primer. What is price action trading? How can it help you to trade better?
New to price action trading? This primer will introduce you to this fascinating analytical approach. Besides gaining a crystal clear overview, you’ll also find links to many resources to bring you to the next level.
Primer Overview
This list shows the topics we will cover in this primer.
- Definition of Price Action Trading
- Origin of Price Action Trading
- Markets for Price Action Trading
- Essential Trading Concepts
- Trading Methods
- Beyond The Primer
#1: Definition of Price Action Trading
What is price action trading?
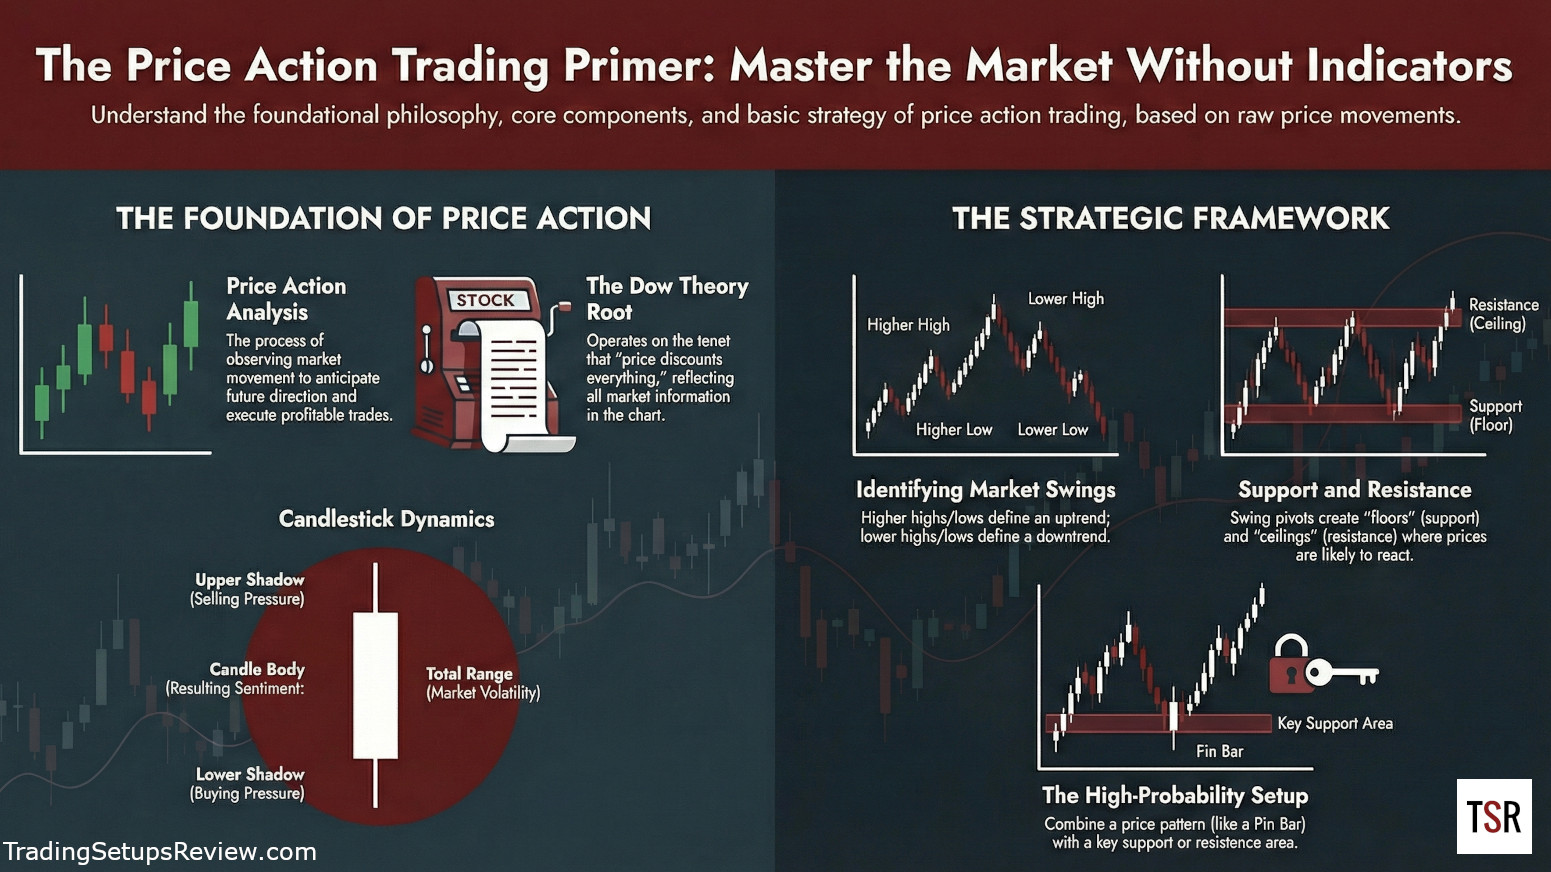
It is the process of observing market price movement to anticipate future movement. And importantly, its purpose is to enable us to transact in the market to make a profit.
This method uses past and current price action to predict market movement. Hence, it forms a branch of technical analysis. Traditional forms of technical analysis focus on chart patterns like Double Top/Bottom, Head & Shoulders, and Flags.
However, price action trading is increasingly used as an umbrella term that covers the following:
- Chart patterns
- Bar patterns
- Candlestick patterns
In its current context, there is great emphasis on short-term bar patterns and candlestick patterns. Some examples include the Pin Bar, Inside Bar, Engulfing candlestick, Harami candlestick.
Price Action vs. Indicators
Trading with price action is often distinguished from indicator trading, which uses mathematical formulas to produce trading signals.
Pure price action trading excludes the use of any trading indicator. However, price action analysis and trading indicators are not mutually exclusive. On the contrary, you’ll find that many indicators complement price trading strategies.
#2: Origin Of Price Action Trading
This section will trace the development of price action trading, starting with the Dow Theory.
What is crucial to note here is that price action trading had existed long before this term became popular. Over the years, traders emphasized different aspects before arriving at our current discussion of it as a somewhat distinct topic.
In a nutshell, price action analysis has been evolving and will continue to do so.
The Roots - Dow Theory
Price action trading shares the same roots as technical analysis, which comes from the Dow Theory.

This theory explains market behavior and focuses on market trends. One of the Dow Theory tenets is that the market price discounts everything. Price is the cumulative result of all market information.
Hence, technical analysts use price charts and chart patterns in their market study.
Learn more about technical analysis of trends and chart patterns with the following books:
By Robert D. Edwards, John Magee, and W.H.C. Bassetti:

By Thomas Bulkowski:

We have also gathered seven high-quality websites for learning technical analysis.
Bar/Candlestick Patterns
As traders intensify their study of price action, short-term bar patterns like the Inside Bar, NR7, and Key Reversals emerged.
Following Steve Nison’s introduction of Japanese candlestick patterns to the Western audience, short-term price patterns experienced a renaissance. Since then, candlesticks have become one of the most popular chart types for price action analysis.
The picture below shows a candlestick which typically represents prices within a given period. For instance, if the given period is a day, it captures the day’s high, low, open, and close prices.
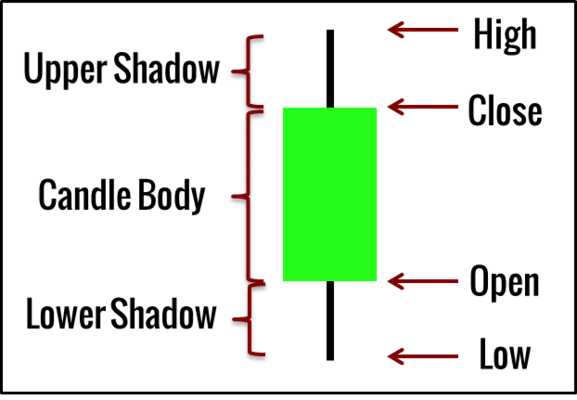
- The upper and low shadows (or wick) show selling and buying pressure, respectively.
- The candle body represents the resulting market sentiment. If the bar closes higher than it opened, it is bullish. If not, it is bearish. However, if the close is near the open, the sentiment is unclear. Such a candlestick is known as a Doji.
- The entire range (distance between high and low) signifies volatility.
To learn more about bar patterns and candlestick patterns, refer to the following:
- How to Read Price Action Bar by Bar
- Pring on Price Patterns : The Definitive Guide to Price Pattern Analysis and Intrepretation by Martin Pring
- Japanese Candlestick Charting Techniques by Steve Nison
Bar-By-Bar Analysis
Subsequently, traders started pushing the Dow principle of “price discounts everything” to its extreme and started studying price action bar-by-bar. The observations of tape readers and floor traders also contributed to the current repertoire of price action trading techniques.
The summation of chart patterns, bar/candlestick patterns, and other price tendencies like support and resistance then led to price action trading emerging as a distinct topic.
While price action trading is widely discussed in online trading forums and courses, few publications have attempted to organize its body of knowledge.

Al Brooks’s three-book series on price action trading was a remarkable attempt to do so and has encouraged great interest in the topic.
#3: Markets For Price Action Trading
Price action analysis focuses on pattern recognition. Hence, it works in most actively traded markets, as long as reliable price data is available. This is one of the advantages of technical analysis methods.
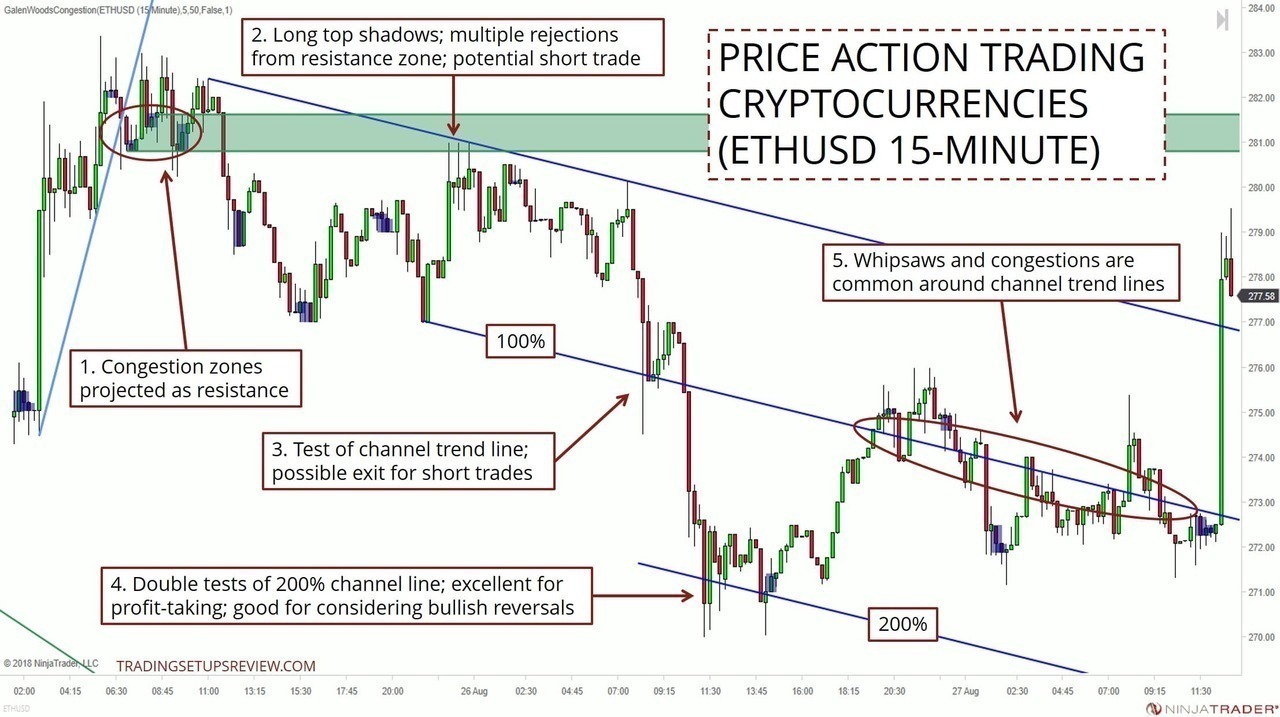
Generally, price action traders favor the forex, futures, stock market, and even the cryptocurrency market.
Here are more examples of analyzing price action in a variety of markets:
The optimal approach selects markets that have sufficient liquidity and volatility. These characteristics allow better expression of price patterns and reasonable execution of trades.
#4: Essential Price Action Trading Concepts
For trading with price action, there are a few essential building blocks.
- Price Patterns
- Market Swings
- Support and Resistance
- Trend Lines and Channels
This section will introduce them together with ample resources to learn more.
#4.1: Price Patterns
There are dozens of price patterns comprising both short-term and long-term patterns.
Given the proper market context, these patterns offer trading opportunities, also known as trading setups.
These are some popular price patterns:
We also have comprehensive reference lists of common price patterns:
#4.2: Market Swings
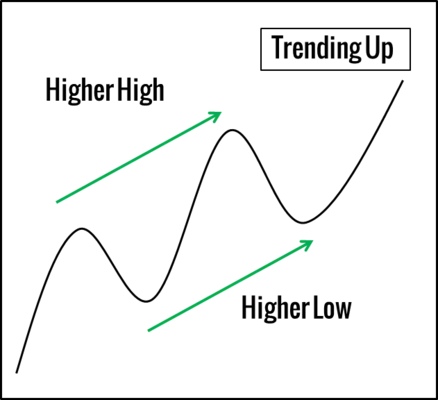
The market moves in swings. Hence, the zigzag movement forms the basic structure of the market.
Price action trading interprets higher highs and higher lows as an uptrend and lower highs and lower lows as a downtrend.
Deciphering market swings might not be intuitive at first. If so, moving averages can be a valuable tool for clarifying market swings. Refer to this guide for more information.
Finally, a notable framework on the behavior of market swings is the Elliot Wave Theory, which postulates an 8-wave pattern as a fractal of market movement. While it attempts to form a comprehensive theory, practical implementation is tricky. If you’re interested, Frost and Prechter’s Elliott Wave Principle: Key To Market Behavior offers in-depth information on this theory.
#4.3: Support & Resistance
Support areas are likely to reject price upwards, and resistance areas prevent the market from rising above it. They are critical concepts for price action trading.
Traders project support and resistance levels using swing pivot points and other price formations like congestion.
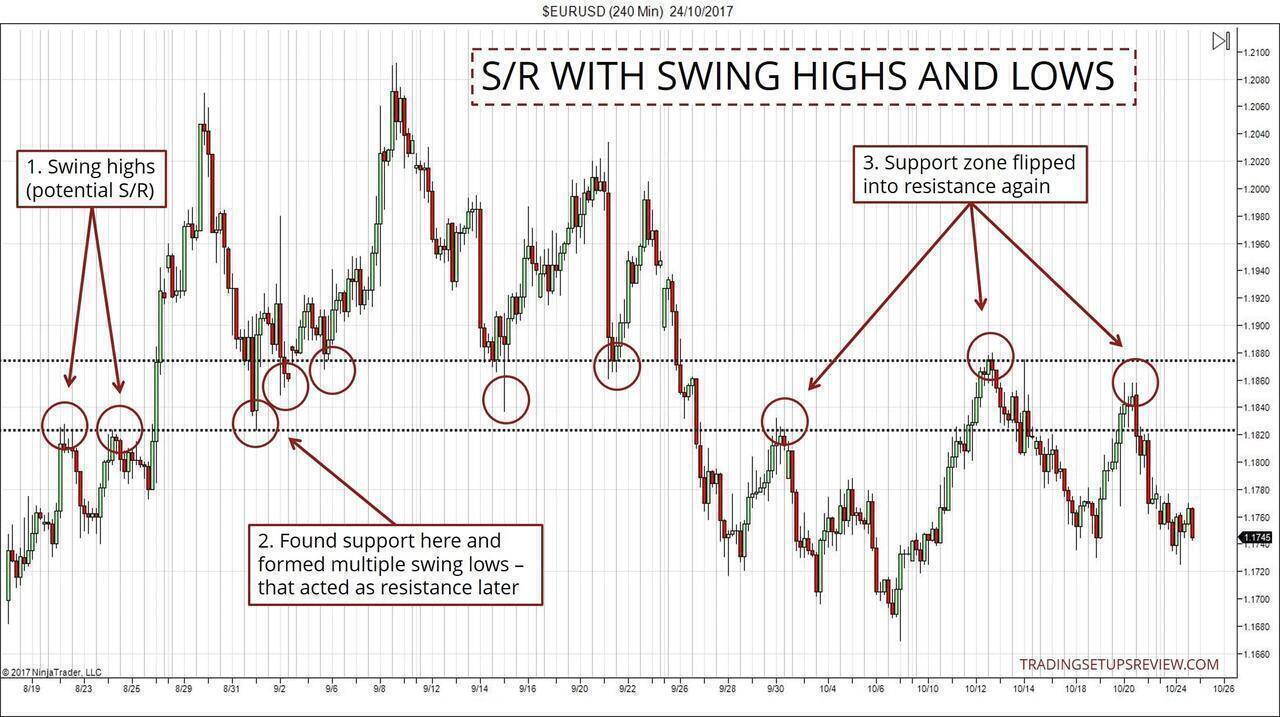
Support and resistance are core price action concepts. Therefore, the key to success is finding adequate support and resistance areas.
To learn more, refer to this comprehensive guide.
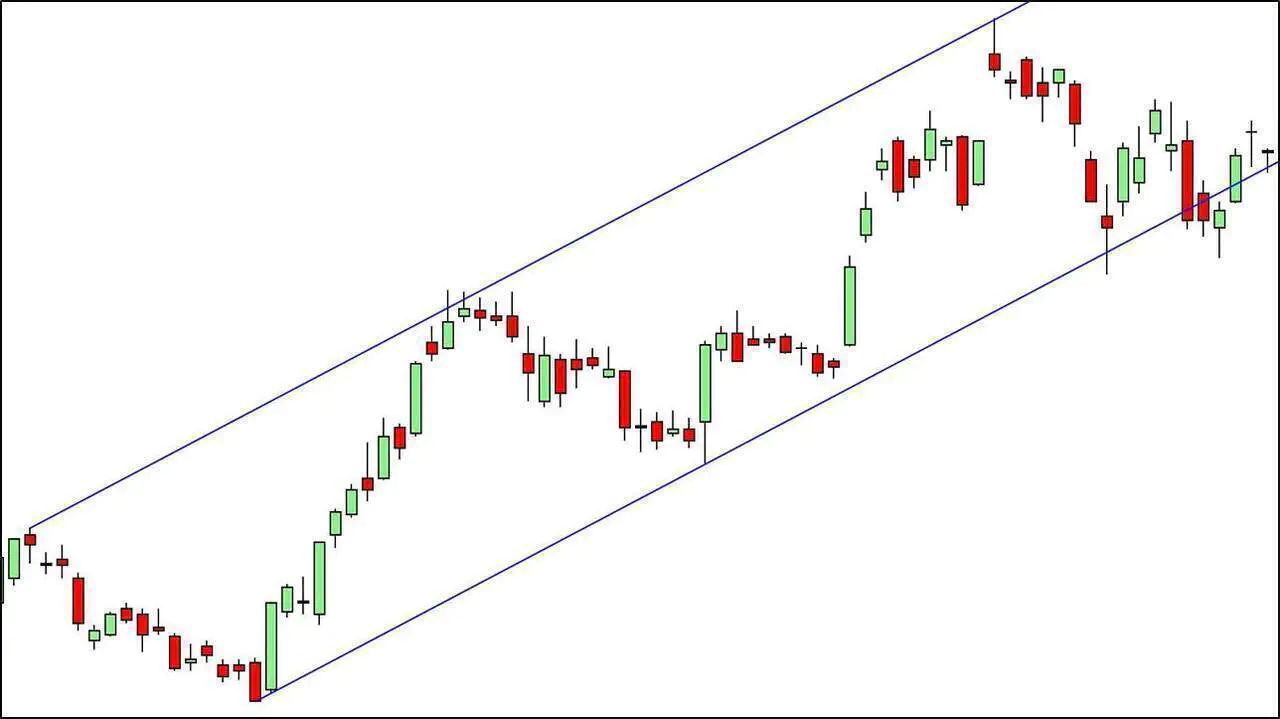
#4.4: Trend Lines & Channels
Trend lines connect swing pivots to track trends and serve as support and resistance.
In a bull trend, trend lines are drawn by connecting pivot lows. In a bear trend, trend lines are drawn with pivot highs.
By extending a parallel line from the trend line, we can form a helpful trading channel for anticipating support and resistance areas.
The chart below shows an example.
Trend line channels are versatile trading tools, and you can learn more about them in the tutorials below:
- 4 Effective Ways To Trade A Channel
- A Simple Trend Line Channel Strategy
- Trading Pullbacks Using Trend Lines and Price Channels
#5: Price Action Trading Methods
Most price action trading strategies combine price patterns with support and resistance areas.
The standard approach involves looking for:
- A bullish price pattern at a support area for a long trade; or
- A bearish price pattern at a resistance area for a short trade.
You can entirely rely on price action analysis or incorporate other tools to support it.
#5.1: Pure Price Action
Some traders use price action analysis exclusively. They adopt a minimalist approach and do not place any indicators on their charts.
These traders typically use discretionary strategies and are well-versed in spotting price patterns and support/resistance areas.
#5.2: Price Action With Volume
Recall the Dow Theory we discussed above?
Another tenet of the Dow Theory is that volume should increase in the trend direction and decrease when moving against it.
Hence, it is not surprising that volume analysis is a standard complement to price action trading. Classical volume analysis combines volume patterns with chart patterns to evaluate a trading opportunity.
Integrating volume with price action has also led to the development of Volume Spread Analysis, which is based on Richard Wyckoff’s work on the relationship between volume and the spread (range) of the bar.
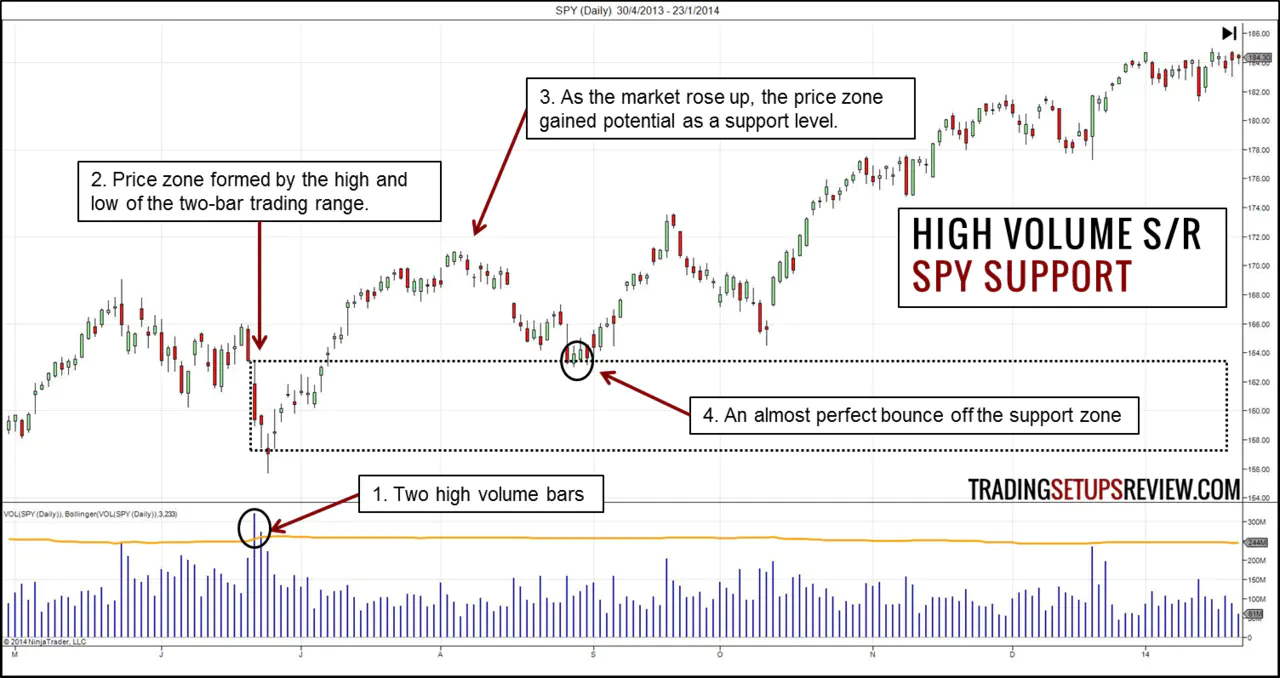
Observing price action with volume leads to intriguing trading methods. However, I recommend including volume only after familiarizing yourself with price action.
#5.3: Price Action With Indicators
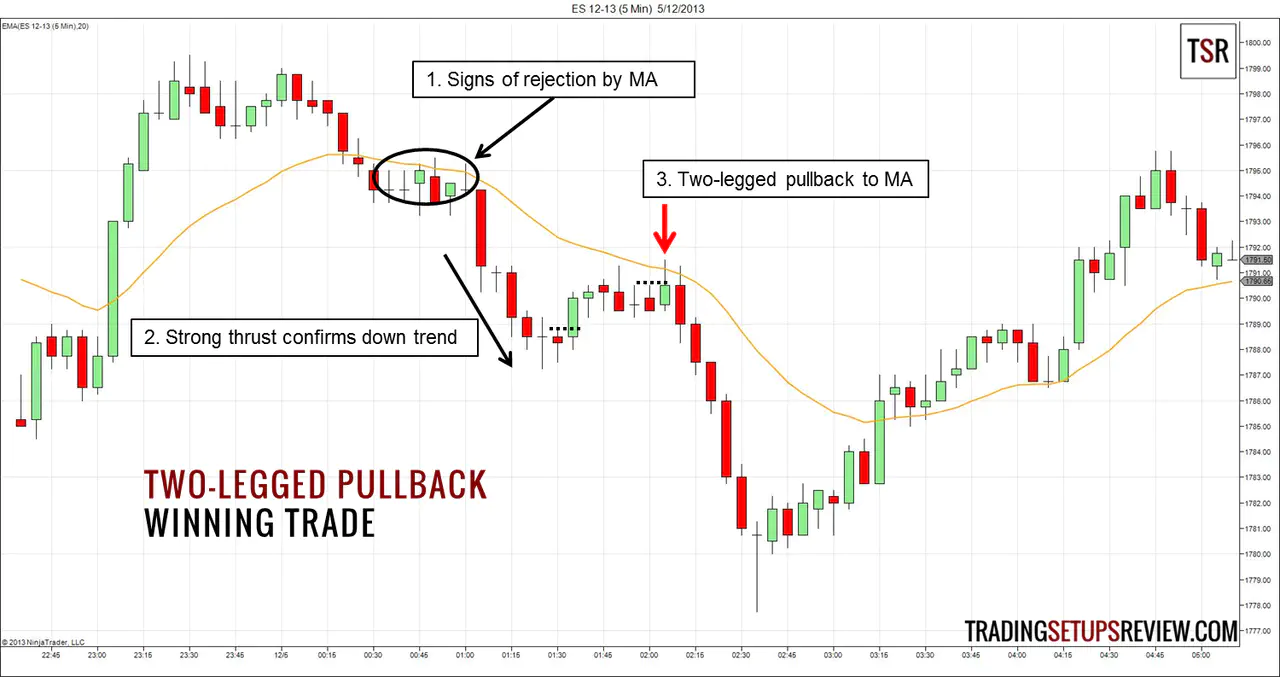
Despite the emphasis on price analysis, many traders still find value in indicators.
The most popular trading indicator among price action traders is the moving average. It serves as a trend indicator and a dynamic support/resistance simultaneously.
An example is Al Brooks’ trading approach which uses a 20-period exponential moving average. The chart below shows this strategy in action.
In Steve Nison’s books on candlesticks, he also discussed how to analyze candlestick patterns with trading indicators. If you are interested in this approach, refer to the articles below:
- Trading Candlestick Patterns With The RSI
- Swing Trading Candlesticks With Stochastic
- Candlestick Pattern With A Moving Average
#6: Beyond The Primer
You’ve just completed a short introductory guide to price action.
What lies beyond?
This is what I recommend. In sequence, learn how to:
- Describe the market in terms of price action features
- Analyze what the market is doing right now
- Select trading setups
Most traders jump right into finding trade setups. But in the long run, this method will backfire as you miss out on building a solid foundation.
The best way to learn is to observe and study price movements yourself. So load up your charts, and start paying more attention to price, the most crucial variable.
Want to learn more? Head over to our Price Action Guide, where you will find a comprehensive guide to plenty of learning materials.
The article was first published on 8 March 2014 and updated on 10 February 2026.