10 Chart Patterns For Price Action Trading
By Galen Woods ‐ 14 min read
From the popular Head & Shoulders to the less common Cup & Handle, these are 10 chart patterns every price action trader should know.
Do you look at price charts for your trading? But what do you see?
These are 10 chart patterns that every price action trader should see when they look at a price chart.
Reversal Chart Patterns
1. Head & Shoulders
2. Double Top / Double Bottom
3. Triple Top / Triple Bottom
4. Rounding Top / Rounding Bottom
5. Island Reversal
Continuation Chart Patterns
6. Rectangle
7. Wedge
8. Triangle
9. Flag
10. Cup & Handle
Reversal Chart Patterns
The first five chart patterns are reversal patterns.
Typically, they start by trying continue the trend. When that last-ditch attempt fails, the reversal is confirmed.
However, remember that most reversal patterns fail, especially when the trend is strong. Hence, trade them carefully.
1. Head & Shoulders
What does a Head & Shoulders pattern look like?
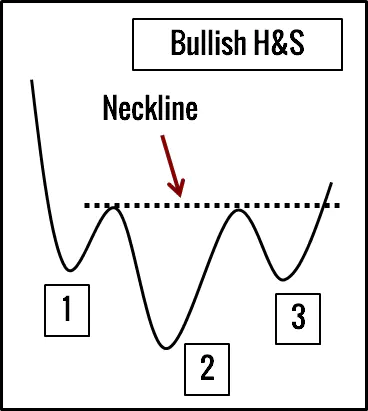
The bullish pattern has three swing lows. The middle swing low is the lowest. The line connecting the two swing highs is the neckline.
The bearish pattern has three swing highs. The middle swing high is the highest. The line connecting the two swing lows is the neckline.
What does a Head & Shoulders pattern mean?
In the bullish instance, the left shoulder and the head highlight the downwards trend. The right shoulder, by ending above the head, halts the bearish trend.
The break of the neckline then confirms a change of trend. Hence, the Head & Shoulders pattern is a reversal chart pattern.
The same logic works for the bearish pattern as well.
How do we trade a Head & Shoulders pattern?
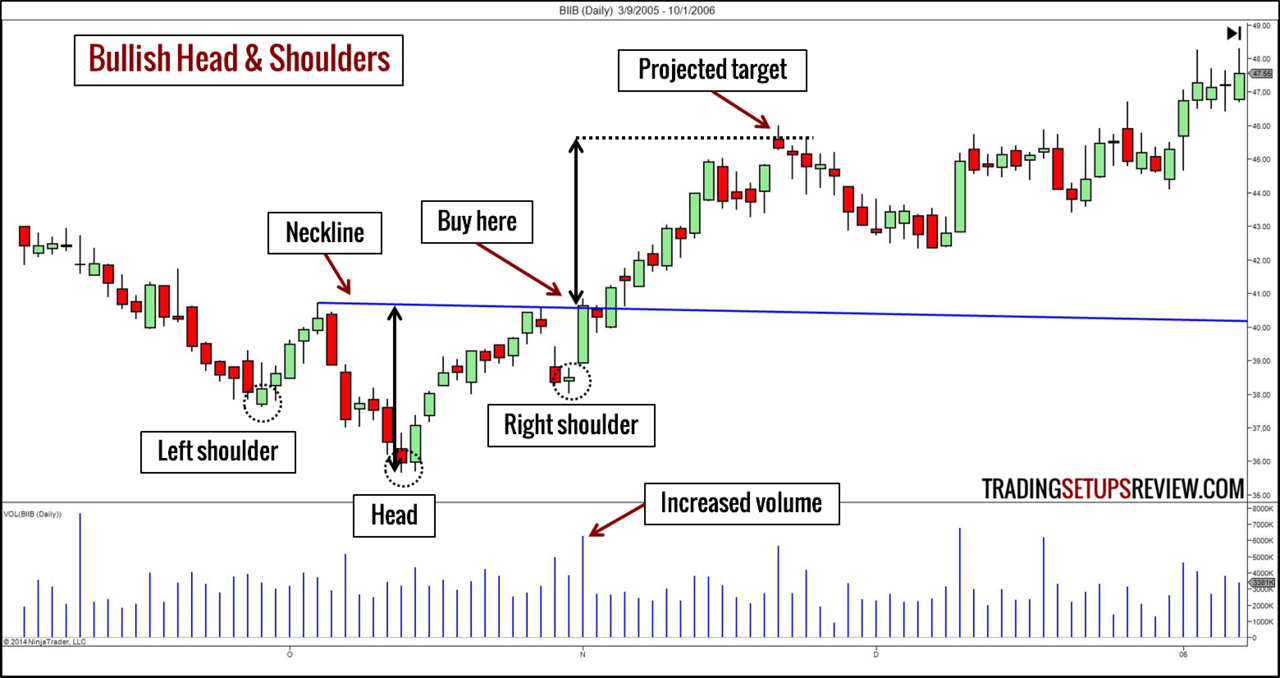
As it is a reversal chart pattern, we need an existing trend to reverse. A bullish pattern must take place in a downwards trend, and a bearish pattern should take place in a upwards trend. Generally, the longer the trend, the larger the Head & Shoulders formation needed to reverse it.
For a bullish pattern, buy:
- On break-out above the neckline; or
- On pullback to the neckline after the break-out.
For a bearish pattern, sell:
- On break-out below the neckline; or
- On pullback to the neckline after the break-out.
Volume should increase on break-out.
For the target objective, measure the distance between the neckline and the head. Then, project the distance from the break-out point.
2. Double Top / Double Bottom
What does a Double Top / Bottom pattern look like?
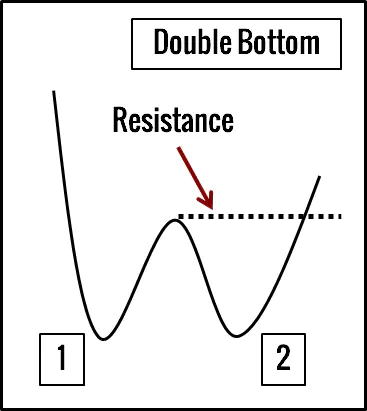
A Double Bottom has two swing lows at around the same price level. The swing high in between them projects a resistance line.
A Double Top has two swing highs at around the same price level. The swing low in between them projects a support line.
What does a Double Top / Bottom pattern mean?
In a Double Bottom, the first swing low marks the extreme low of a downwards trend. When the second swing low fails to push below it, it is a warning that a reversal might occur. Once the market breaks above the resistance level, it confirms the bullish reversal.
In a Double Top, the same logic applies and leads to a bearish reversal.
How do we trade a Double Top / Bottom pattern?
As it is a reversal chart pattern like the Head & Shoulders, we must have a trend for the pattern to reverse. Do not look for reversal patterns like the Double Top / Bottom in a sideways market.
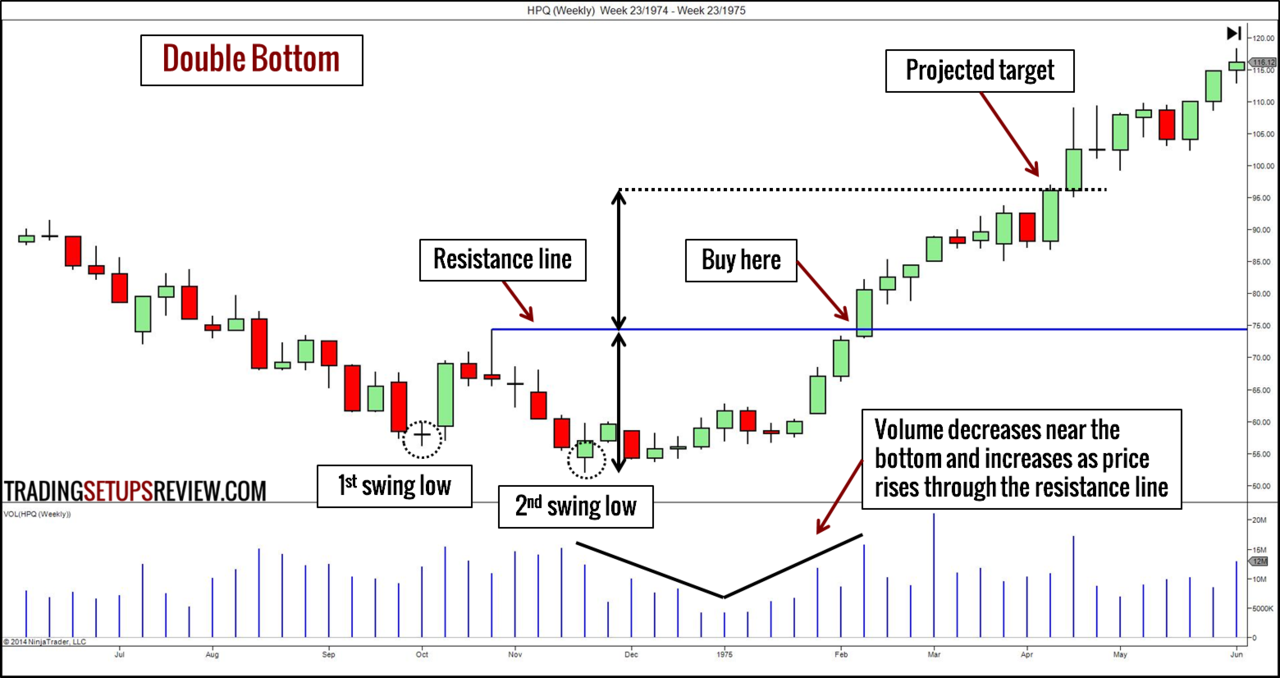
For a bullish pattern, buy:
- On break-out above the resistance line; or
- On pullback to the resistance line (now acting as support) after the break-out.
For a bearish pattern, sell:
- On break-out below the support line; or
- On pullback to the support line (now acting as resistance) after the break-out.
Volume should increase as price breaks out of the resistance/support line.
To get the target objective, measure the height of the pattern and project it from the break-out point.
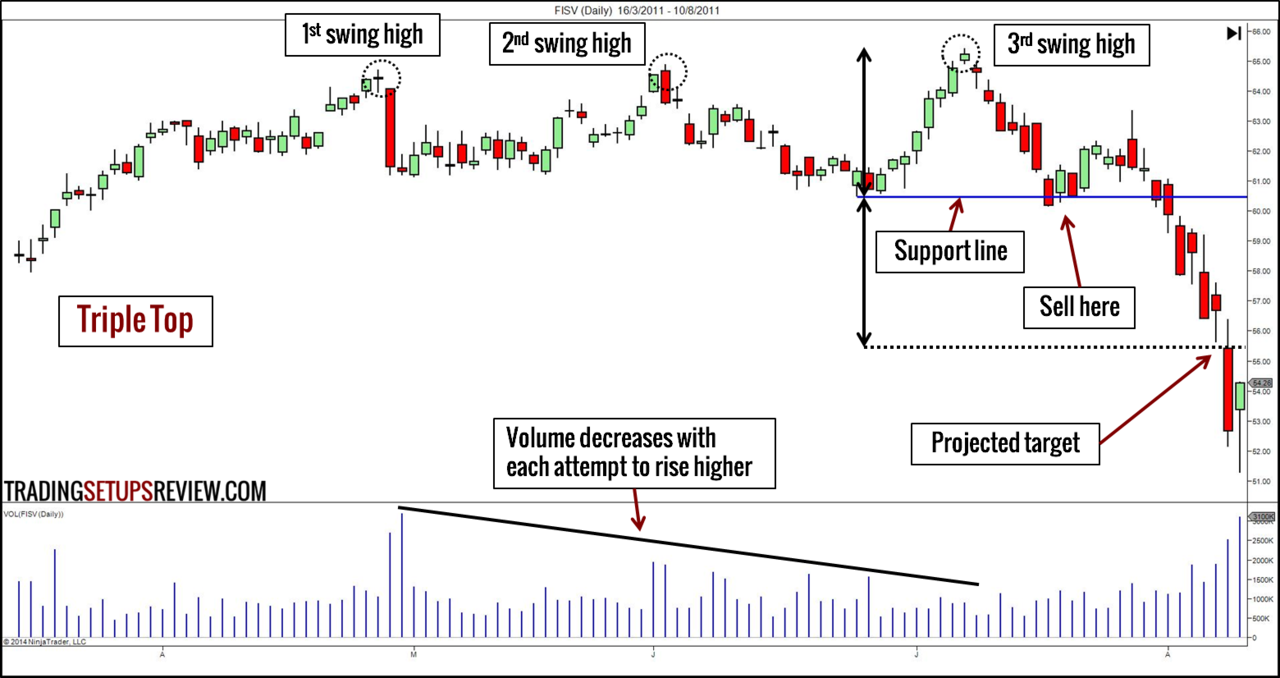
3. Triple Top / Triple Bottom
What does a Triple Top / Bottom pattern look like?
If you can find a Double Top / Bottom, looking for a Triple Top / Bottom is straightforward.
A Triple Bottom has three swing lows at around the same price level, and a Triple Top has three swing highs at around the same price level.
You can also relate it to the Head & Shoulders chart pattern. Just that in this case, the middle pivot is equal to the other two pivots.

What does a Triple Top / Bottom pattern mean?
The Triple Bottom represents two failed attempts to push below the support established by the first swing low. Naturally, it hints at a trend reversal. A break-out above the resistance line confirms the reversal.
Similarly, the Triple Top shows two unsuccessful tries to continue an upwards trend and signifies a bearish reversal.
How do we trade a Triple Top / Bottom pattern?
The trading method is akin to the Double Top / Bottom chart pattern.
For a Triple Bottom chart pattern, buy:
- On break-out above the resistance line; or
- On pullback to the resistance line (now acting as support) after the break-out.
However, drawing the resistance line of a Triple Bottom might be tricky, especially if the two swing highs are unequal.
In that case, you can draw the resistance line:
- With the higher swing high; or
- With the second swing high; or
- Somewhere in the middle of the two swing highs.
For a Triple Top chart pattern, sell:
- On break-out below the support line; or
- On pullback to the support line (now acting as resistance) after the break-out.
You can draw the support line of a Triple Top pattern:
- With the lower swing low; or
- With the second swing low; or
- Somewhere in the middle of the two swing lows.
Volume should increase when price breaks out of the resistance/support line. It should also decrease with each upswing in the case of a Triple Top. For a Triple Bottom, volume should decrease with each down swing.
For the target objective, measure the height of the pattern and project it from the break-out point.
Read: Trading Candlesticks with Triple Tops / Bottoms
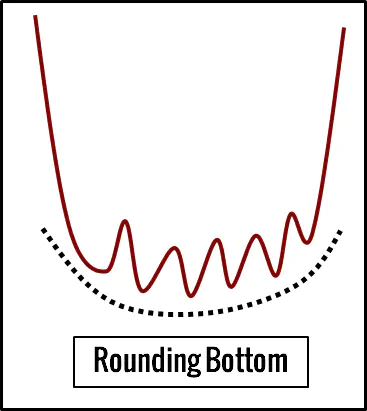
4. Rounding Top / Rounding Bottom
What does a Rounding Top / Bottom pattern look like?
A Rounding Top consists of minor price swings that rise and fall gradually, presenting a dome shape at the top of the chart.
Flip a Rounding Top vertically, and it becomes a Rounding Bottom.
Rounding Tops / Bottoms usually take a long time to form and are found more often on weekly charts.
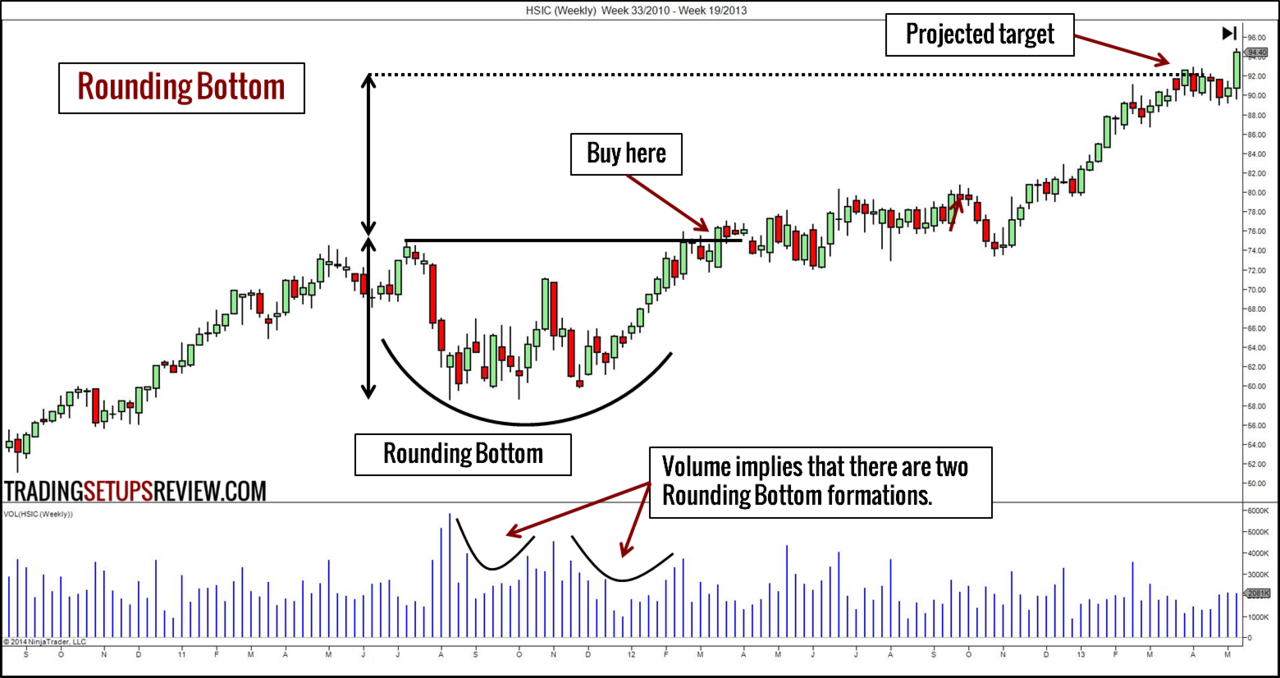
What does a Rounding Top / Bottom pattern mean?
A Rounding Top shows a gradual change of market sentiment from bullish to bearish.
A Rounding Bottom implies a sentiment change from bearish to bullish.
This reversal formation is relatively subdued.
How do we trade a Rounding Top / Bottom pattern?
For a Rounding Bottom chart pattern, buy when price closes above the high of the pattern.
For a Rounding Top chart pattern, sell when price closes below the low of the pattern.
You can take a more aggressive entry by looking for short-term price patterns before the completion of the pattern, especially if the volume pattern is encouraging.
Volume should decrease towards the middle of the pattern and rises again towards the end of it.
For the target objective, measure the height of the pattern and project it from the break-out point.
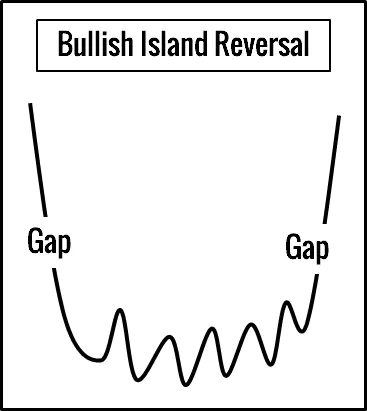
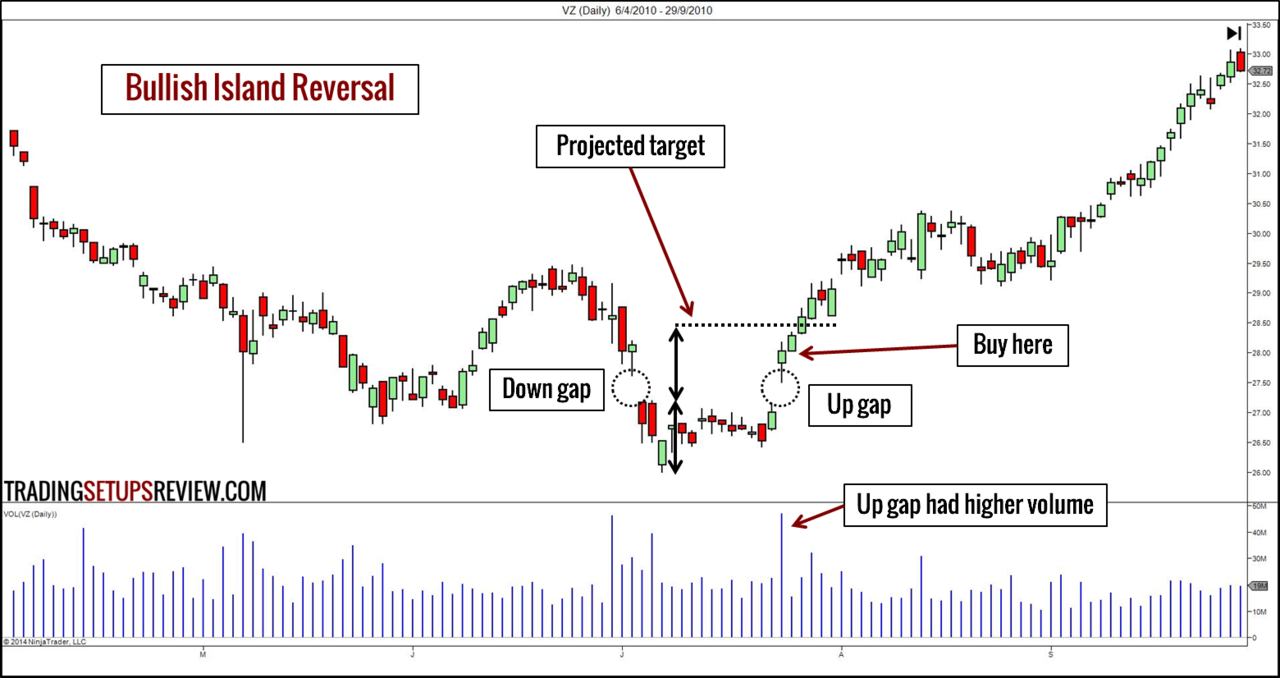
5. Island Reversal
What does an Island Reversal pattern look like?
An Island Reversal is a piece of price action that is completely broken off from the rest of the chart.
It has a gap before it (Exhaustion Gap) and a gap after it (Breakaway Gap).
A bullish Island Reversal starts with a down gap in a bear trend. After a period of sideways trading, the market gaps upwards to reverse the bearish trend.
A bearish Island Reversal starts with an upwards gap, followed by sideways trading before reversing the trend with a downwards gap.
In both cases, the two gaps must have overlapping price range.
What does an Island Reversal pattern mean?
The first gap represents a climatic move aligned with the existing trend. However, instead of following through with the gap’s momentum, the market meanders.
Hence, when the market makes a gap against the trend, it is a reversal signal.
The logic behind this chart pattern is similar to the Morning Star and Evening Star candlestick patterns.
How do we trade an Island Reversal pattern?
For a bullish pattern, buy when price gaps up away from the Island.
For a bearish pattern, sell when price gaps down away from the Island.
For this chart pattern, volume should decrease for the first gap and increase with the second gap that is reversing the trend.
For the target objective, measure the height of the Island and project it from the breakaway point.
Continuation Chart Patterns
As price retraces in a trending market, it forms a variety of continuation chart patterns.
To find these chart patterns, simply draw two lines to contain the retracing price action. Draw one line above the retracement (“resistance”) and one line below it (“support”).
As you will see below, the relationship between these two lines will help us differentiate the continuation chart patterns.
6. Rectangle
What does a Rectangle pattern look like?
If two horizontal lines surround a retracement, it is a Rectangle chart pattern.
Both the bullish and bearish Rectangle patterns looks the same. However, they appear in different trend context.
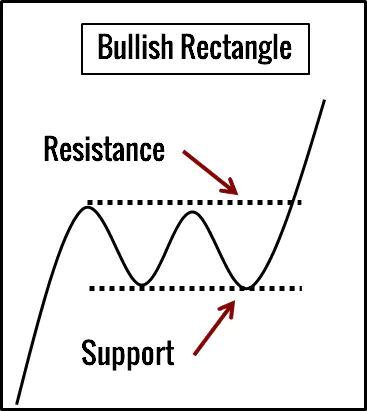
What does a Rectangle pattern mean?
A Rectangle chart pattern indicates sideways action.
When the market enters in a congestion phase, it is likely to break out in the direction of the preceding trend.
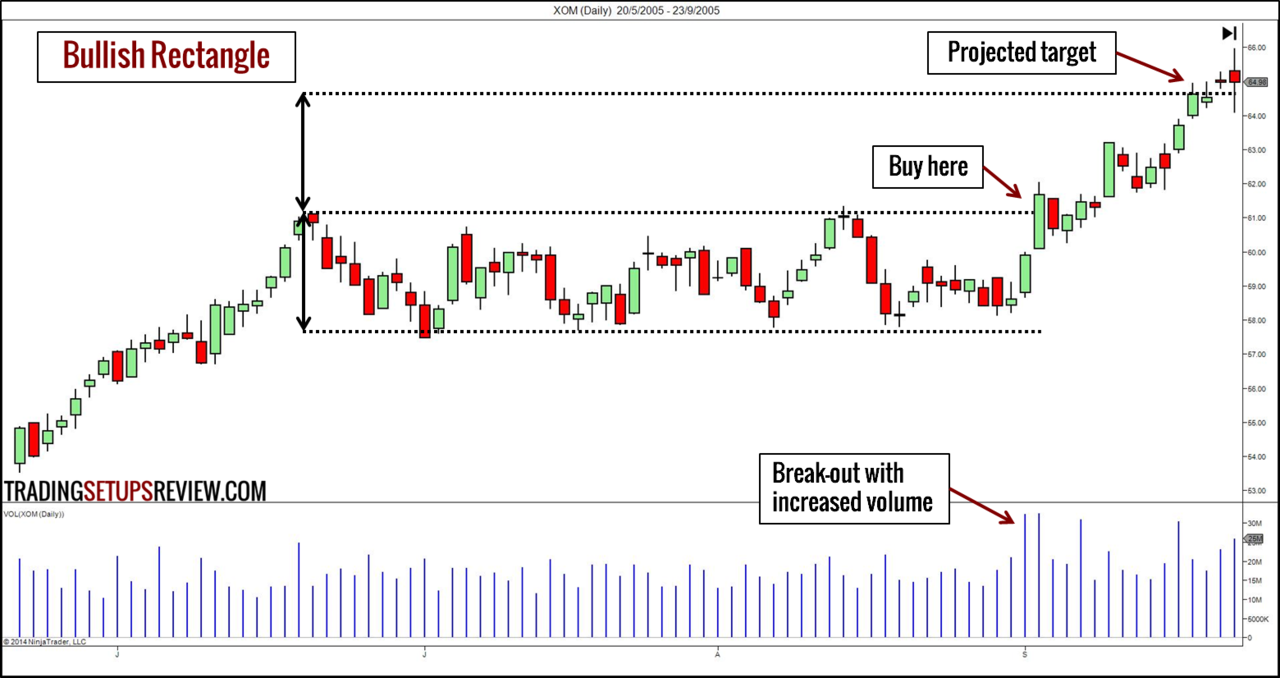
How do we trade a Rectangle pattern?
Remember that the trend before the Rectangle chart pattern determines if the pattern is bullish or bearish. A Rectangle pattern continues the prior trend.
For a bullish pattern, buy:
- On break-out above the resistance line; or
- On pullback to the resistance line (now acting as support) after the break-out.
For a bearish pattern, sell:
- On break-out below the support line; or
- On pullback to the support line (now acting as resistance) after the break-out.
Volume should increase when price breaks out of the resistance/support line.
For the target objective, measure the height of the Rectangle and project it from the break-out point.
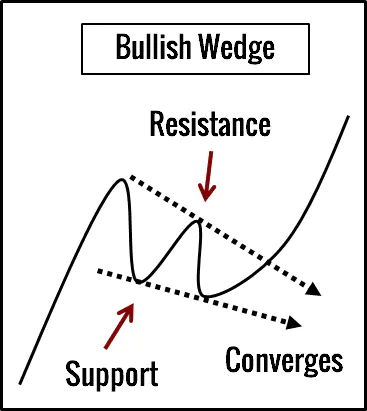
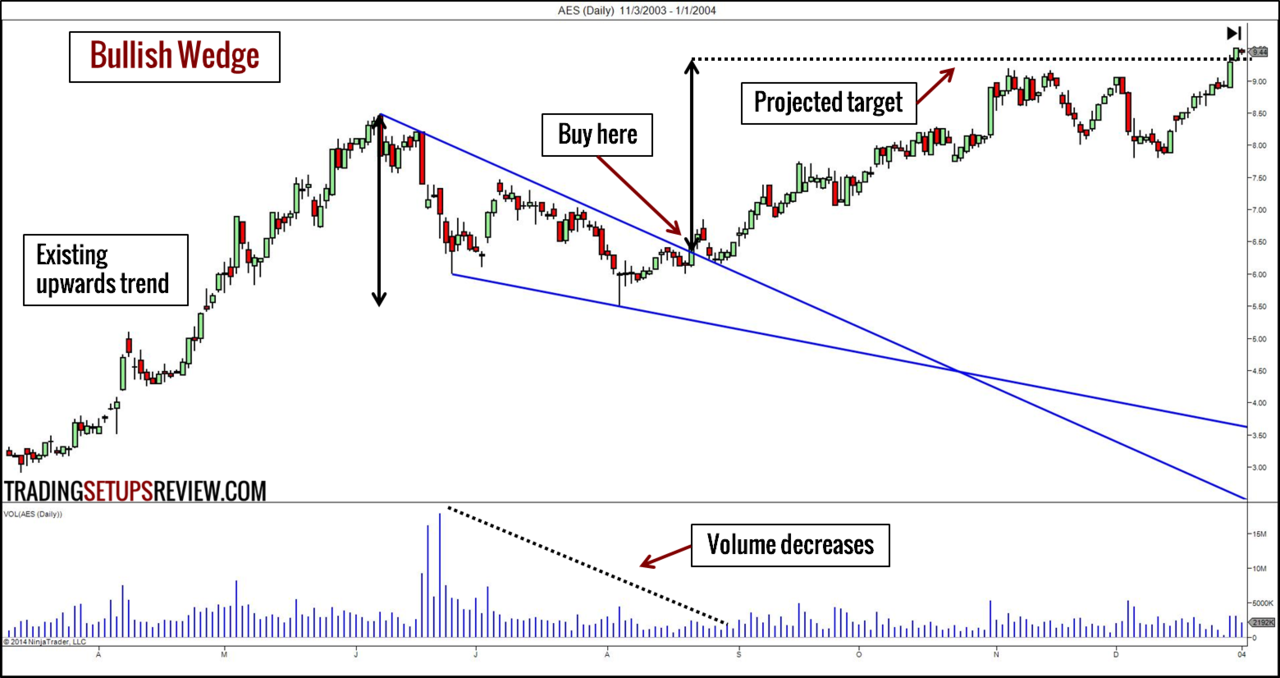
7. Wedge
What does a Wedge pattern look like?
For a Wedge pattern pullback, the two lines converge.
A bullish Wedge chart pattern takes place in an upwards trend, and the lines slope down. It is also known as a Falling Wedge.
A bearish Wedge chart pattern is found in a downwards trend, and the lines slope up. (Rising Wedge)
What does a Wedge pattern mean?
The defining feature of a Wedge chart pattern is the set of converging trend lines.
It means that the magnitude of the swings within the Wedge pattern is decreasing. This contraction in swing magnitude implies that the Wedge is moving against the path of least resistance.
Hence, when the market moves decisively with the trend, it confirms that the trend is resuming.
How do we trade a Wedge pattern?
For a bullish pattern, buy when price breaks above the resistance.
For a bearish pattern, sell when price breaks below the support.
Volume should decrease as the Wedge pattern forms, and increase with the break-out.
For the target objective, measure the height of the entire Wedge pattern and project it from the break-out point.
8. Triangle
What does a Triangle pattern look like?
There are three types of Triangle chart patterns.
- Ascending
- Descending
- Symmetrical
We can describe each variant easily with the two trend lines surrounding the retracement,
An Ascending Triangle has a horizontal resistance and a rising support. (Example on the right.)
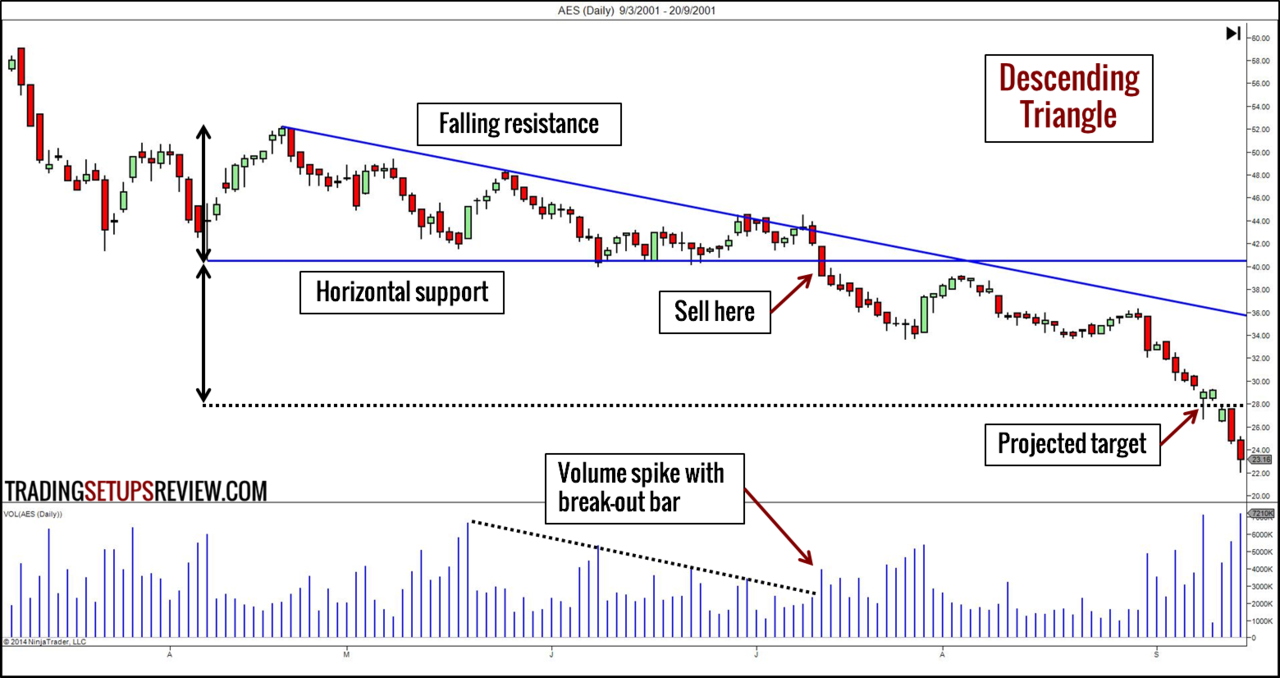
A Descending Triangle has a falling resistance and a horizontal support. (Example below.)
A Symmetrical Triangle has a rising support and falling resistance. The support line and the resistance line should slope at similar angles to produce the symmetry. (Example on Investopedia.)
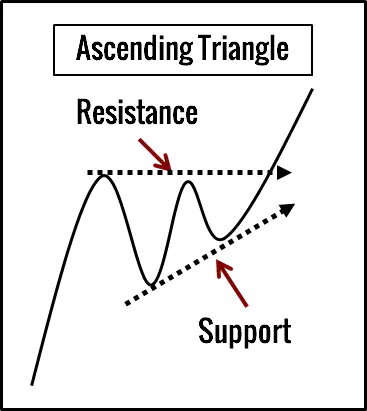
What does a Triangle pattern mean?
An Ascending Triangle pattern is a bullish chart pattern. It shows the market in a pause during an upwards trend. However, the rising swing lows imply bullishness.
By the same logic, a Descending Triangle pattern, with the lower swing highs, is a bearish pattern.
The Symmetrical Triangle is a continuation pattern as well. However, its directional tendency is less obvious. It depends on the trend in which it forms. Thus, it is bullish when it forms in a bull trend and bearish in a downwards trend.
How do we trade a Triangle pattern?
In a bull trend, buy on break-out above an Ascending Triangle or a Symmetrical Triangle.
In a bear trend, sell on break-out below a Descending Triangle or a Symmetrical Triangle.
Volume should decrease as the Triangle chart pattern forms, and increase with the break-out.
For the target objective, measure the height of the widest part of the Triangle and project it from the break-out point.
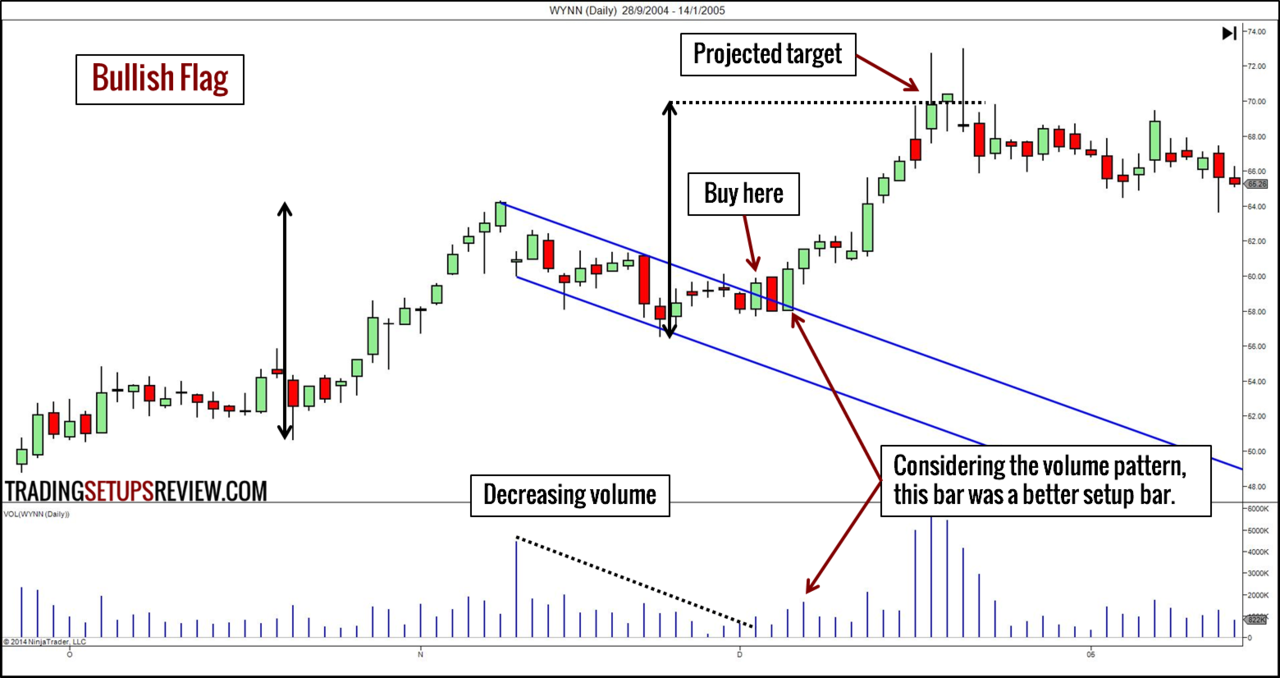
9. Flag
What does a Flag pattern look like?
A Flag pattern has a flag pole and a flag.
The flag pole is a sharp thrust in the direction of the trend. Identifying the flag pole is critical for the Flag pattern. Look for strong and obvious price thrusts with consecutive bars, gaps, and strong volume in the same direction.
For a bullish Flag pattern, we need an upthrust as the flag pole. The flag is made up of two parallel lines that slope downwards.
The bearish Flag pattern has a downward thrust as the flag pole. The two lines making up the flag are also parallel, but slope upwards.
(A related chart pattern is the Pennant Pattern, which is essentially a flag pole with a Triangle pattern as the flag.)
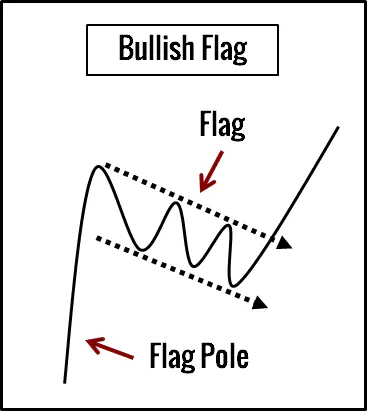
What does a Flag pattern mean?
The key feature of a Flag pattern is the flag pole which is a powerful price move. The Flag pattern represents a short break before the market continues moving in the same direction.
Hence, it is an ideal continuation chart pattern.
How do we trade a Flag pattern?
Buy on break-out above a bullish Flag pattern.
Sell on break-out below a bearish Flag pattern.
Volume should decrease as the Flag pattern forms, and increase with the break-out.
The target projection for a Flag pattern is different from the other chart patterns. Measure the height of the flag pole. Then, extend it from the lowest point of a bullish flag or the highest point of a bearish flag.
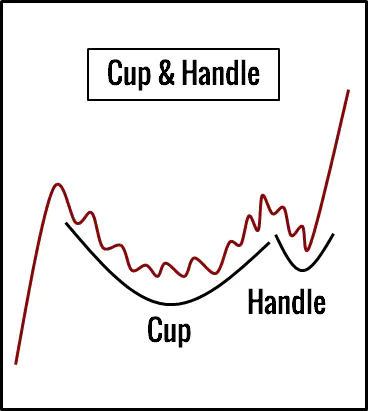
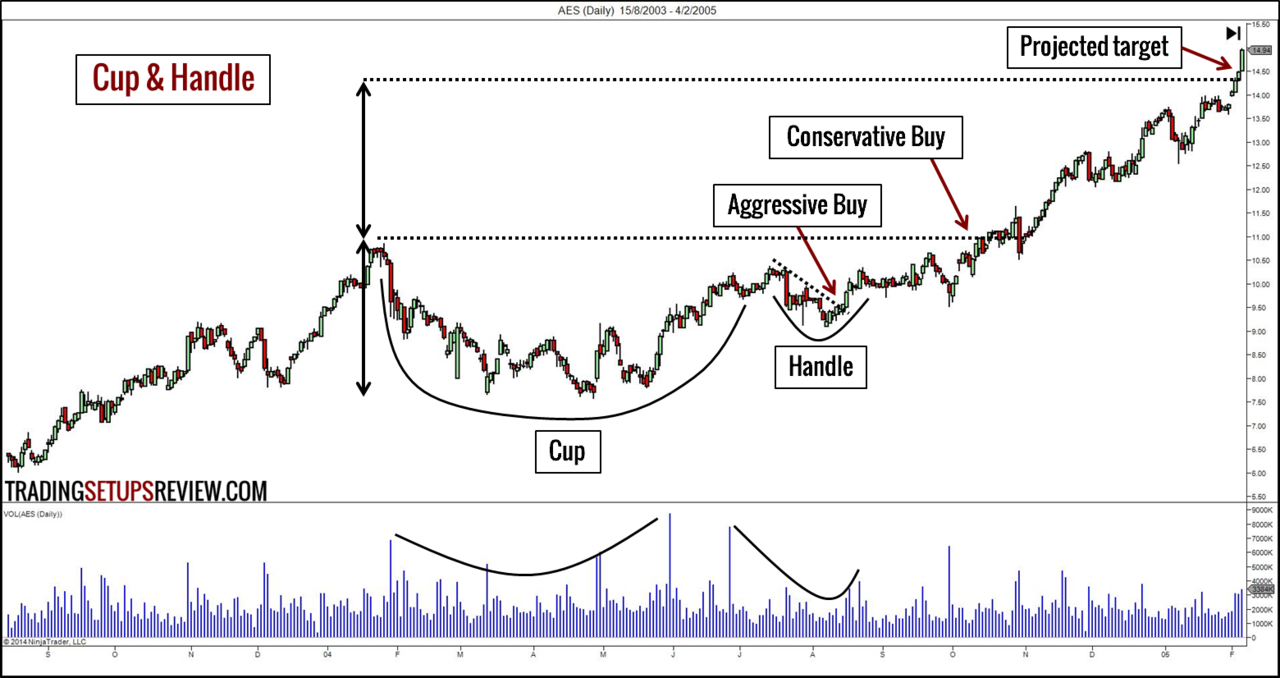
10. Cup & Handle
What does a Cup & Handle pattern look like?
The cup looks like a Rounding Bottom. The handle, which follows the cup, looks like a typical retracement (for e.g. Wedge, Flag).
The Cup & Handle chart pattern is a bullish pattern. Its bearish counterpart is the Inverted Cup & Handle pattern.
What does a Cup & Handle pattern mean?
A Cup & Handle pattern is basically a Rounding Bottom following by a pullback. Hence, it marks a period of consolidation in which the bulls take over from the bears gradually.
The last retracement (handle) is the last bearish push. When it fails, we expect the market to rise.
An Inverted Cup & Handle pattern follows a similar logic with a Rounding Top and a pullback upwards.
How do we trade a Cup & Handle pattern?
The conservative entry for the Cup & Handle chart pattern is to buy on break-out of the high of the cup. The aggressive entry can take place once the handle pullback fails.
For the Inverted Cup & Handle pattern, you can sell when the market breaks below the low of the cup or when the handle pullback breaks down.
The volume pattern should resemble that of a Round Top / Bottom for both the cup and the handle formations.
For the target objective, measure the depth of the cup and project it from its high (or low for the Inverted pattern).
To learn more about trading with the Cup & Handle pattern, refer to How to Make Money in Stocks: A Winning System in Good Times and Bad, Fourth Edition.
What Next?
Understand that Chart Patterns Fail
Trading examples of chart patterns (including those above and on other websites and books) are usually textbook examples. The purpose is to show the ideal form of chart patterns working effectively. This is why the target objectives seem magically achieved each time.
However, like any other trading methods, chart patterns fail.

. It has extensive performance statistics and ranking of most chart patterns.
Learn to Interpret Chart Patterns
Thomas Bulkowski’s research uses rigid definitions of chart patterns which are reasonable for his purpose. However, in fact, most traders differ in the way they find chart patterns as they look at price swings (degree of swing) and draw trend lines (ignore or include candle shadows) differently.
This is not a problem because trading chart patterns is, in any case, beyond simple pattern recognition. Using chart patterns in isolation is not a winning strategy.
Instead, include volume, short-term price patterns, and other support/resistance tools to pinpoint trading opportunities. While the target projection of chart patterns is a valuable tool for target setting, combine the projected target with other support/resistance levels for better results.
With experience, you will also realise that the simplistic classification of the patterns into reversal and continuation does not always apply. The trading rules of each chart pattern are more like guidelines.
If you love chart patterns, I recommend these books:
- Technical Analysis and Stock Market Profits [Paperback] [2008] (Author) Richard W. Schabacker
- Technical Analysis of Stock Trends, Tenth Edition
To complete your price pattern education, don’t miss: