How To Read Price Action With Bollinger Bands
By Galen Woods ‐ 9 min read
Don't miss the power of price volatility in your price action analysis. The interaction between price and the Bollinger Bands reveals useful trading clues.
Price action trading is more than just learning price patterns like the Engulfing candlestick and Head & Shoulders. We often overlook a crucial aspect of price action: its volatility. How much the market moves is as important as which direction the market moves. To integrate volatility into our analysis, Bollinger Bands offer a robust tool.
In this concise guide with in-depth examples, you will learn how to use Bollinger Bands to boost your price action analysis.
This guide has three sections:
- What are Bollinger Bands?
- Price Action Scenarios
- Trading Examples
What are Bollinger Bands?
Take a look at the chart below showing the Bollinger Bands.
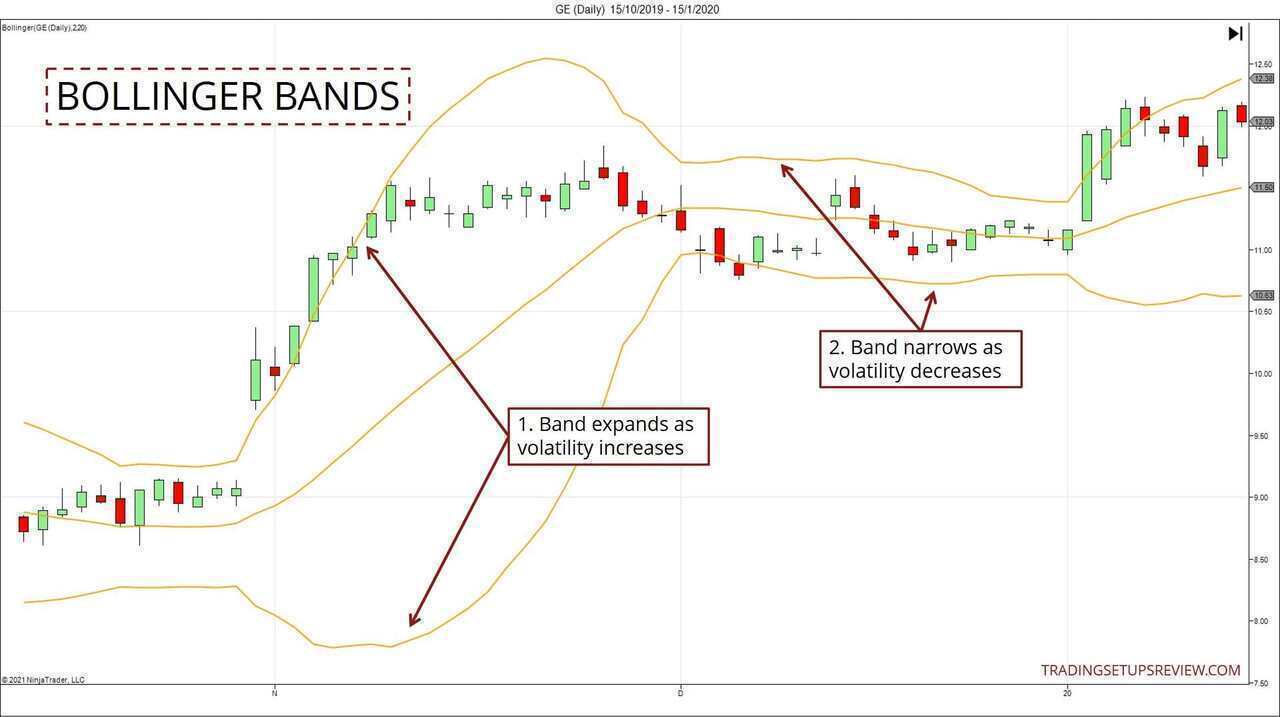
As you can see above, Bollinger Bands consists of three lines driven by price fluctuations.
- Middle Band Line = N-period simple moving average (SMA)
- Upper Band Line = N-period SMA + (N-period standard deviation x multiple)
- Lower Band Line= N-period SMA - (N-period standard deviation x multiple)
The standard value for N is 20. And the usual multiple applied is 2.
In a nutshell, Bollinger Bands create an envelope around a moving average of price. And the width of that envelope depends on the price volatility (or standard deviation).
Hence, Bollinger Bands expand and contract according to the standard deviation of past price action.
This characteristic of the Bollinger Bands is the key to using it to read price action in the context of its recent volatility. So our focus as price action traders is to watch how the Bands interact with price action. From there, you will be able to uncover valuable trading information.
Price Action Scenarios with Bollinger Bands
Have you been watching the dance between the market and the Bollinger Bands?
If you have, you would’ve noticed the following scenarios:
- Price bars tagging the Bollinger Bands and reversing
- Consecutive price bars pushing against the Bollinger Bands
- A price bar forming entirely beyond the Bollinger Bands (Outlier Bar)
In this section, let’s take a closer look at each scenario. At the same time, you’ll also learn how each situation serves as the premise for various trading strategies.
Scenario #1: Price bars tagging the Bollinger Bands and reversing
In the chart below, we observe the following:
- The market is moving sideways.
- It confirms a lack of volatility.
- The market is trapped within a trading range.
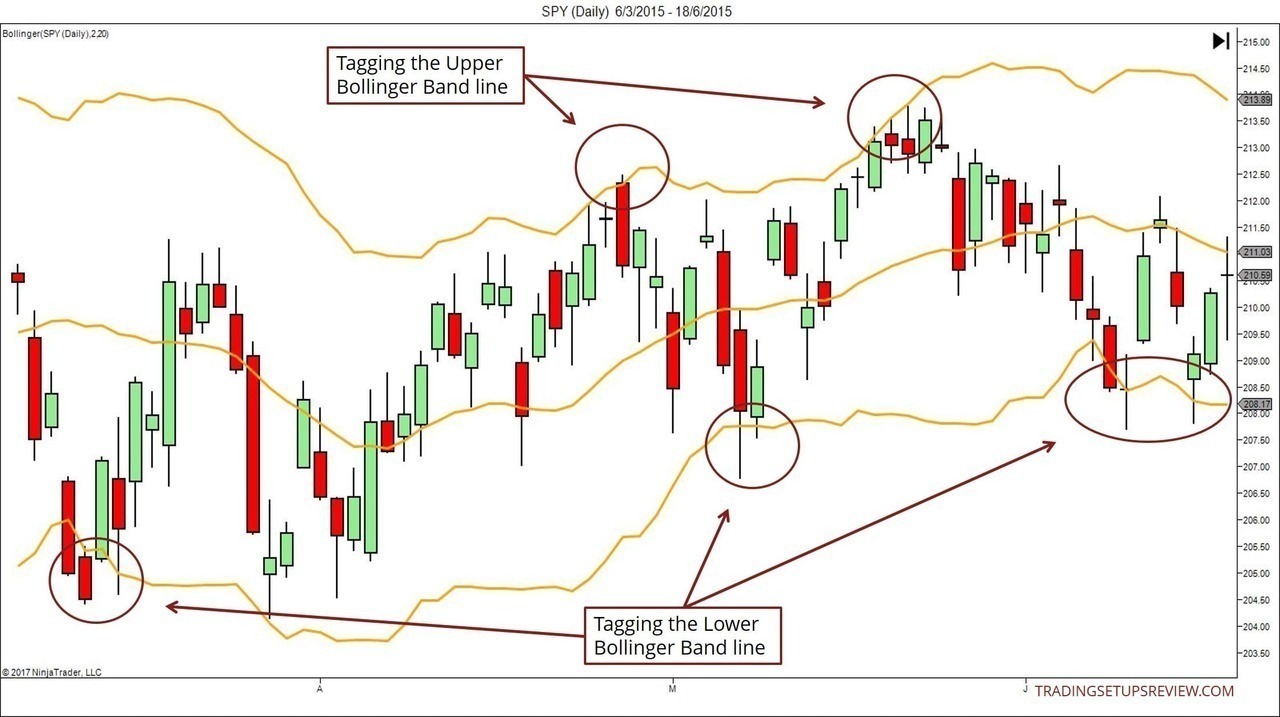
This sideways market is ideal for scalpers who are aiming for small profits.
You can enhance its performance by looking for reasons that support a sideways market.
For instance, the forex market tends to move sideways just before the release of critical economic data. During that pre-news period, you might consider taking quick trades by fading moves within the Bollinger Bands. However, following this trading premise, you must flatten your positions before the actual release.
Basic Strategy
Of course, the market might not always bounce perfectly between the two lines. Hence, you need to be agile when entering and exiting the market as a scalper.
But when they do, the following simple rules work well.
For bullish trades:
- As the market hits the Lower Band Line, buy with a limit order.
- Aim to exit at the Upper Band Line.
For bearish trades:
- As the market hits the Upper Band Line, sell short with a limit order.
- Aim to take profit at the Lower Band Line.
For an excellent example of using the Bollinger Bands in a sideways market, refer to the Gimmee Bar setup.
Scenario #2: Consecutive price bars pushing against the Bollinger Bands
Continuous price bars pushing against the Bollinger Bands show a decisive breakout.
It confirms market strength. With that formation, the market tells you not to fight the trend unless you want to trade contrarian.
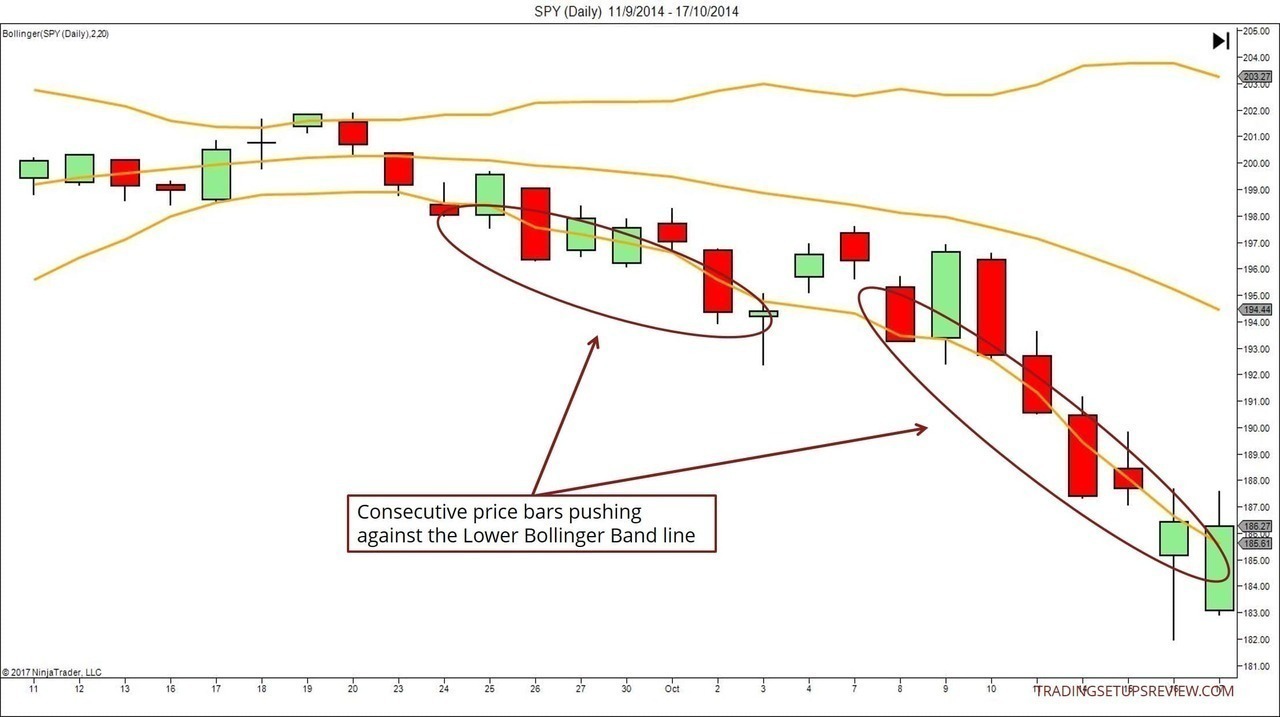
This occurrence comes with an expansion of the Bands.
It is normal to encounter this scenario after a successful price breakout. If you are riding on the surging price swing, you’re in for a rewarding ride.
When you spot the market pushing against the Bollinger Bands, pay attention to whether the candlesticks managed to close beyond the Band. This observation can reveal important clues for assessing the current trend. You will see examples of this in the in-depth examples below.
Basic Strategy
The most straightforward method is to join the breakout as the market breaks out of the Bollinger Bands.
For bullish trades:
- Go long when the price breaks out of the Upper Band Line. (This might take the form of a stop entry order placed at the Line.)
- For a more conservative entry, wait for a price bar to close above the Line before entering the market.
For bearish trades:
- Go short when the price breaks out of the Lower Band Line.
- For a more conservative entry, wait for a price bar to close below the Line before entering the market.
In a sideways market, this trading method might lead to many whipsaws. This is why you should consider the conservative entry when you need more confirmation.
For more examples of using Bollinger Bands for breakouts, look at this trading strategy. It uses the MACD and the Bollinger Bands with a shorter period to find breakout trades.
Scenario #3: A price bar forming entirely beyond the Bands (Outlier Bar)
John Bollinger designed the Bands to contain most price action under normal market circumstances.
Hence, an outlier bar completely beyond the Bands is rare.
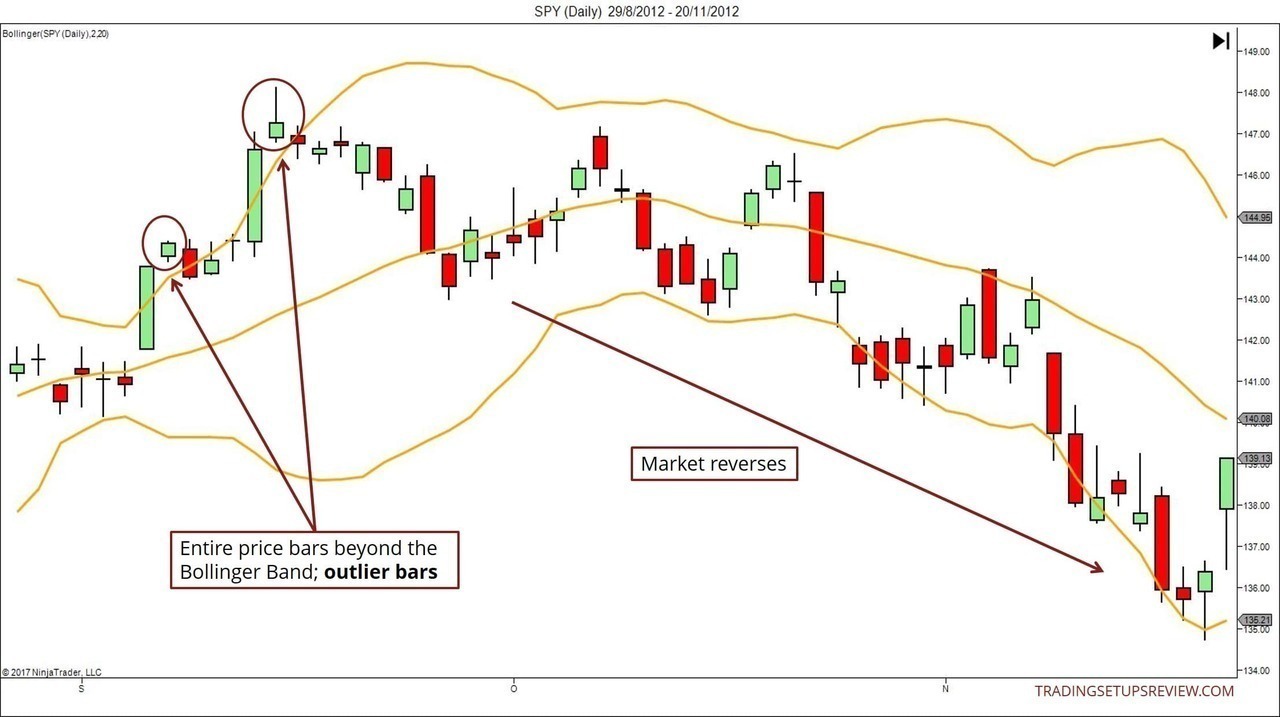
Critically, this formation is also unsustainable.
Prices cannot stay beyond the Bollinger Bands for long. The market will soon snap back within the Bollinger Bands, and this snapback reaction will take the form of a reversal or retracement.
Basic Strategy
If you are a reversal trader, you should pay attention to outliers bars.
As long as a price bar forms entirely beyond the Bollinger Bands, it is an outlier bar. It does not matter if the outlier bar is bullish or bearish.
For bullish trades:
- When you find an outlier bar below the Bollinger Bands, consider a bullish reversal setup.
For bearish trades:
- When you see an outlier bar above the Bollinger Bands, consider a bearish reversal trade.
But as with any other trend reversal signal, you should not give it too much weight in isolation. Take a reversal setup only if you find supporting signals.
For instance, look for a volume surge that implies a weak market ready to reverse. Many cases of price leaping beyond the Bollinger Bands are also exhaustion gaps. Hence, you can apply the same rules of analysis you use for trading exhaustion gaps.
Note: If the market does not resist an outlier bar, it might be a sign of strong momentum in the outlier bar thrust’s direction. Refer to Example #2 in the next section.
For Taking Profits
An outlier bar is not just helpful for trading reversals. It is also an excellent tool for profit-taking.
Let’s say you’ve managed to catch a bullish breakout and are in a long position. An outlier bar above the Bollinger Bands gives you a strong reason to take your profits.
Even if the market does not reverse, it is likely to move sideways. Hence, even if you think that the market will not reverse, it’s wise to exit the market with an outlier bar. After that, you can likely re-enter at a better price.
In-Depth Examples
In this section, we will go through in-depth examples that present a combination of the above scenarios.
Example #1: Breakout Followed by Faltering Trend
This example shows the 4-hour chart of the USDJPY spot forex market.
It is a textbook example of how you can spot a faltering trend with Bollinger Bands. (Focus on Point #4 to #6 below.)
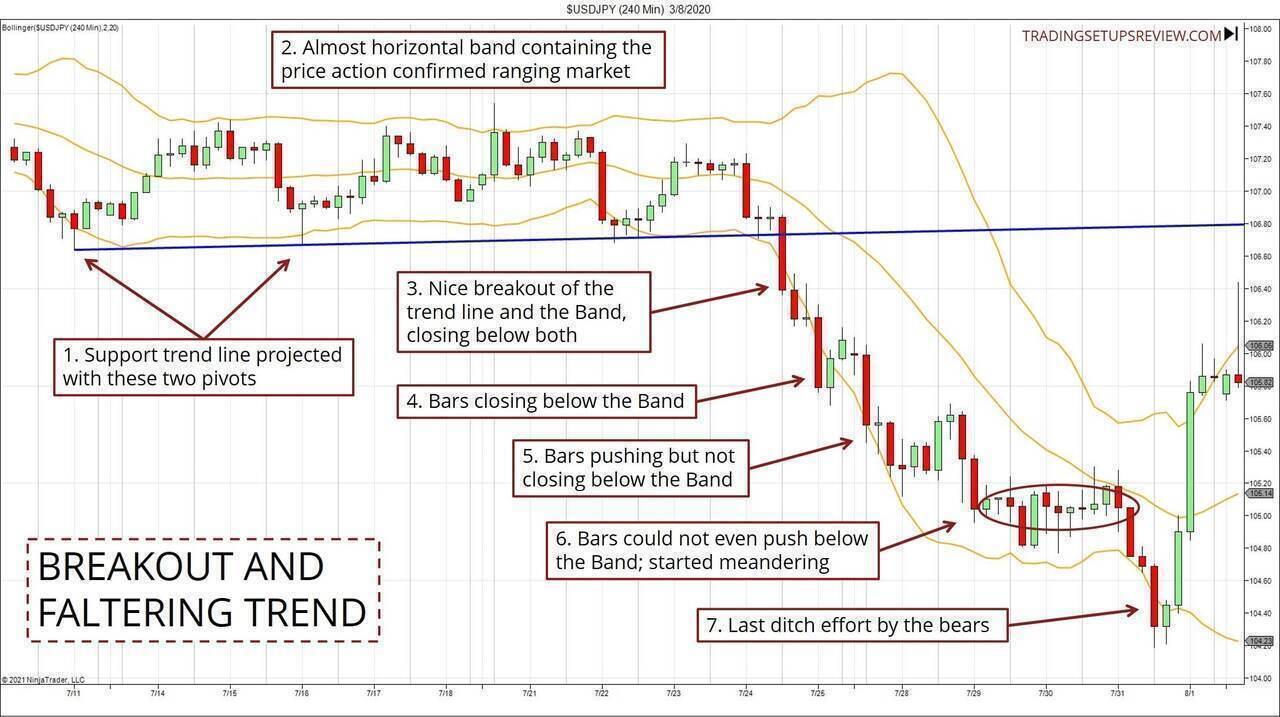
- With these two pivots, we projected a shallow trend line as a support line. (Drawn according to the rules in Volume 2 of my course.)
- The almost horizontal Band contained most of the price action in this period. Thus, the sideways market was apparent.
- This candlestick closed below both the trend line and the Lower Band Line. It offered a solid bearish breakout trade.
- The market followed through with the breakout momentum. Observe how the candlesticks closed below the Band as it pushed lower.
- However, the next push to a new trend extreme was weaker. Despite overlapping with the Lower Band Line, the candlesticks could not close below it.
- The next push was even weaker. Despite pushing to a new low, the candlesticks stayed within the Band completely, forming a congestion zone. At this point, a conservative trader in a bearish position would have taken profits.
- This final thrust represented a last-ditch effort by the bears.
This example illustrates the power of using Bollinger Bands to interpret trending markets.
By observing how the candlesticks interact with the Band as the trend progresses, we can gain helpful insights into the trend’s state.
Example #2: Outlier Bar and Telltale Signs
In this example, we will review the market crash early last year (2020).
Similar to Example #1, it shows how the Bollinger Bands identified a possible weakening trend. Moreover, it offers an exciting example of an outlier bar, which prompted a different interpretation.
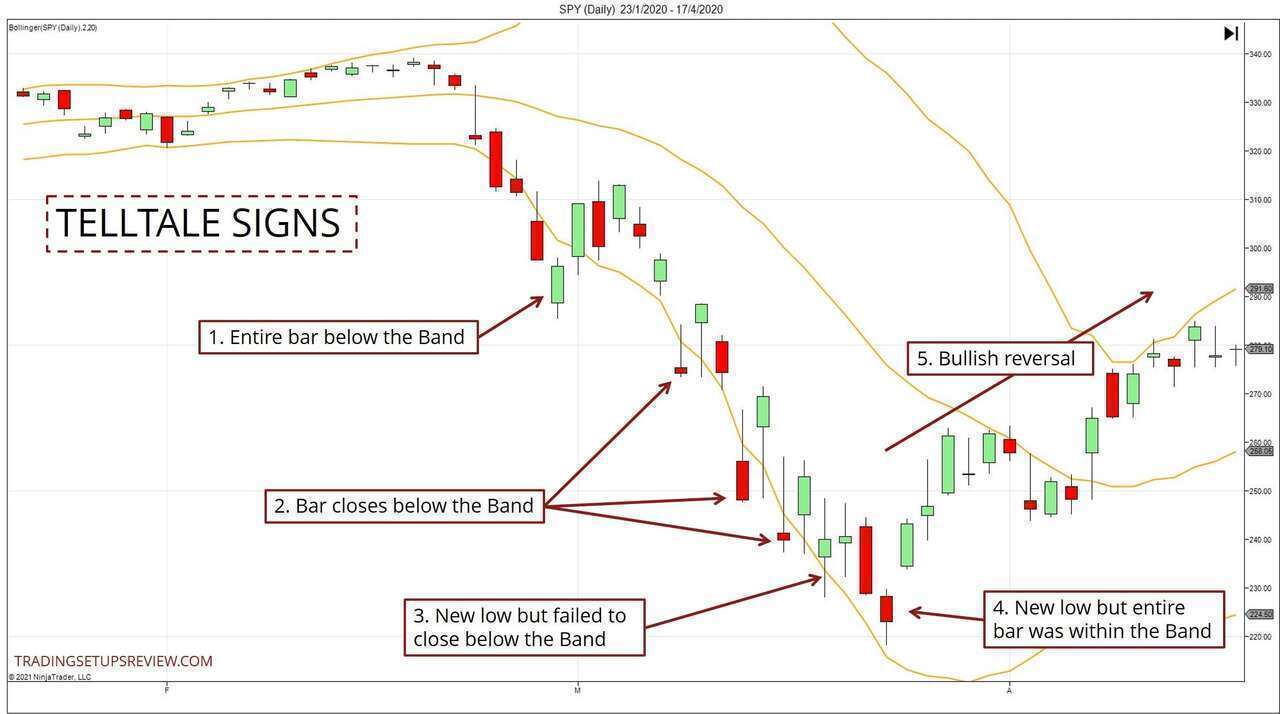
- This candlestick was entirely below the Band and was what we would label as an outlier bar. Typically, an outlier bar represents an unsustainable thrust. However, here, the market quickly resumed pushing past the outlier bar, suggesting powerful bearish forces.
- These candlesticks were instances of the market pushing lower. Moreover, they managed to close below the Bollinger Band each time. They confirmed the strong bearish forces we suspected earlier.
- This was the first candlestick that pushed to a new low but did not close below the Band.
- This candlestick was significant as it stayed entirely within the Band, confirming a weakening trend despite pushing to a new low.
- The above telltale signs of a weakening bear trend precipitated a reversal that led to an enduring bull trend.
Price action analysis involves forming expectations and updating them based on how the market reacts. This line of thought is expressed in Point #1 regarding the outlier bar:
- When we spotted the bearish outlier bar, we expect the market to snap back bullishly or at least meander around before resuming the fall.
- However, after a short pullback, the market swiftly pushed to a new low.
- We updated our market outlook to expect strong bearishness.
Conclusion: Reading Price Action With Bollinger Bands
The traditional price action framework uses support & resistance and price swings for context. As a result, price volatility is often ignored.
But with Bollinger Bands, you can recover this neglected aspect in your price analysis. You can read price action within the context of its past volatility.
In the hands of a skilled trader, this simple envelope adds depth to price action analysis.
(For another volatility-based price envelope, check out the Keltner Bands. It is like the Bollinger Bands. But it uses average true range instead of standard deviation as the volatility measure.)
The article was first published on 27 January 2017 and updated on 18 February 2021.