This website or its third-party tools use cookies which are necessary to its functioning and required to improve your experience. By clicking the consent button, you agree to allow the site to use, collect and/or store cookies.
Please click the consent button to view this website.
I accept
Deny cookies Go Back
  • Price Action Trading Course
  • Trading Setups
  • Topics ↓
    • Price Action Trading
    • Day Trading
    • Trader Development
    • Site Map
  • TSR Trading Guides
  • Resources
    • Udemy Trading Course
    • Trading Books
    • Trading Indicators
    • Forex Tester 4
    • NinjaTrader & Kinetick
  • Member Login

Trading Setups Review

Trading Strategies, Guides, and Articles for Active Technical Traders

You are here: Home / Trading Setups / Moving Average Channel Day Trade

Moving Average Channel Day Trade

By Galen Woods in Trading Setups on February 26, 2012

This day trading setup by Jake Bernstein uses a moving average channel to figure out trend and key support and resistance levels. For our review, we will build a moving average channel with a 20-period SMA of highs and lows.

(Read: Displaced Moving Average Channel Trading Strategy)

Trading Rules – Moving Average Channel Day Trade

Long Day Trade

  1. Wait for two consecutive bars to move entirely above the high of the channel
  2. Buy as price tests the 20 SMA of lows (more aggressive traders can buy on test of 20 SMA of highs)

Short Day Trade

  1. Wait for two consecutive bars to move entirely below the low of the channel
  2. Short as price tests the 20 SMA of highs (more aggressive traders can sell on test of 20 SMA of lows)

Trading Examples – Moving Average Channel Day Trade

Winning Trade

Moving Average Channel Day Trade Winning Trade

This chart shows a 5-minute chart of ES, the E-mini S&P futures. 
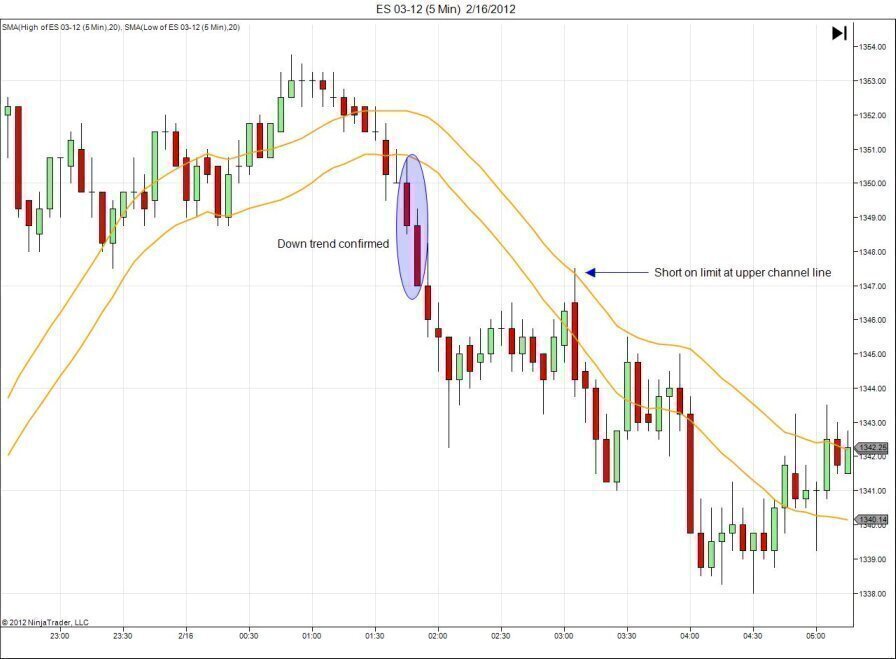
The two circled bars went completely below the moving average channel and confirmed the down trend.

For a conservative trade, we placed a sell limit order at the top of the channel. As prices spiked up to hit the channel top, we entered a short position at 1347.25. Prices continued down until 1338 and gave a profit potential of 9.25 points, while risking almost nothing as the trade went in our direction immediately after we entered.

In this example, the moving average channel highlighted the strong bear spike as price moved beyond the channel. The top channel line gave excellent resistance and minimized our risk. Even if we entered as the bearish outside bar broke the low of the previous bar, it was still a good entry with little adverse movement.

Losing Trade

Moving Average Channel Day Trade Losing Trade

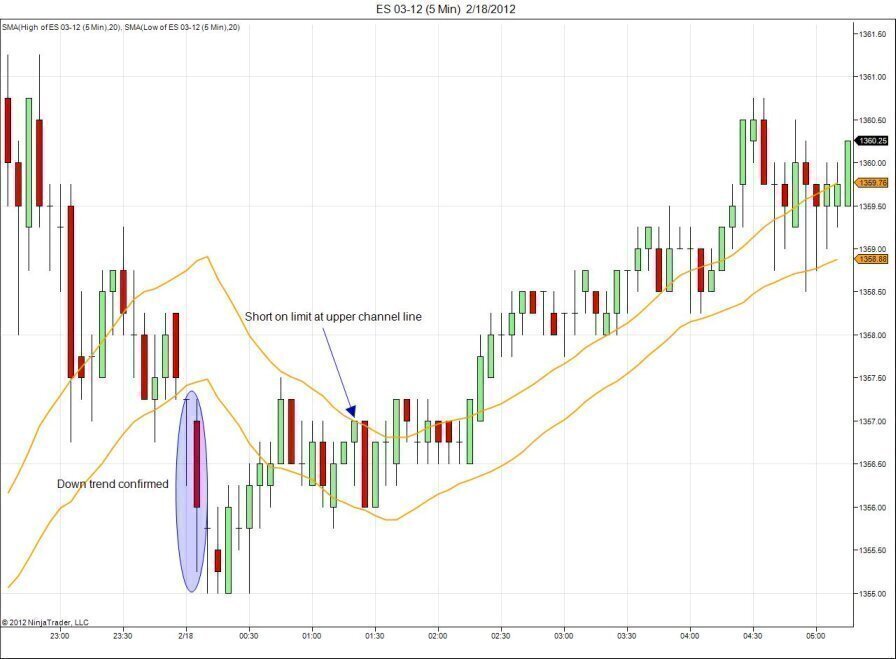
Here, similarly, we had two bars entirely below the channel to confirm the down trend. We then shorted with a limit order at around 1356.75. However, the trade went against us almost immediately and forced out any reasonable stop-loss order.

There were warning signs against taking this trade.

First, the two circled bars were not exactly in free fall with the first bar being a doji and the second bar with a long bottom tail.

Next, right after channel break-out, there was a classic double bottom followed by four consecutive bullish bars. Following that, you could notice that each bearish bar was followed by either a doji or a bullish bar, suggesting that the bears were giving up the fight.

Given this bullish context, we should not take a short trade simply because of the rigid trading rules.

Review – Moving Average Channel Day Trade

This trade setup gives the traditional moving average a useful twist. Using the highs and lows to form moving averages is a sound concept as they are the natural support and resistance levels of each bar. Hence, it behaves nicely as support and resistance.

Requiring two bars to go beyond the channel helps to find spikes and avoid ranging conditions.

A potential pitfall of using this trading setup is over-reliance on the moving average channel for support and resistance. This may cause traders to overlook the real price action unfolding before them.

For more channel surfing action, read 4 ways to trade a channel.

Source: The Compleat Day Trader, Second Edition

Read more about Channel Trading, Day Trading, Moving Average

Serious Traders Only!

Day Trading With Price Action – A complete course that teaches you the art of price action trading.

Perfectly structured with step-by-step guides to help you understand the principles of price action analysis.

Click here for the course syllabus

More From Trading Setups Review

3 Ways To Identify A Trend With A Moving Average

Bulkowski’s Retrace Day Trading Setup

4 Price Action Trading Strategies That Profit From Trapped Traders

Trading Course Banner

Comments

  1. Thant Zin says

    May 24, 2017 at 1:53 AM

    Thanks

    Reply
  2. Daai Man Junior says

    July 13, 2017 at 5:46 PM

    I really relate to Jake Bernstein setup in a technical way, with all do respect this use full information a consecutive trader could most use… Thanks 🙂

    Reply
  3. Arshad says

    September 18, 2020 at 12:23 AM

    Sir, Your price action setups helped me alot in improving my trading. Hope you provide this valuable content. Thank you so much!

    Reply
    • Galen Woods says

      September 18, 2020 at 12:47 PM

      Glad to hear that! All the best for your trading.

      Reply
  4. Onans says

    January 15, 2021 at 6:19 AM

    Thanks for this useful information. However, T. P. and S. L. methods were not mentioned.

    Again, setting a limit order against the SMA High/low seems difficult, as one cannot certainly know where the SMA high/low would be after getting the consecutive two bars. Or are your referring to the SMA high/low already displayed?

    Regards
    Onans

    Reply
    • Galen Woods says

      January 18, 2021 at 11:53 AM

      Hi Onans, for taking profit and setting stop losses, you can check out these two articles for some ideas: profit-taking and volatility stop-loss.

      You are right that it’s a little tricky setting the limit order. To resolve this, you can use the SMA high/low already computed using the last bar. Or if you opt to use the current SMA high/low value, you will need to adjust it a little as it can fluctuate as the current bar pushes lower or higher.

      Reply

Leave a Reply Cancel reply

Your email address will not be published. Required fields are marked *


Search Trading Setups Review

Get a Free Course Chapter from Galen Woods' Day Trading With Price Action Course [PDF]

Plus, our latest trading guides and tips in right your inbox.

Recommended For You

Top 10 Automated Trading Courses On Udemy

The Floor Trader Trading System

Trading The Engulfing Candlestick Pattern With Market Structure

John Hill’s Trend Line Theory – Using Trend Lines for Trading Pullbacks

Trading the Bollinger Band Squeeze

Day Trading With ADX Indicator

Book List For The Chartered Market Technician (CMT)

Trading Course Banner

Trading Setups Review

  • About Us
  • Contact Us
  • Advertise With Us
  • Privacy Policy
  • Affiliate Disclaimer
  • Full Risk Disclosure

Learn More

  • Day Trading With Price Action Course
  • TSR Trading Guides
  • Trading Setups
  • Trading Articles
  • Trading Books
  • Site Map

Futures and forex trading contains substantial risk and is not for every investor. An investor could potentially lose all or more than the initial investment. Risk capital is money that can be lost without jeopardizing ones financial security or life style. Only risk capital should be used for trading and only those with sufficient risk capital should consider trading. Past performance is not necessarily indicative of future results.


The website contents are only for educational purposes. All trades are random examples selected to present the trading setups and are not real trades. All trademarks belong to their respective owners. We are not registered with any regulating body that allows us to give financial and investment advice.


Trading Setups Review © 2012–2021