How To Analyze Price Action With Keltner Channel
By Galen Woods ‐ 5 min read
Learn how to supercharge your price action analysis with the Keltner Channel - a simple tool that uses price volatility for market analysis.
Most traders start analyzing price charts with trading indicators. Giving up indicators to focus on pure price action sounds intimidating.
I have good news for you. You don’t need to remove all your trading indicators to analyze price action. Some indicators, like the Keltner Channel, are valuable price action trading tools.
In this tutorial, you’ll learn how to interpret price action with Keltner Channels.
But first of all, remember this key to using any trading indicator: do not lose sight of price movements.
Bear in mind that our goal here is to understand what the market is up to using price action. The Keltner Channels are here to help us with that, and not to disrupt our focus on price.
What is the Keltner Channel?
Keltner Channels are like Bollinger Bands. It consists of volatility envelopes around a moving average.
But they use different measures of volatility. The Bollinger Bands use the standard deviation. The Keltner Channels use the Average True Range (ATR).
In essence, Keltner Channels provide a volatility context for our price analysis.
If you want a detailed technical explanation of Keltner Channels, refer to this ChartSchool tutorial.
Keltner Channel Analysis Guidelines
For this exercise, we’re using a Keltner Channel with these settings:
- Look-back period: 20
- ATR offset multiplier: 1
To identify trends, focus on bars that move entirely beyond the Keltner Channel.
- Are there price bars completely above or below the channel? (i.e., no overlap)
- How many consecutive price bars form beyond the channel?
- How far away are these bars from the channel?
To classify pullbacks, observe where the pullback terminates.
- Where does the pullback end?
- Does the pullback stop before it reaches the Keltner channel?
- Does the pullback reach the other side of the channel?
To find trading ranges, look for failures to push through flat Keltner Channels.
- Is the channel relatively flat?
- Are attempts to push beyond the channel rejected swiftly?
- Are there repeated failures to move beyond the channel?
Examples - Price Action Analysis With Keltner Channels
As with all trading approaches, the best way to learn is to see it in action.
In this set of examples, we’re looking at 4-hour charts of the forex pair EURUSD.
Example #1 - Trends and Pullbacks
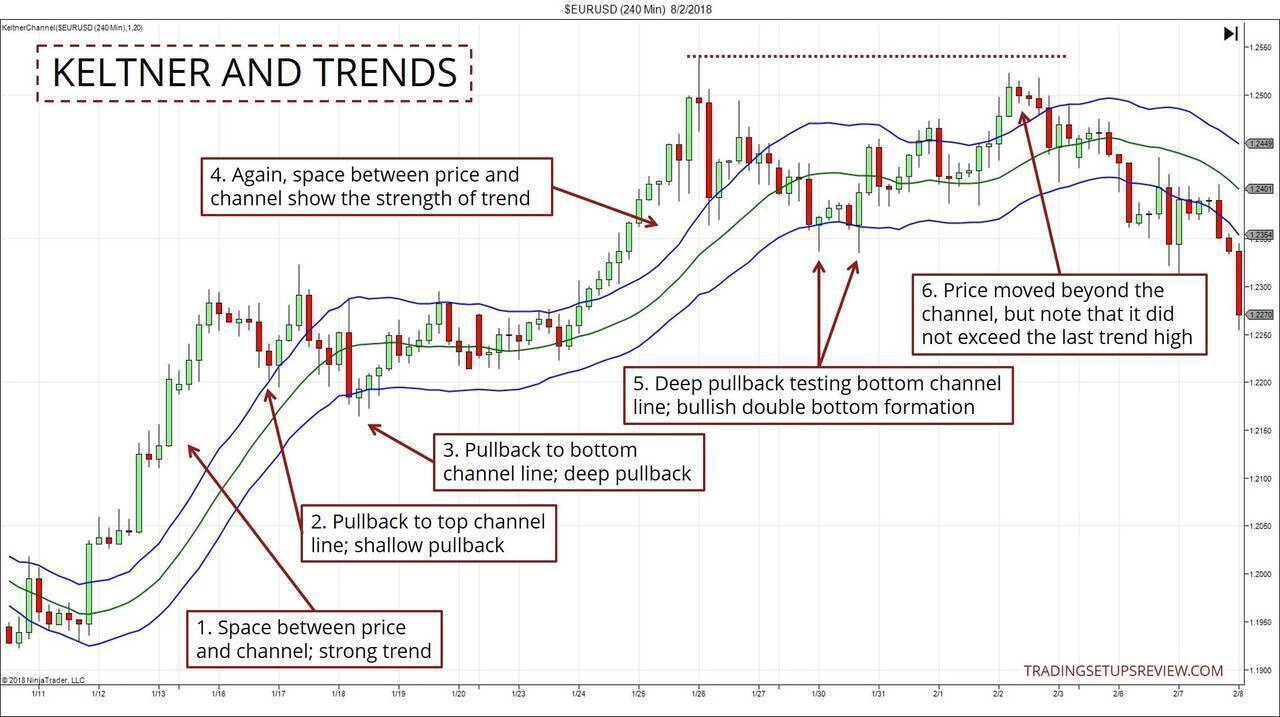
- Look at the white space between the price bars and the Keltner Channel. This series of bars formed entirely above the channel, signaling a strong bull trend.
- When a pullback terminates at the top channel line in a bullish trend, it is a shallow pullback.
- A deep pullback, like this one, terminates at the lower channel line.
- Notice the gap between price action and the channel. The bullish trend has resumed.
- A deep pullback and a bullish double bottom.
- The price bars rose above and beyond the channel again. The rigid indicator trader would think that the bullish trend has resumed. But the astute price action trader would not think so, because the market did not exceed the recent trend extreme (dotted line).
Example #2 - Shallow Versus Deep Pullbacks
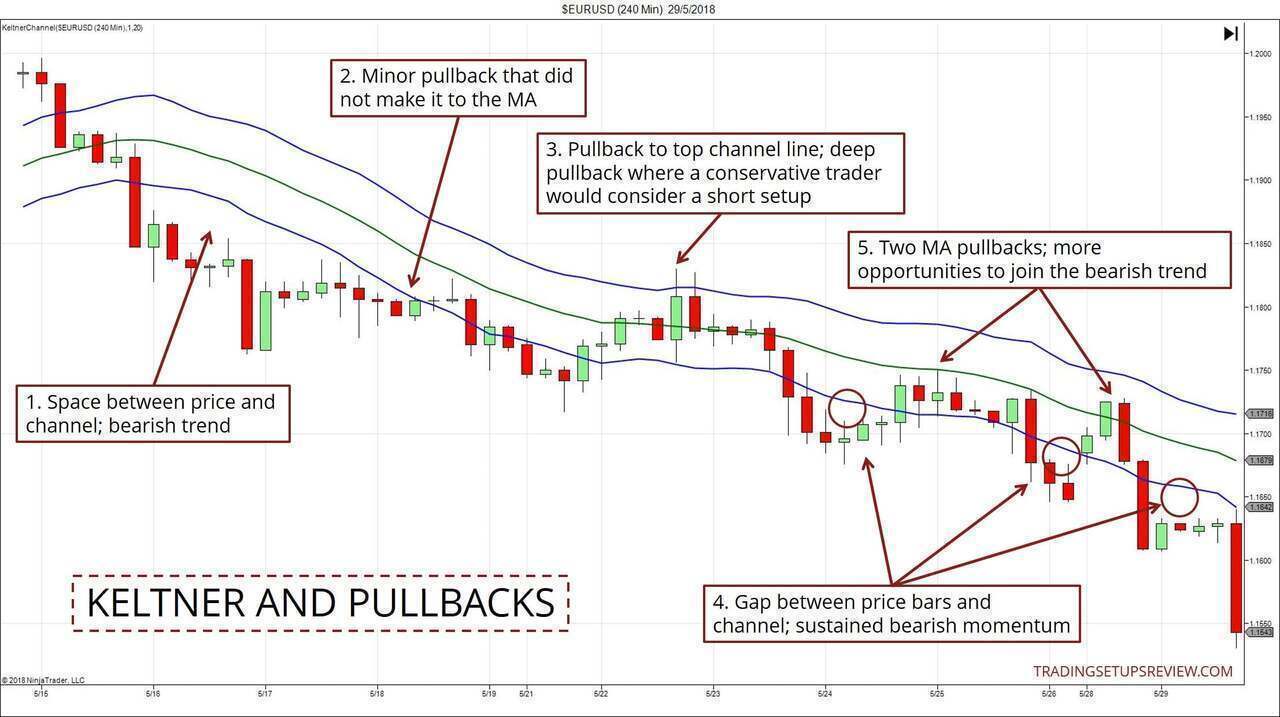
- Prices pushing below the channel signaled a bearish trend.
- A shallow pullback that terminated at the lower channel line.
- A deeper pullback that reached the upper channel line. You could have entered with either the shallow pullback or the deep pullback. It boils down to your confidence in the bearish trend. (E.g., more conservative traders would’ve waited for this deep pullback.)
- Not all trends show long series of consecutive bars beyond the channel. Some trends show up with short but regular bursts beyond the channel.
- These pullbacks to the moving average were potential short entries. (Some traders wanted to see the deep pullback fail before they turn bearish.)
Example #3 - Range Versus Reversal
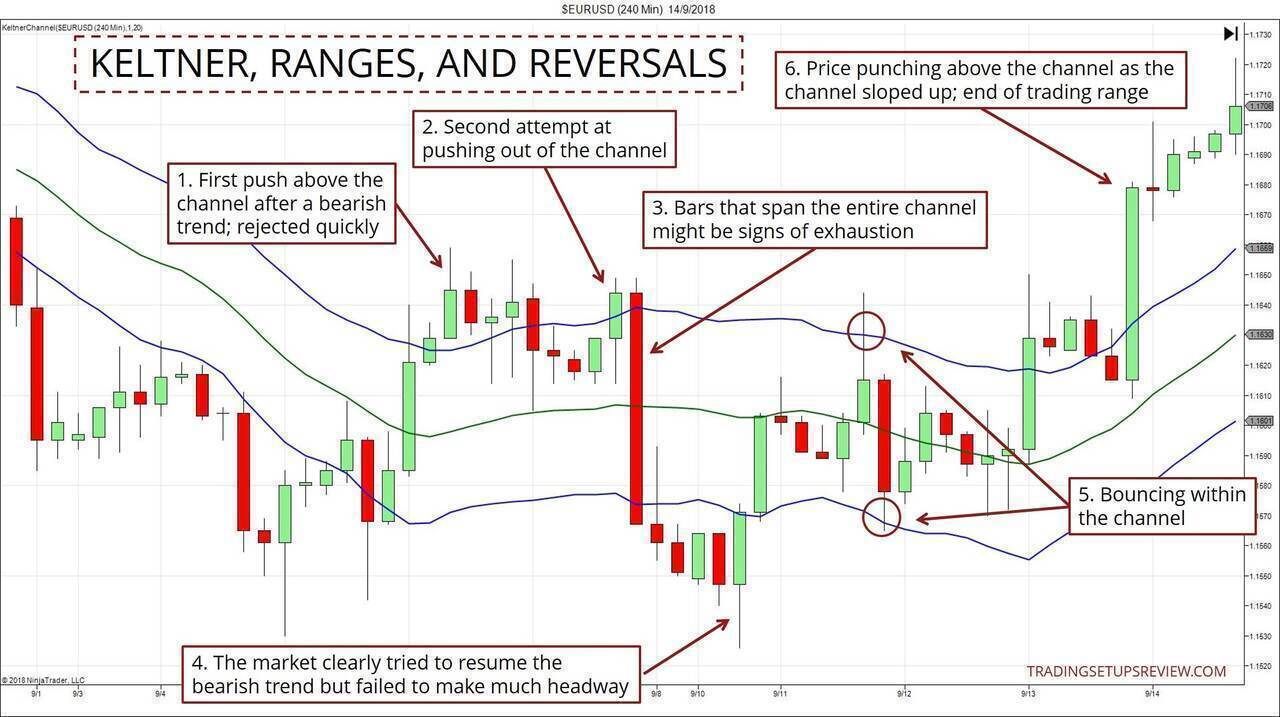
- A weak attempt to push above the channel.
- Second attempt to push above the channel failed. At this point, the bearish trend was likely to resume.
- Watch out for price bars that span the entire channel. Very often, it’s an exhaustive move that you should fade rather than follow. (Refer to point 3 of Example #1 for another instance of such a formation.)
- The market did push to a lower trend extreme but was rejected swiftly. At this point, the chances of a ranging market or a bullish reversal increased.
- A relatively flat Keltner Channel implied a trading range. The channel was effective at containing price action in a sideways market. These were potential scalp trades.
- This price bar confirmed that the trading range had been broken. It punched up beyond the upwards sloping Keltner Channel. Most traders would confirm a bullish reversal here.
Conclusion
I’m not trying to present the Keltner Channel as a miracle tool.
The examples above do not show perfect entries and exits. They aim to show how to augment price analysis with a simple indicator.
With a simple channel, you can define trends, assess pullbacks, and find trading ranges. It’s much better than describing price action with meaningless subjective labels.
Of course, you can also design an analytical framework with price action alone. (That’s what I cover in my course.)
But the main message is this. There’s nothing wrong with using indicators, as long as you’re using them to clarify, and not obscure, your market analysis.