How To Track Price Swings And Market Structure With Moving Averages
By Galen Woods ‐ 8 min read
Tracking price swings to determine the market structure is the first and most critical step for effective price action analysis. Learn how to do it.
Load a price chart with a sufficient number of candlesticks. You will find that the market rarely moves in a straight line. The market moves in waves or swings, which form the basis for mapping out the market structure.
Market structure is a cornerstone of price action trading. First, you need to analyze the market and its turning points (i.e., swings). Then, you can use it as a foundation for in-depth price analysis.
By observing price swings, you can look out for patterns that reveal the market bias. For instance, higher swing highs and higher swing lows are features of a bullish market. Furthermore, price action swings also form the building blocks for chart patterns. (E.g., head and shoulders)
Market analysis is subjective. Every trader perceives swings of different degrees from the same price chart.
- It is not a problem if your market analysis differs from other traders.
- But you have a huge problem if your analytical framework contradicts itself.
Hence, you need to pay attention to the consistency of your analytical tools. You need a well-defined method to identify market turning points. (These turning points determine where a price swing starts and ends.)
If you don’t have a systematic way to interpret the market structure, don’t fret. In this guide, you’ll learn three simple methods to determine price swings.
- Hull Moving Average
- Typical Price Moving Average
- Simple Moving Average
Moving Averages And Price Swings
Price action is the ultimate basis for determining the market structure.
However, completely discarding indicators is intimidating for new traders. Hence, for each technique here, you’ll make use of a moving average to help clarify price swings.
Moving average is the ideal tool for illuminating price swings. It is intuitive and straightforward, and it plots directly over price.
If you’re interested in tracking swings with pure price action, check out my course.
But for now, let’s learn to make the most out of moving averages.
Method #1: Hull Moving Average
Alan Hull designed the Hull Moving Average (HMA) to minimize lag and maintain a smoothed MA. Hence, the HMA is well-suited for tracking price swings.
How To Identify Price Swings With The HMA
Apply a 14-period HMA on your chart. (If you prefer a smoother plot, increase your lookback period to 21.)
Track swings using the slope of the HMA.
- When the HMA is sloping upwards, the market is in an upswing.
- When the HMA is sloping downwards, the market is in a downswing.
HMA Price Swing Example
The HMA in the chart below changes color according to its slope.
It turns green when its values are rising and turns red when it is falling.
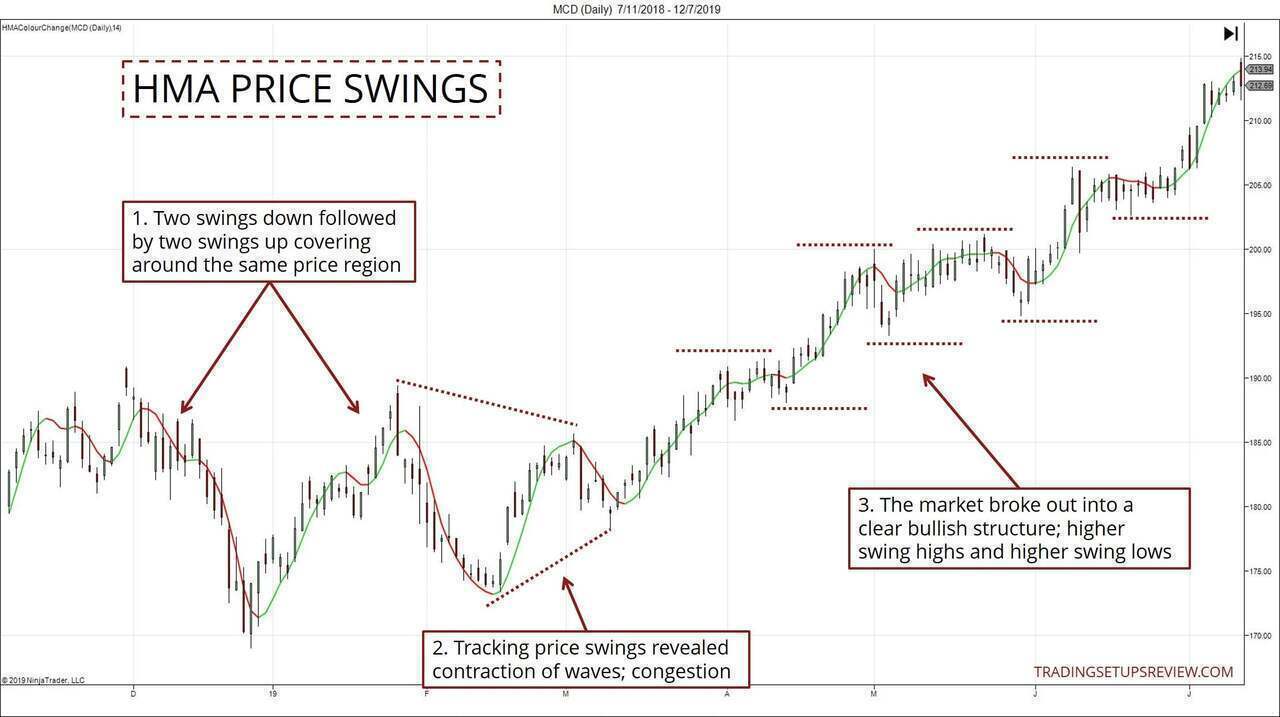
- According to the HMA, the market pushed down with two swings before rising with another two swings. The key here was that these two sets of swings covered the same price region. Hence, the market might be congesting.
- A lower swing high with a higher swing low marks a contracting market. This tightening of price action affirmed the congestion.
- The market then broke out of the congestion and established a bullish structure. In a rising market, you’d expect to see a series of higher highs and higher lows.
Having a systematic way to determine price swings is helpful. It gives you a way to describe and understand the market.
With experience, you can also rely on the market swings to locate trading setups. For instance, wait for the market to phase into a bullish trend. Then, consider an entry as the HMA turns up, indicating the start of an upswing.
If you’re interested in HMA trading, check these out:
Method #2: Typical Price Moving Average
The typical price is the average of a candlestick’s high, low, and closing prices. Hence, you can consider the typical price as a single price representation of a candlestick.
Various trading tools and techniques make use of the typical price. A well-known example is the CCI indicator.
The Drummond Geometry framework also features the typical price. The 3-period moving average here is adapted from the Drummond Geometry framework.
How To Identify Price Swings With The Typical Price MA
Our approach here is the same as the HMA method. The only difference is the moving average we are using.
- Apply a 3-period simple moving average of the typical price.
- The default input for calculating moving averages is the closing price. You’ll need to change that to the typical price.
- The direction of the typical price MA determines the price swings.
Typical Price MA Swing Example
Chart patterns rely on your observation of swing highs and lows. To trade chart patterns consistently, you need a framework for determining price swings.
This example shows how the typical price MA swings can help to identify a head and shoulders pattern.
(Again, the MA below changes color according to its slope.)
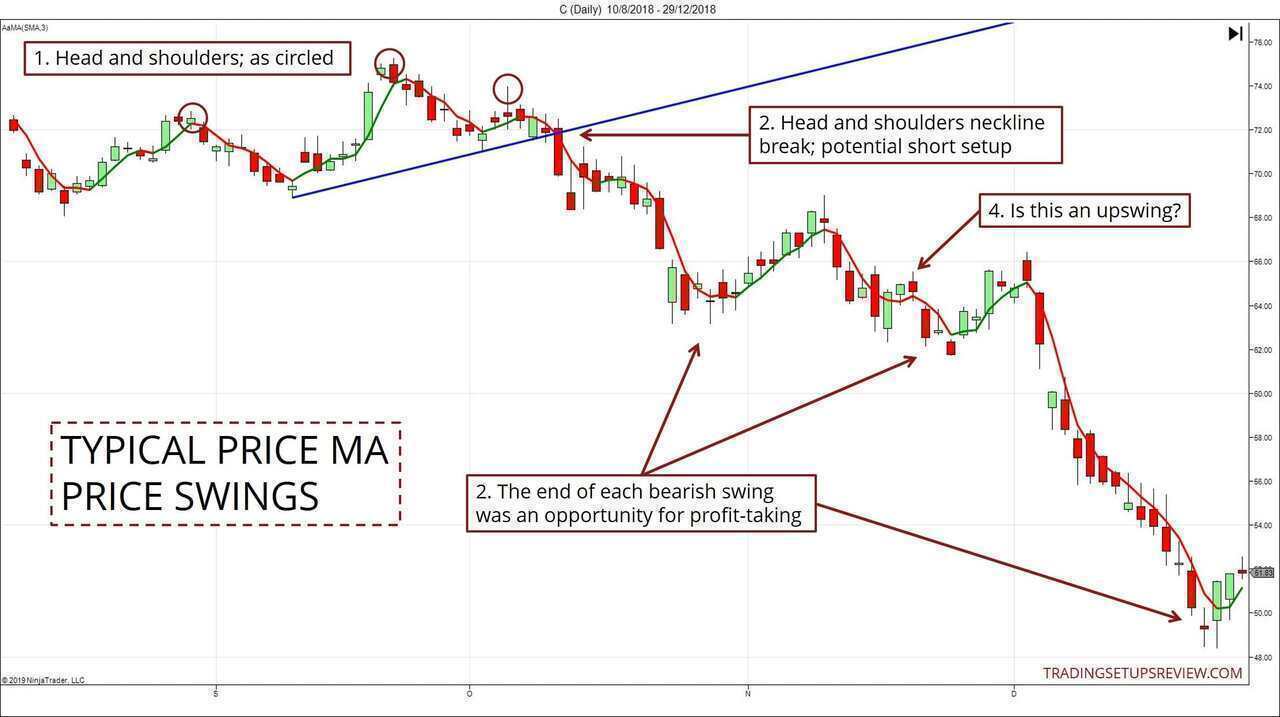
- The head and two shoulders of the Head and Shoulders pattern are circled here. With the MA marking the market swings clearly, it’s easy to spot a Head and Shoulder pattern like this one.
- This break of the pattern neckline was a potential short setup.
- Continue to track the price swings after the neckline break. The end of each bearish swing was a potential profit-taking point.
- The typical price MA sloped up for a single bar at this point. As this change was short-lived, the color change was obscured. Nonetheless, the MA did slope up momentarily here.
In such instances, you need to decide if you want to recognize an upswing here. While there’s no right or wrong answer, you need to settle on a consistent framework to avoid confusion.
Method #3: Simple Moving Average
The simple moving average (SMA) is a standard tool that needs no introduction.
In the examples that follow, you’ll learn a simple SMA method to define price swings.
How To Identify Price Swings With The SMA
The first two methods above depend on the slope of the moving averages.
But here, we will deviate from that approach. Our focus here is on observing how price action interacts with the SMA.
- Apply a 20-period SMA.
- When a candlestick forms entirely above the SMA, an upswing is confirmed.
- When a candlestick forms entirely below the SMA, a downswing is confirmed.
As this technique is move involved than just relying on the MA slope, let’s run through a chart. The example below points to the key bars that confirmed a change in the swing direction.
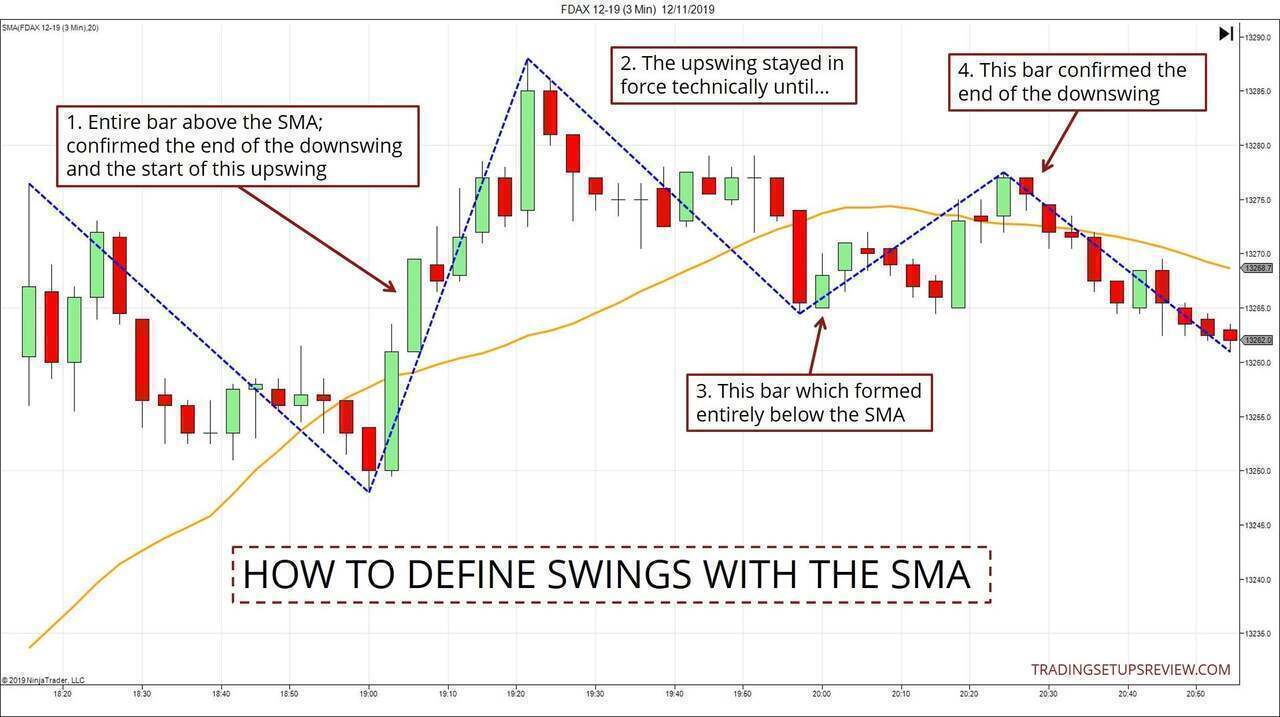
As you can see, this method lags the most. It registers a change in the market swing direction only when an entire bar forms on the other side of the SMA.
In particular, look at Point #4 in the chart above. We only confirmed the start of the upswing (end of downswing) just as the upswing came to an end.
While this technique is less responsive, it marks out the main moves in the market and is helpful for macro bias analysis.
SMA Price Swing Example
For better visuals, I’ve marked out the price swings (in blue) as defined by the SMA.
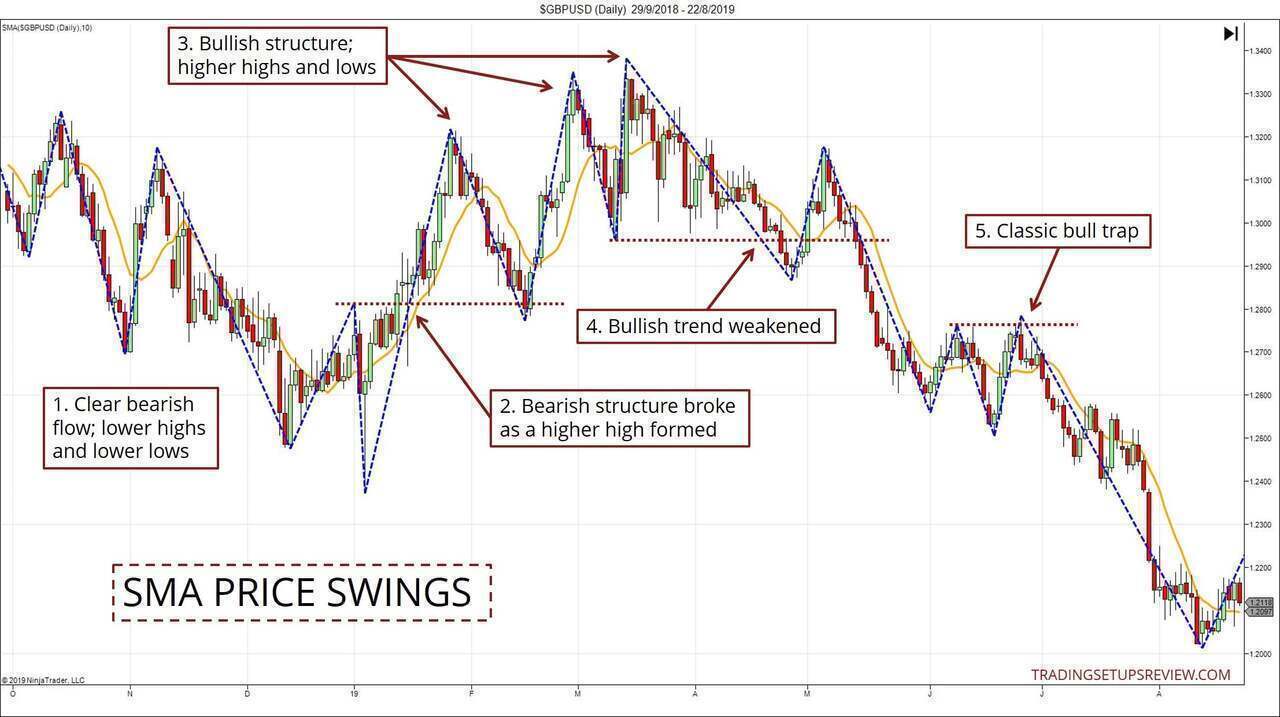
- On the left-hand side of the chart, lower lows and lower highs established a bearish market structure.
- But that structure broke at this point as the market rose up above the last swing high. Look at the bullish Pin Bar that started this upswing. It reflected powerful buying pressure that stopped the market from pushing lower.
- The market continued with three upswings to mark a bullish bias.
- The market broke below the last swing low at this point, signaling a weakening of the bullish trend.
- As a bearish structure unfolded, the swings helped to highlight a classic bull trap. The market rose briefly above the last swing high before snapping back down. It presented a short trading setup.
As you can see, this method is less suited for finding exact entry points. But it is effective at:
- Tracking the market bias
- Pointing out vital support and resistance levels
And when it does produce setups (like the bull trap above), it is more significant than setups made up of smaller, erratic swings.
Which Is The Best Method For Tracking Price Swings?
Wrong question.
Instead of finding the best method, we should focus on understanding the pros and cons of each one. Only by doing so can we design trading plans that integrate well with them.
- The HMA does well when the market is moving in nice and smooth waves.
- The typical price moving average is superior for tracking choppier price action.
- The SMA approach is most useful for big-picture analysis. Due to its lag, it is not as helpful for pinpointing entries. Of course, this lagging attribute is a result of our lookback period. So feel free to experiment and apply the same technique with faster SMAs.
If you have one takeaway from this article, let it not be any specific method.
Let it be the importance of having a consistent framework to define price swings.
This is critical. To develop your discretionary trading skills, you must practice with a consistent framework. Without an objective way to understand the market structure, honing your skills is impossible.
Can We Use Pure Price Action To Define The Market Structure?
Yes, you can. In my trading course, we rely on pure price action to define the market structure.
In the course, you’ll learn how to use bar highs and lows to define swings. You’ll also learn how to classify swings and how to link them up to form trend lines. This systematic process will strengthen your price action analytical skills.
But is pure price action the only correct way to map out the market structure?
No, it is not.
I know traders who use moving averages and other tools to decipher the market. And they manage to build robust trading systems as well.
Remember, consistency is the key.