10 Pullback Trading Strategies You Must Know
By Galen Woods ‐ 8 min read
Pullback trading aligns you with the trend and places the odds in your favor. Learn 10 practical pullback trading strategies to propel your performance.
Pullback trading is a perennial favourite among both new and seasoned traders. And it’s not surprising as looking for pullbacks ensures that you align yourself with the market. On top of that, it also allows for a superior reward-to-risk ratio.
In this article, you’ll find ten handpicked pullback trading strategies.
You might be thinking - Do I need ten trading strategies to profit from pullbacks?
No, definitely not.
But you might find that some strategies appeal to you more than others. And this depends on the tools you’re familiar with and your market inclinations. Hence, getting a sense of the varied approaches is beneficial for any pullback trader.
The chosen strategies are offer diversity and fall (more or less) evenly into three categories.
- Price Action and Lines
- Moving Averages
- Other Indicators
We are aiming for an overview here. Hence, for each strategy, we will explain its basic idea, followed by a short example.
So be sure to visit the link to the respective strategy guides for detailed rules and more trading examples.
Price Action and Lines
If you want to avoid indicators altogether and focus on price action, pay attention here.
The three strategies in this section use trend lines, channels, and retracement lines. In a nutshell, we’ll find pullbacks by drawing lines on our charts.
Strategy #1: Pullback Trading With Trend Lines and Channels
If you like the simplicity of price action, this strategy will appeal to you.
In this method, you use a trend line to define the significant trend. Then, you draw a channel to identify oversold (overbought) conditions for your entry.
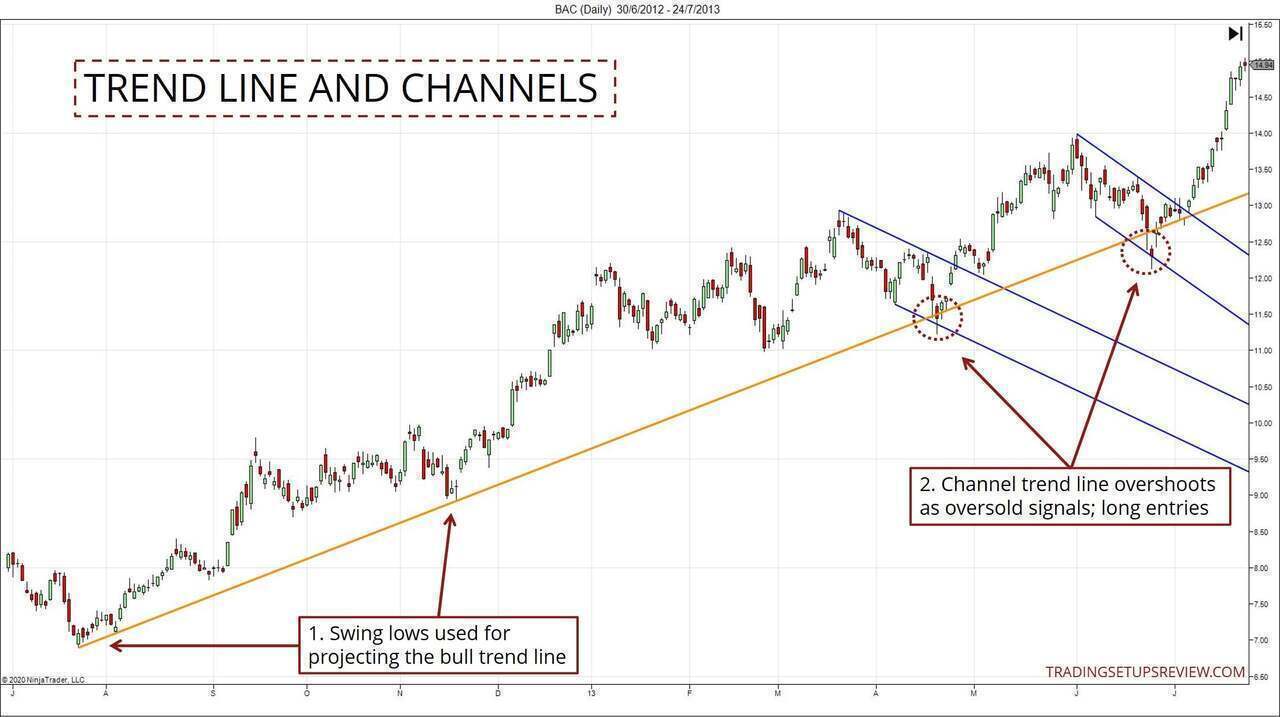
- With these two swing lows, we drew a trend line to track the bullish market.
- These overshoots of the bearish channels are oversold signals. Here, they act as pullback entries.
For more examples, refer to this guide.
Strategy #2: John Hill’s Trend Line Method
This pullback strategy from John Hill is unique in the way it uses trend lines.
It uses the slope of trend lines to judge the momentum during a retracement. Shallow lines mean weaker momentum, and steep lines point to strong momentum.
By doing so, it enters only those with faltering counter-trend strength.
You will find that this strategy applies only in cases of complex pullbacks.
For diagrams explaining how this strategy works, refer to this guide.
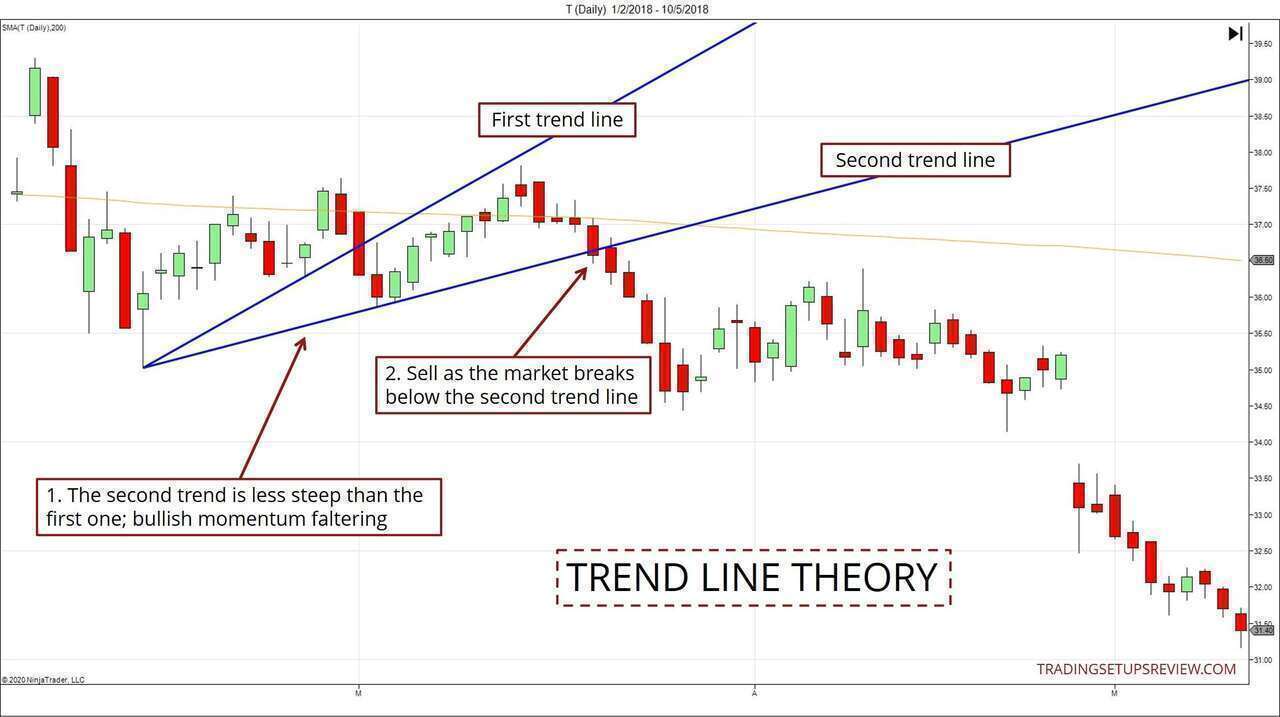
- During a pullback, draw two trend lines with the trend extreme (low) as the origin. Here, the second trend line was shallower, indicating that bullish momentum was weakening.
- Under this premise, a pullback entry was possible as the market broke the second trend line.
Strategy #3: Pullback To 50% Retracement
This strategy uses the 50% retracement of a price thrust as a support or resistance.
- First, identify a significant price thrust.
- Then, project a retracement zone (50% to 61.8%) and wait for the market to retrace into the area.
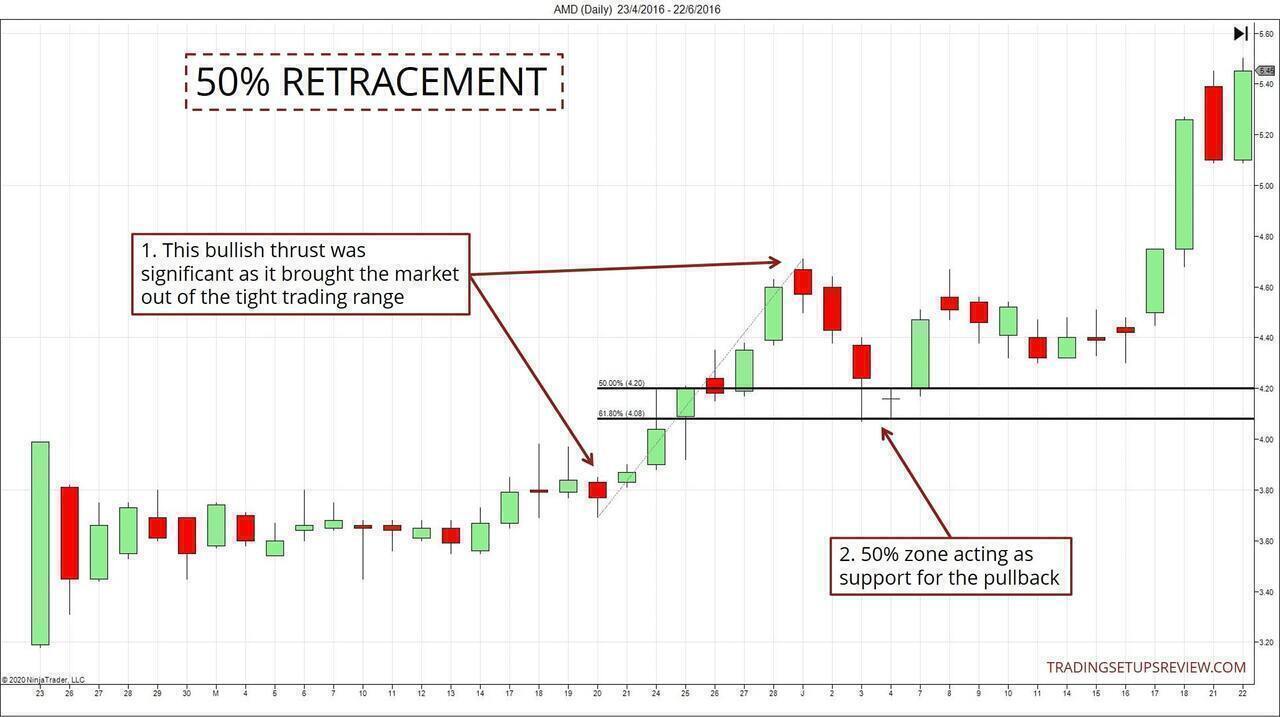
- The choice of the thrust is critical for this retracement strategy to work. In this example, the thrust was significant as it broke the prolonged tight trading range.
- With that thrust, we highlighted the 50% retracement zone. The market pulled back down and found support within the zone. One way to enter the market is to place buy limit orders within the area.
Moving Averages
Moving averages offer a high return-on-investment for a minimalist trader.
A moving average is simple to understand and serves multiple purposes for traders. A moving average can track trends and pinpoint entries.
Hence, you often see moving averages in simple pullback trading strategies. Here, we will go through four approaches that take advantage of this elegant trading tool.
The first two strategies use one moving average, while the other two use two moving averages.
Strategy #4: Candlestick with Moving Average
In this method, you’ll use the moving average as a support (resistance) zone. If you are already familiar with candlesticks, this strategy is straightforward.
We need two ingredients:
- The market pulls back to the moving average.
- The market forms a candlestick pattern.
Some candlestick traders haphazardly look for patterns and entries. This strategy avoids that problem as it offers a disciplined approach to trading candlestick patterns.
You will not need to search for candlestick patterns all the time. You look for them only when the market pulls back to the moving average.
Let’s look at an example below.
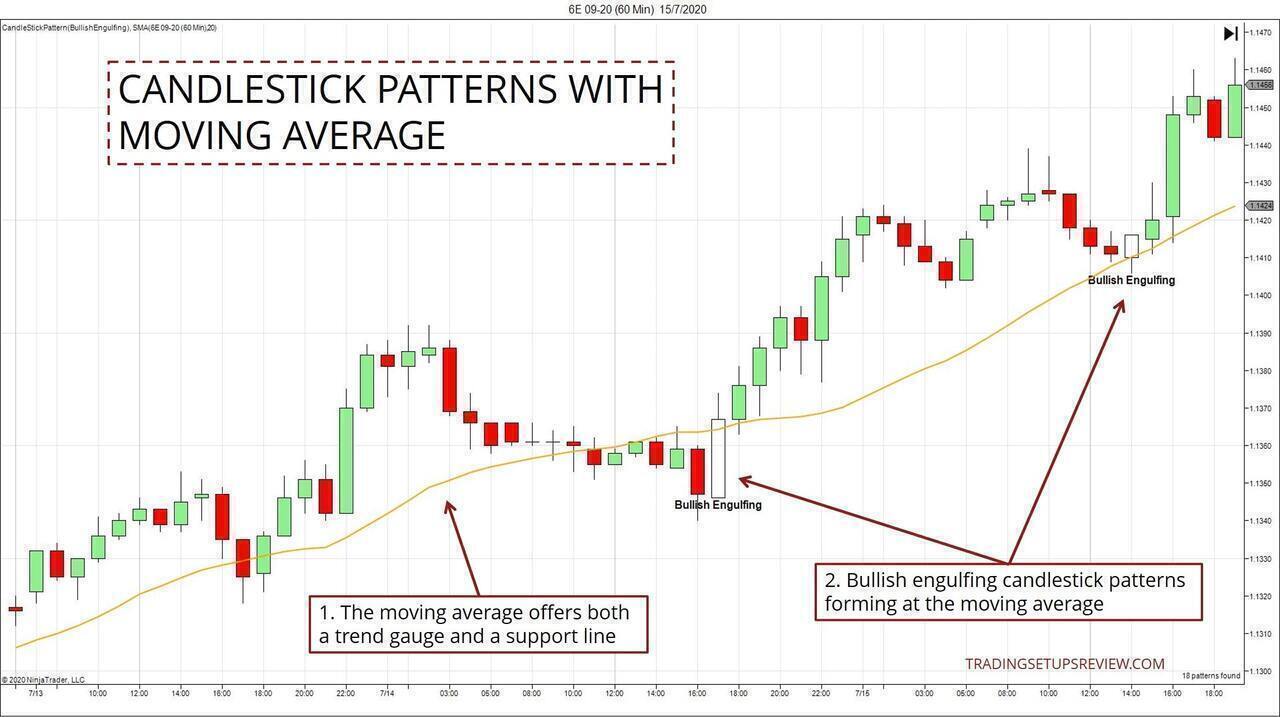
- The moving average tracks the bullish trend and offers a support zone.
- The confluence of the Engulfing patterns and the moving average point to reliable pullback entries.
Strategy #5: Two-Legged Pullback to the Moving Average
Al Brooks popularized this setup (M2B, M2S) in his series of price action books.
Like Strategy #4, it assumes that the moving average will support the trend. But instead a specific bar or candlestick pattern, it looks for a two-legged pullback.
The chart below shows how a two-legged pullback looks like.
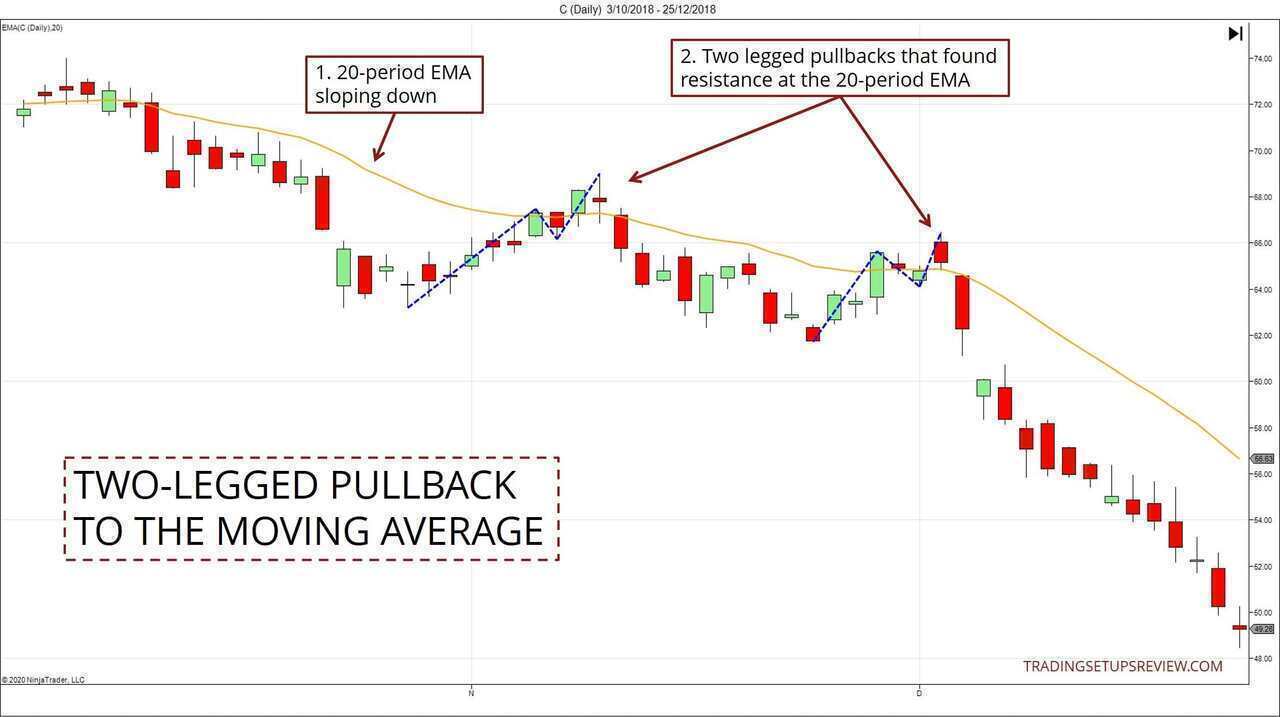
- This strategy uses a 20-period exponential moving average. When the market generally stays below the moving average, we start looking for two-legged pullbacks upwards.
- These are two instances of two-legged pullbacks to the moving average. The price legs are marked.
For this approach, traders look to enter a pullback trade at the end of the second leg.
Strategy #6: Weighted MA with Hull MA
This fascinating dual moving average strategy originates from a popular trading forum thread.
It uses two moving averages:
- A long-term weighted moving average to track the market bias.
- A Hull moving average to track price waves.
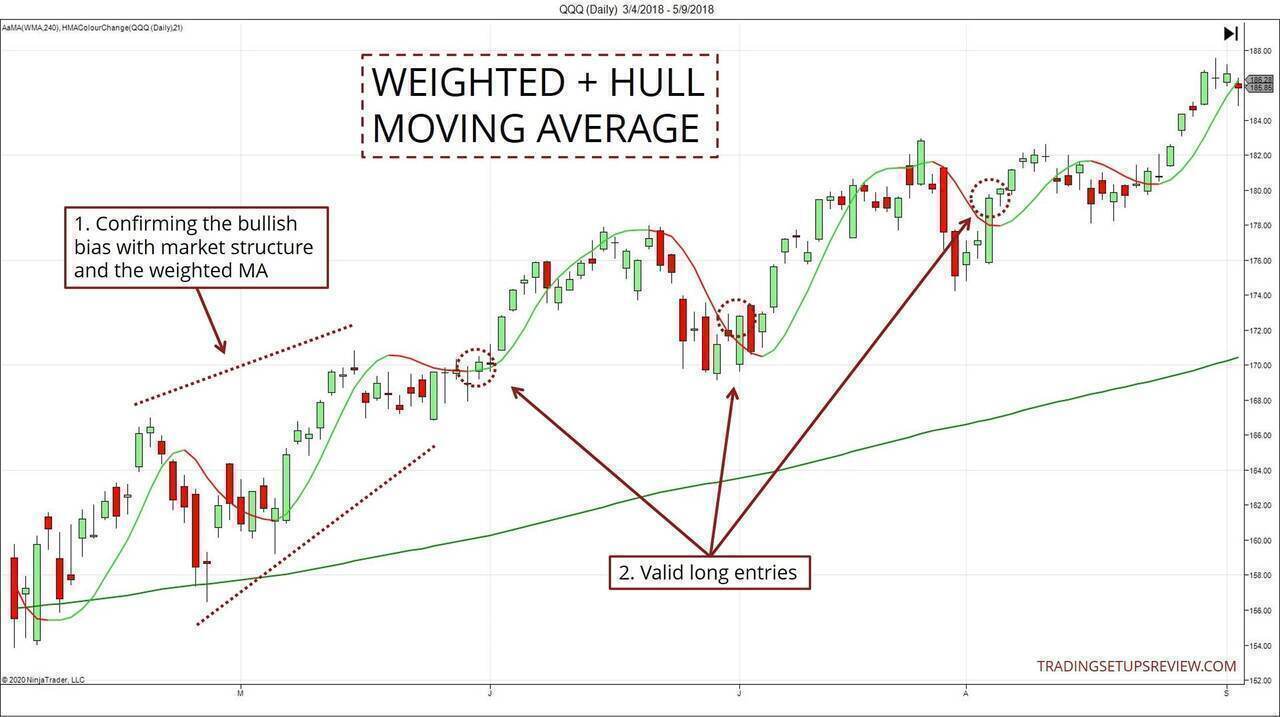
- We consider only setups in the direction of the weighted moving average. The higher high and higher low affirms a bullish market structure.
- Each close above the Hull moving average after a pullback offers a long entry. (Provided that the bullish market bias is still in place.)
To learn more about this strategy, refer to this guide.
Strategy #7: 9/30 Trading Setup
The 9/30 setup is often recommended for new traders as it is easy to understand.
The two moving averages in this strategy are:
- 9-period EMA
- 30-period WMA
It uses moving average crossovers to define the current market trend.
Then, depending on the price action relative to the moving averages, it allows for aggressive or conservative entries.
The chart below shows one aggressive entry followed by a conservative one.
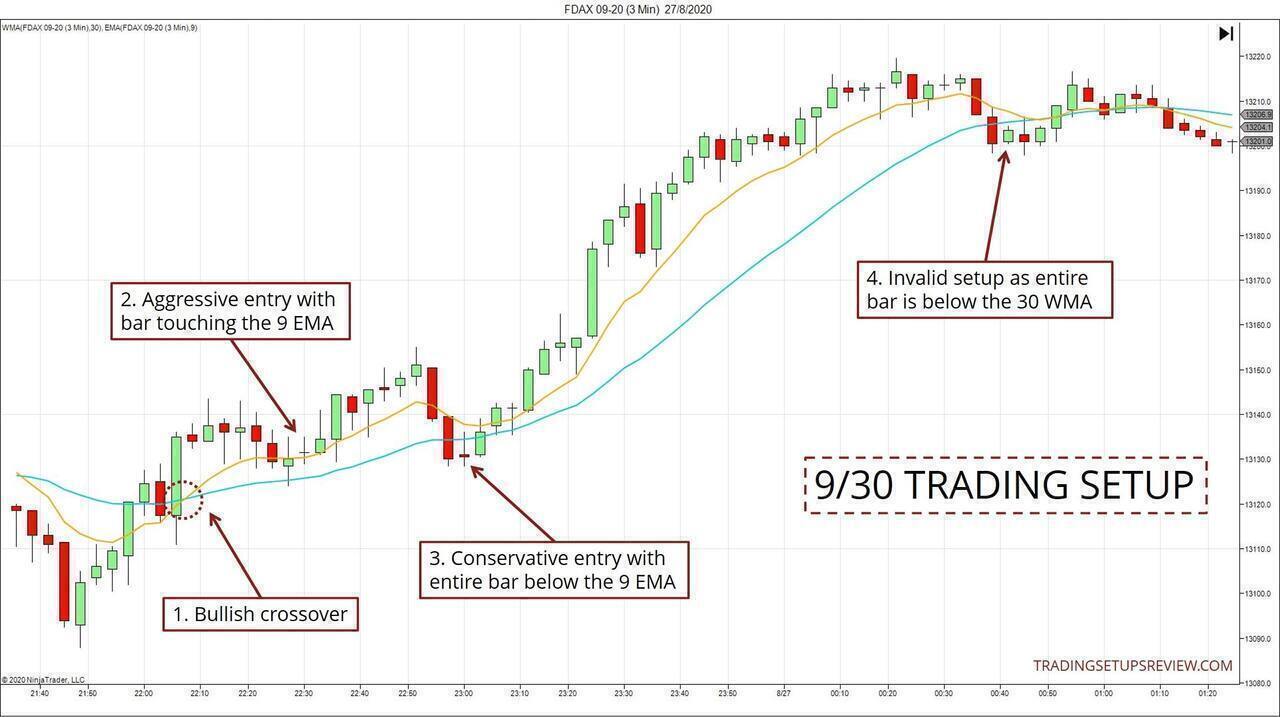
- Bullish crossover hinted at a possible bullish trend.
- Aggressive entry - setup bar overlapping with the 9-period EMA.
- Conservative entry - setup bar entirely below the 9-period EMA
- Pullback setup invalidated as the entire bar went below the 30-period WMA.
For more examples, refer to these articles:
Other Indicators
In this last section, you’ll find a variety of trading indicators for pullback trading.
When using indicators, it is crucial to keep things simple. Each indicator places some distance between you and the underlying price action. So be sure that each indicator you add is of value to your analysis.
Strategy #8: The Holy Grail Setup (ADX)
Linda Raschke’s Holy Grail setup uses the ADX indicator to locate a robust trend.
Then, it uses a moving average to time the entry.
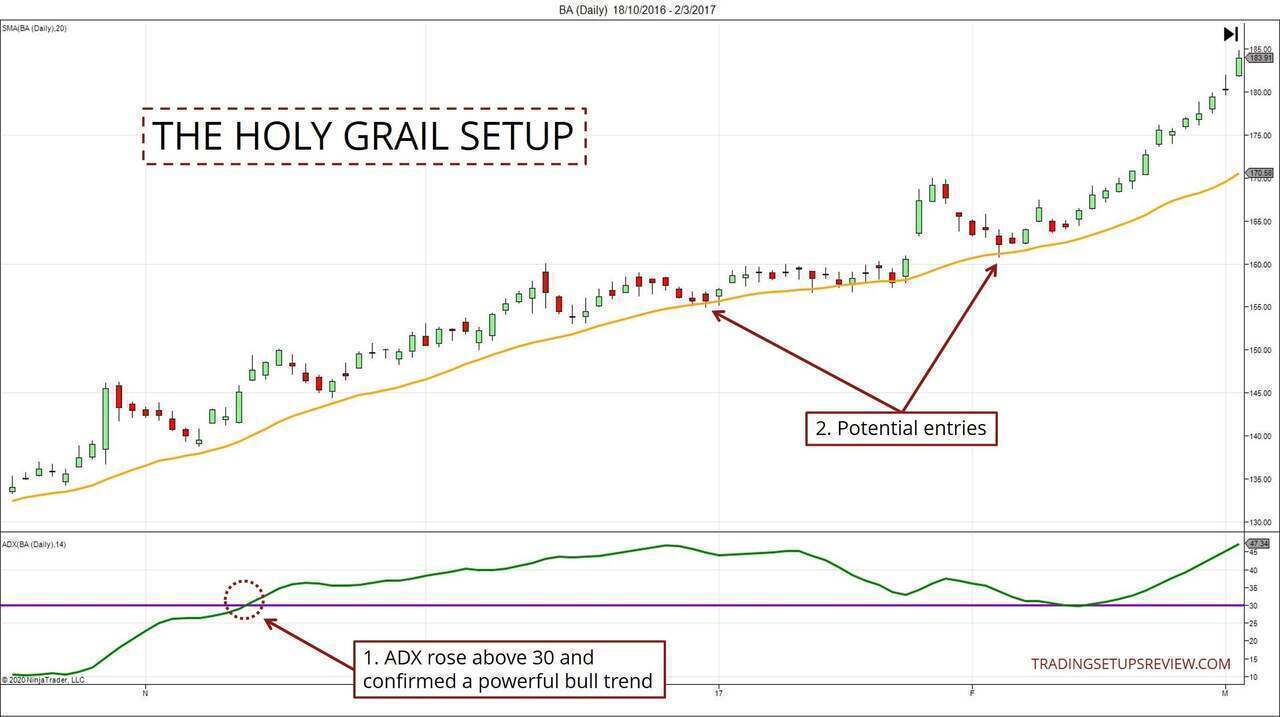
- ADX rising above 30 indicates a powerful trend in either direction. In this example, the bull trend is apparent.
- These instances of pullbacks to the 20 SMA were potential long pullback entries.
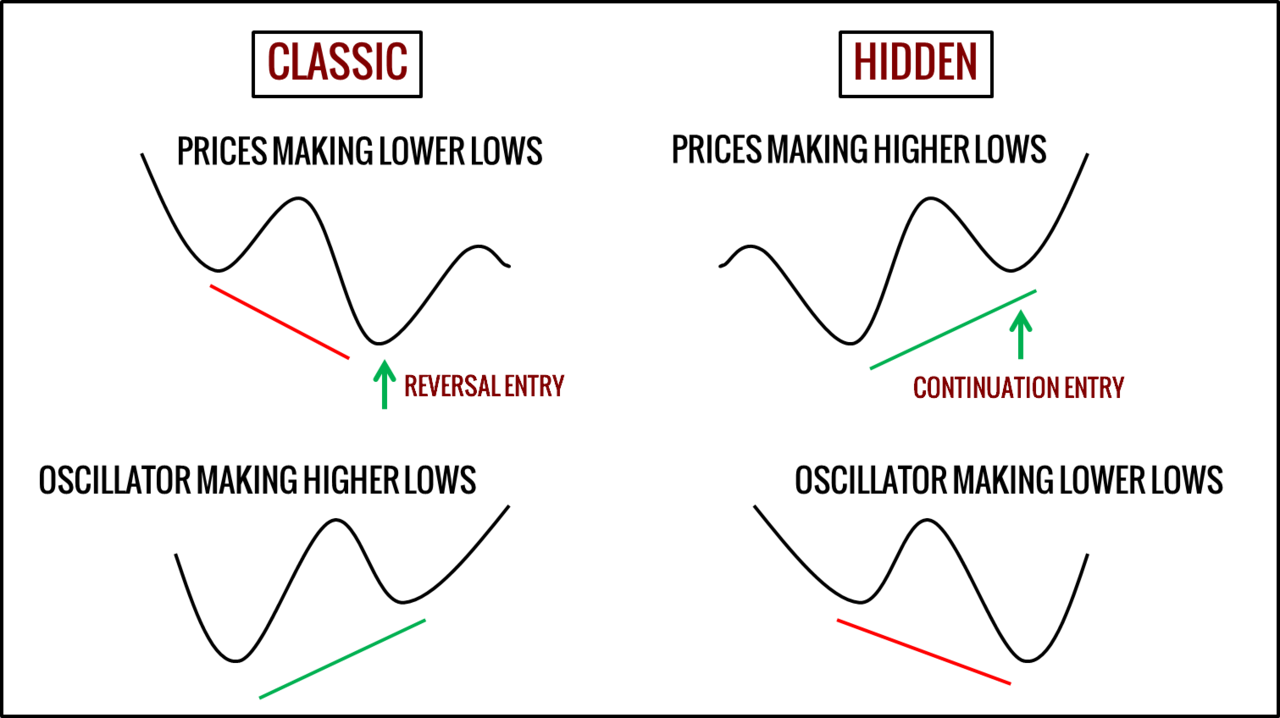
Strategy #9: RSI Hidden Divergence
The typical RSI divergence seeks reversal setups
But the hidden divergence offers continuation trades.
This chart below shows a bearish retracement trade.
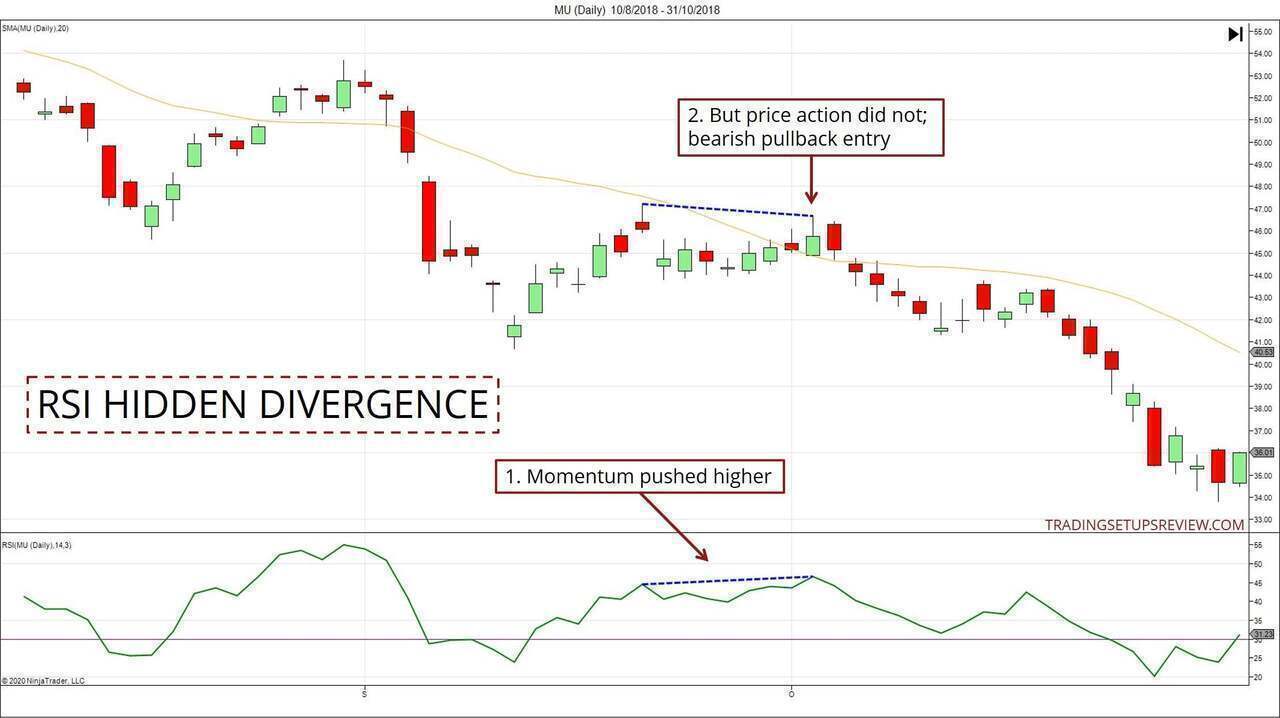
- The momentum pushed higher, according to the RSI plot.
- However, the price action did not create a new swing high. This formation is a bearish hidden divergence. You can use it to time a pullback entry into the bear trend.
Strategy #10: Pullback Trading Zones with Heiken-Ashi
The indicator here is the Heiken-Ashi plot which is smoother than the standard candlestick chart.
If you are encountering Heiken-Ashi bars for the first time, they might seem radical. But they do offer a helpful perspective to price action.
Learn more about Heiken-Ashi bars here.
The idea behind this strategy is to use Heiken-Ashi bars to spot a zone where the pullback might end.
The chart below points out the Zone Bars.
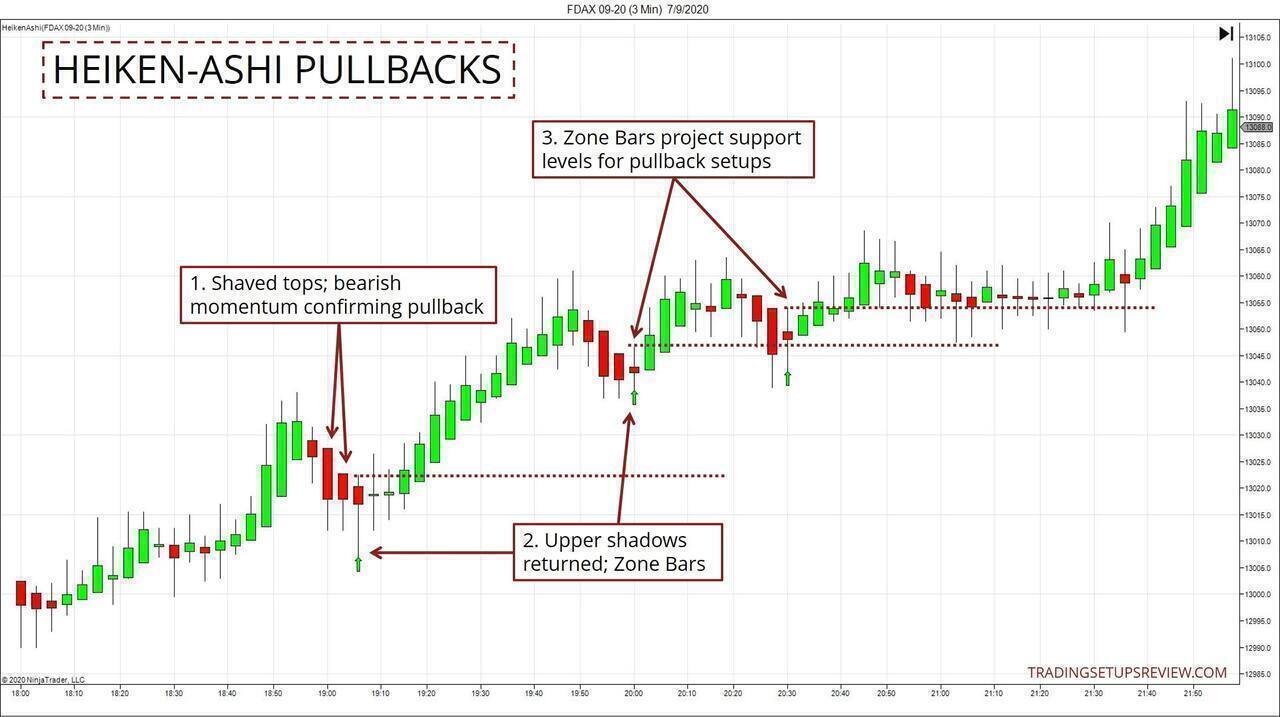
- A shaved top Heiken-Ashi candlestick represents bearish momentum. Here, it confirms a significant bearish pullback.
- Once we see top shadows appearing, we define a Zone Bar.
- We can then focus on these Zones Bars to project support levels. Then, with the actual candlestick chart, we can look for pullback entries within this zone.
For more examples, refer to this guide:
Conclusion - Pullback Trading Strategies
All pullback strategies share the same goal. They focus on a single balancing act.
They need to find the optimal trade-off between:
- The certainty that the trend is still in place; and
- A better reward-to-risk ratio
The deeper the pullback, the better the reward-to-risk ratio for a pullback trader. However, a deep retracement can also be a sign of a weakening trend. Hence, the trick is to find a balance that offers you positive expectancy over time.
Once you get this trade-off, you can design a pullback trading strategy with any trading tool you prefer.
Among these ten trading strategies, a couple of them might make the most sense to you. Or you might have found one that fits nicely into your current trading approach. In any case, exploring them yourself is the best way to evaluate them.
For your convenience, the links to the ten strategies are compiled below: