The Ultimate Moving Average Trading Guide
By Galen Woods ‐ 10 min read
The moving average is a simple and versatile trading tool, if you know how to use it. Learn what you need with this ultimate moving average guide.
Let’s start with a question. What is the most common technical indicator? Hint: Even fundamental analysts place this indicator on their charts. You don’t need to reach too far to find the answer: moving average.
The moving average (MA) is the most common technical indicator. It is likely among the first indicators you learned, and you see them on most charts. There is not a single charting platform without built-in MA indicators.
But why?
What is it about the moving average that makes it so popular? Here are some reasons among many others:
- It is simple.
- It is versatile.
- It adds value if you know its limitations.
In this trading guide, you will learn how to unleash the power of this simple indicator to analyze the market and boost your profits.
Don’t worry. We will not go through boring formulas and spreadsheets of moving average calculations. Instead, you’ll learn how to make the most out of moving averages, whether you are inclined towards price action or indicator trading.
This is a list of topics we will cover:
- Basic Moving Average Types
- Moving Average and Price Action
- Moving Average and Other Indicators
- Exotic Moving Average Types
Basic Moving Average Types
There are dozens of different MAs out there, and trying to understand them all is not advisable.
A moving average, like what its name suggests, is an average that moves. So at its core:
- It is the average of a set of data points.
- The data points change as the market moves, essentially dropping older data points in favor of new data.
The basic types vary by the way the data points (typically price data) are weighted.
Here are the three types:
- Simple (SMA) - A simple average of the past N prices. Just add the price data up and divide the total by N.
- Exponential (EMA) - An exponential moving average with a greater weight for recent prices. The weighting is exponential. An N-period EMA takes more than N data points into account and gradually dilutes past data’s effect.
- Weighted (WMA) - An average of the past N prices with a linear weighting, again giving greater weight to more recent prices.
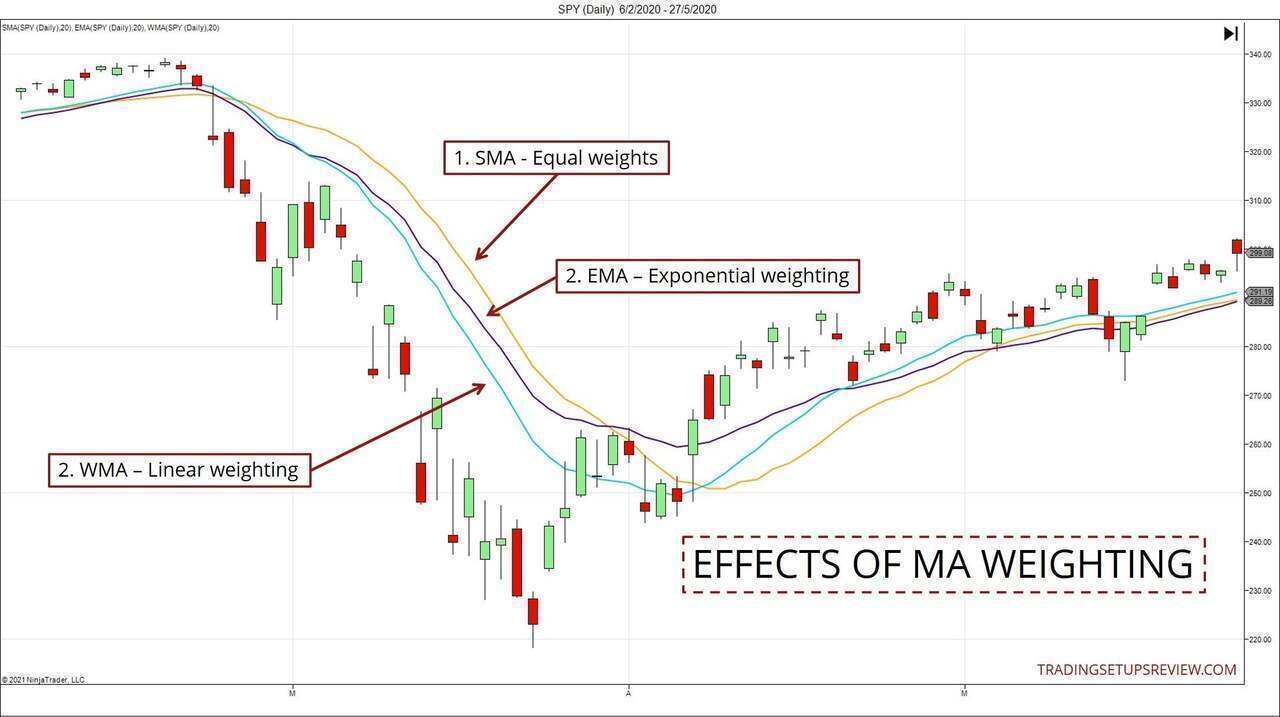
As you can see in the chart above, the way the prices are weighted affects how responsive the MAs are.
Be sure to acquaint yourself with the three basic MA types above. As for the exotic ones, you can explore them at your own pace once you’re comfortable with the foundational skills of using a moving average. (More on them in the final section of this guide.)
Moving Average and Price Action
The first step to trading with a technical indicator is to see how it interacts with price action.
You can use the concepts below for finding the market trend or for timing your entries.
Experiment with different look-back periods to see which works best for you. Higher settings tend to work well for observing trends, and lower lookback periods are good for timing.
Note that a moving average lags and responds to price action. This is why you must analyze it together with price action. This is the best way to place your analysis in context.
With sufficient practice, you will find that trading with just a moving average is viable.
To keep things simple, we are using a 20-period SMA here. You can also apply the same trading concepts with other MA types.
#1: Direction
The primary function of a moving average is to smooth trends. This means that you can glance at its direction for a quick trend assessment.
- Pointing up - Bull trend
- Pointing down - Bear trend
But things aren’t always that simple. To make sure that you are not trapped at the end of a trend, examine the price action too.
General guidelines:
- When the price structure aligns with the MA, the market is trending.
- When they oppose each other, the market is slowing down and might be reversing or retracing.
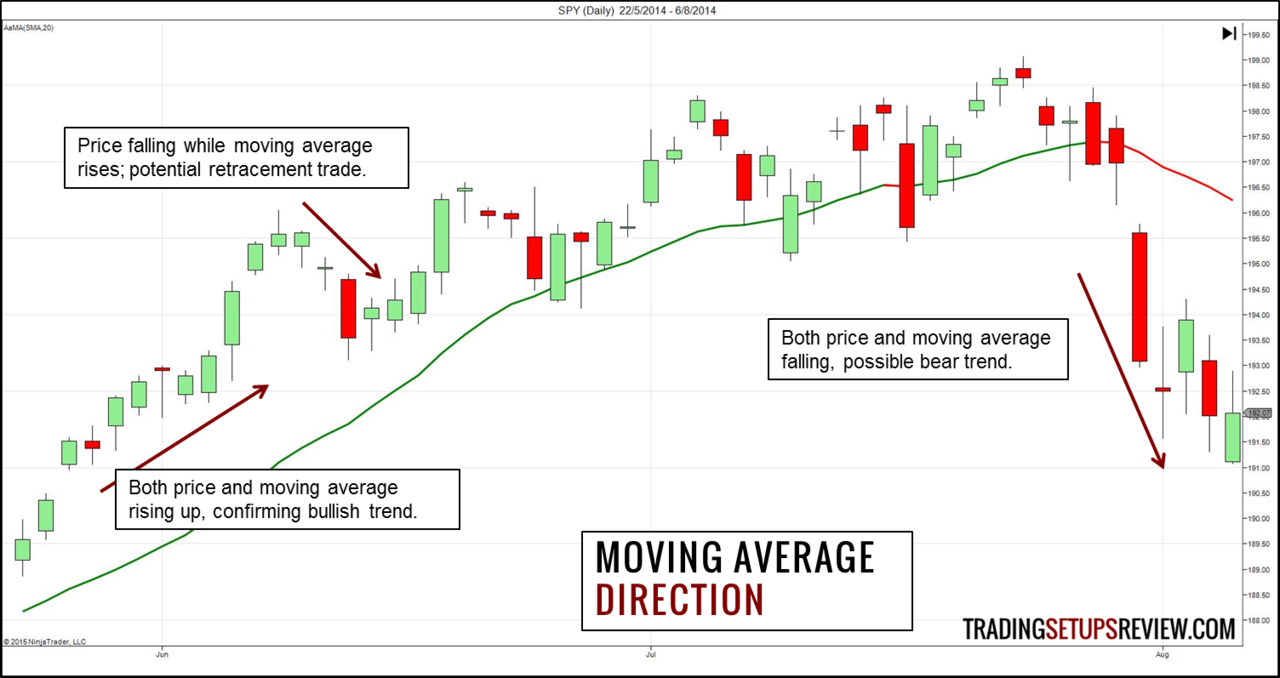
- When both prices and the MA are rising, we could confirm a bullish bias in the market.
- At this point, the market fell, but the MA continues to point up. Assuming that the bull trend will persist, this divergence offered a long pullback trade.
- Finally, a substantial bear gap coupled with a change in the MA slope highlighted a bearish reversal.
#2: Degree of Slope
The gradient of the MA supplies valuable information to the discerning trader.
- A flat MA hints at a sideways market.
- A steep line results from persistent action on one side of the MA. It indicates market strength and, at times, price exhaustion.
Note that the range of the MA gradient is related to its lookback period. Fast MAs respond quickly to new price data and could form steep lines, but slow MAs are weighed down by past data and show more stable slopes.
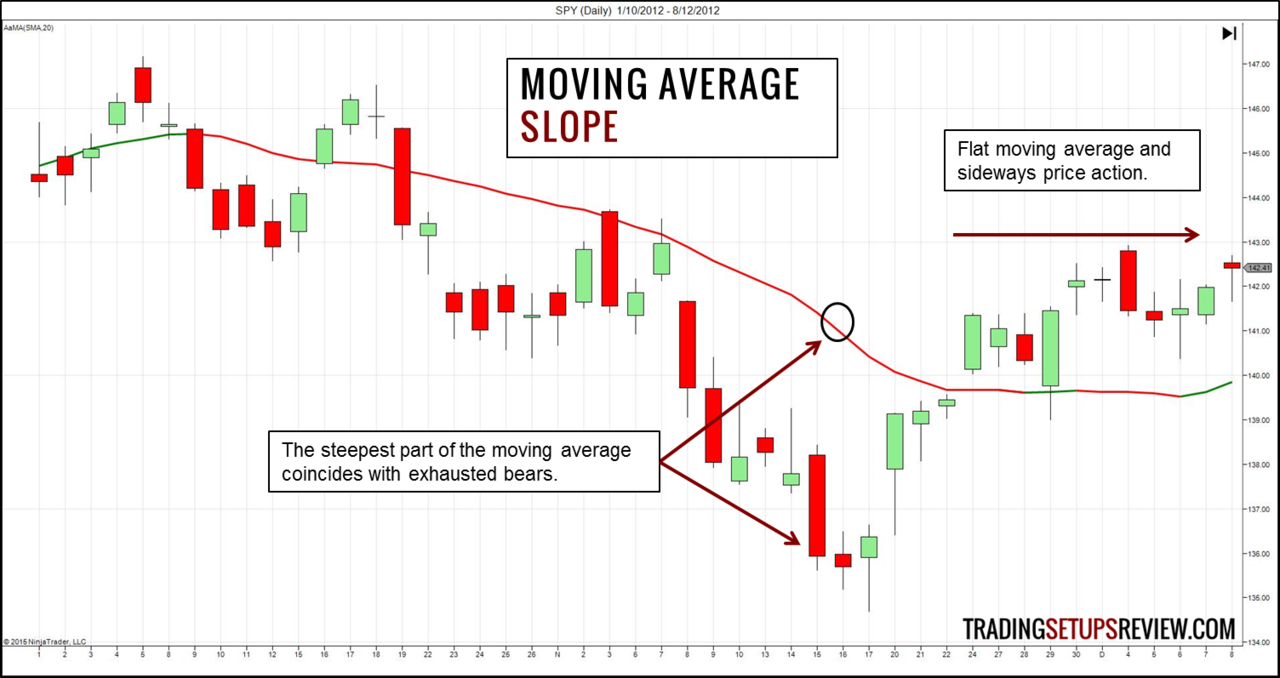
- The steepest point of the MA coincides with the exhaustion of the bears.
- The flat MA suggests sideways price action. Or at least that’s the theory. Take a closer look and notice that the price action seems to be forming higher swing highs. Hence, the flat MA could precede a bullish market. It makes sense to pay close attention here and not trust the MA blindly.
#3: Distance
Here, we are interested in the distance between the MA and price. These are the possible scenarios:
- In a sideways market, price tangles with the moving average. The is little or no gap between price and the moving average.
- In a healthy bull trend, the price stays a fair distance above the moving average. (Stays below in bear trends.)
- In an overextended trend, you find a striking distance between price and the MA.
Let’s see these ideas in action below.
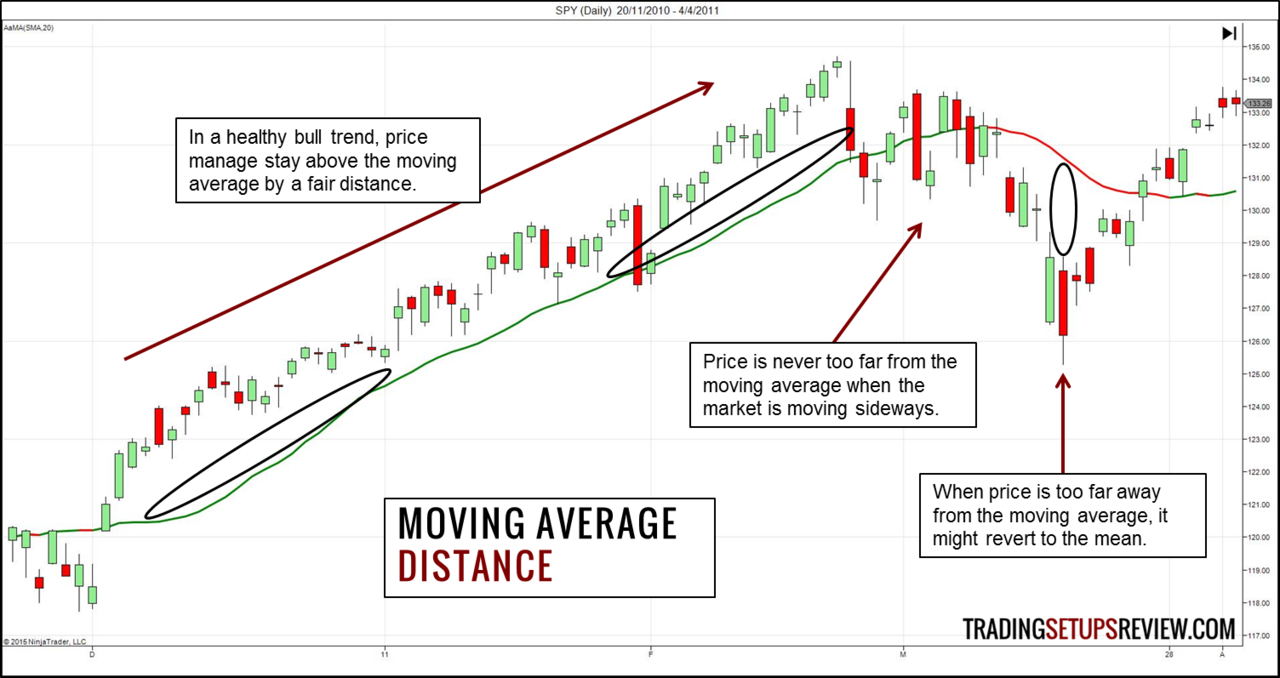
- In a robust bull trend, price action stays above the MA and seldom tests it.
- In this part of the chart, the interaction between price action and the MA changes. The candlesticks could barely steer clear of the MA. This overlapping of the candlesticks with the MA signals a sideways market.
- A sudden acceleration of price action leaves the MA lagging. This lag is apparent from the enormous gap between the candlesticks and the MA line.
#4: Support & Resistance
A moving average acts as support and resistance.
Look for price bars that overlap with it. Watch out for the way price interacts with it. If it slows down as it tests the MA, it is more likely to find support or resistance.
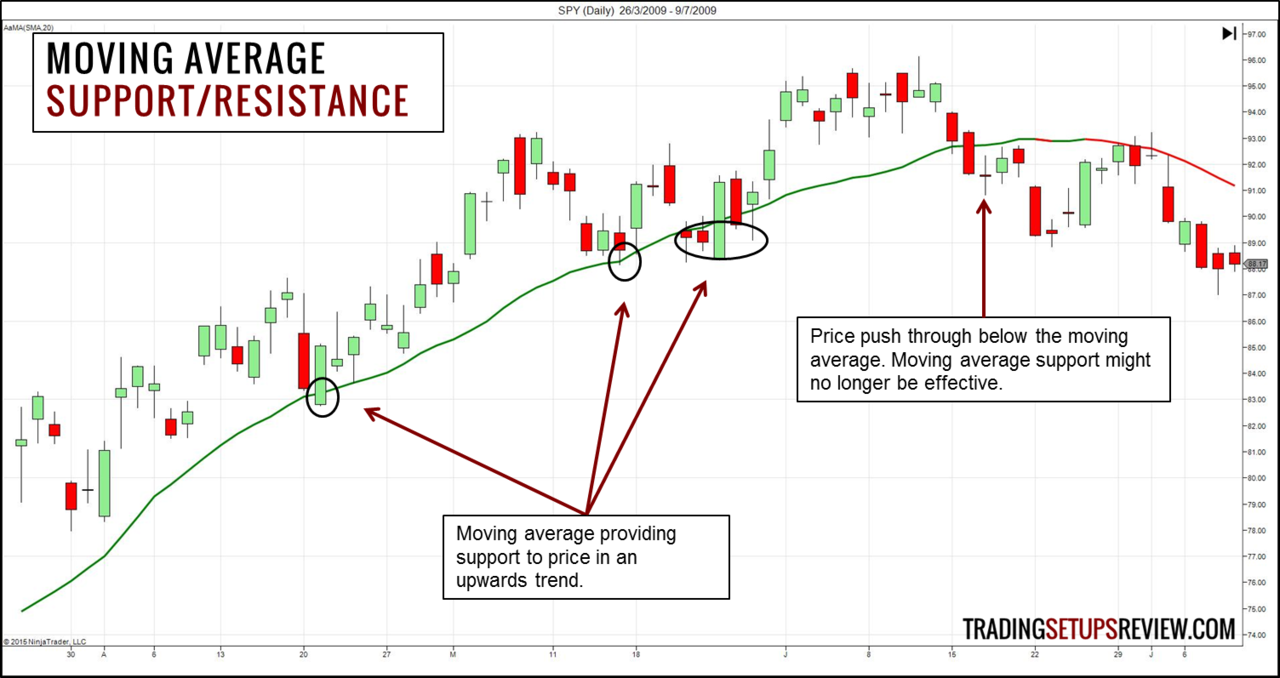
- In these instances, the MA acted as effective support for the market.
- Here, an entire candlestick formed below the MA. This might not always be a concern for the bull trend. But here, we had reason to pay attention. After all, it was the first candlestick to form entirely below the MA since the bull trend started.
Moving Average and Other Technical Indicators
To truly appreciate the value of moving averages, we need to see them work in various contexts.
#1: Signal Line (Nesting)
The moving average is a part of many technical indicators.
In trading oscillators like the RSI, MACD, and Stochastic, you’ll find signal lines. These signal lines are moving averages of the underlying indicator values.
Typically, we watch for the indicator line to cross above or below the signal line. And that triggers a signal to buy or sell.
In the chart below, the green line is the RSI plot, and the orange line is the signal line. When the RSI plot crosses above the signal line, we get a buy signal.
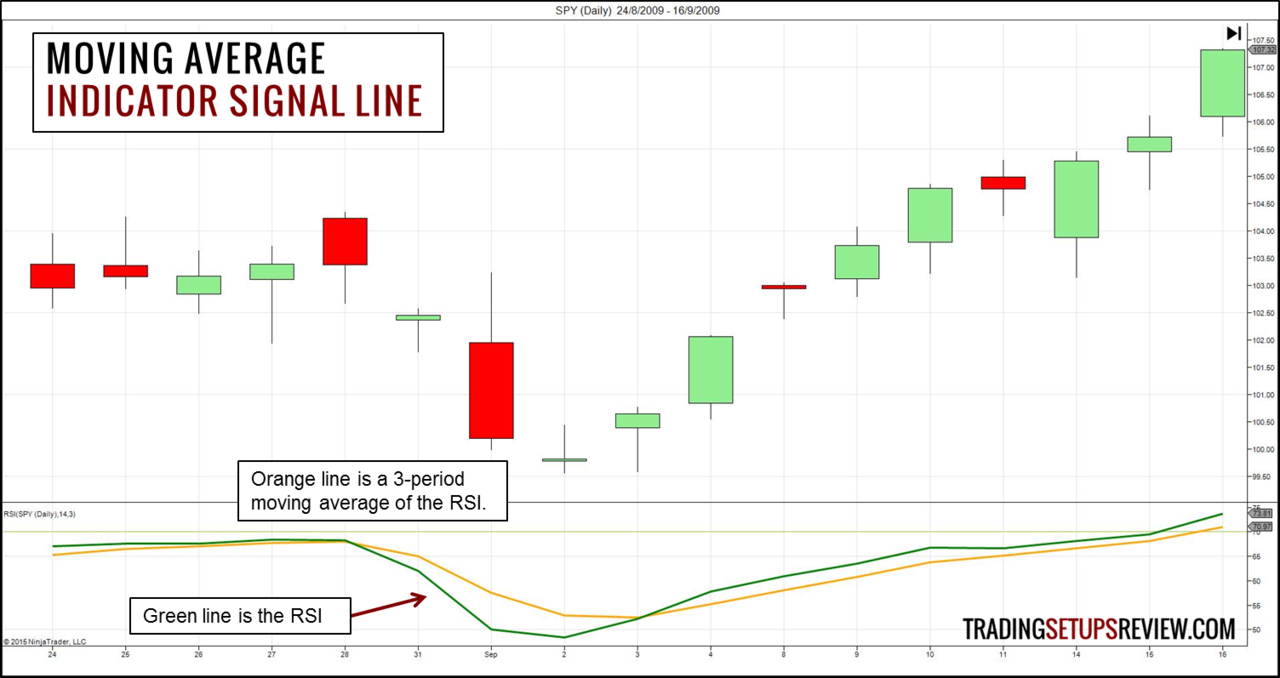
Signal lines are the result of nesting indicators.
Nesting refers to using the output of one indicator as the input for another indicator (in this case, the MA). For instance, to get the RSI signal line, we nest the RSI in a 3-period moving average.
I’ve also used the concept of indicator nesting in the On-Balance-Volume trading strategy by nesting the OBV in a long-term moving average.
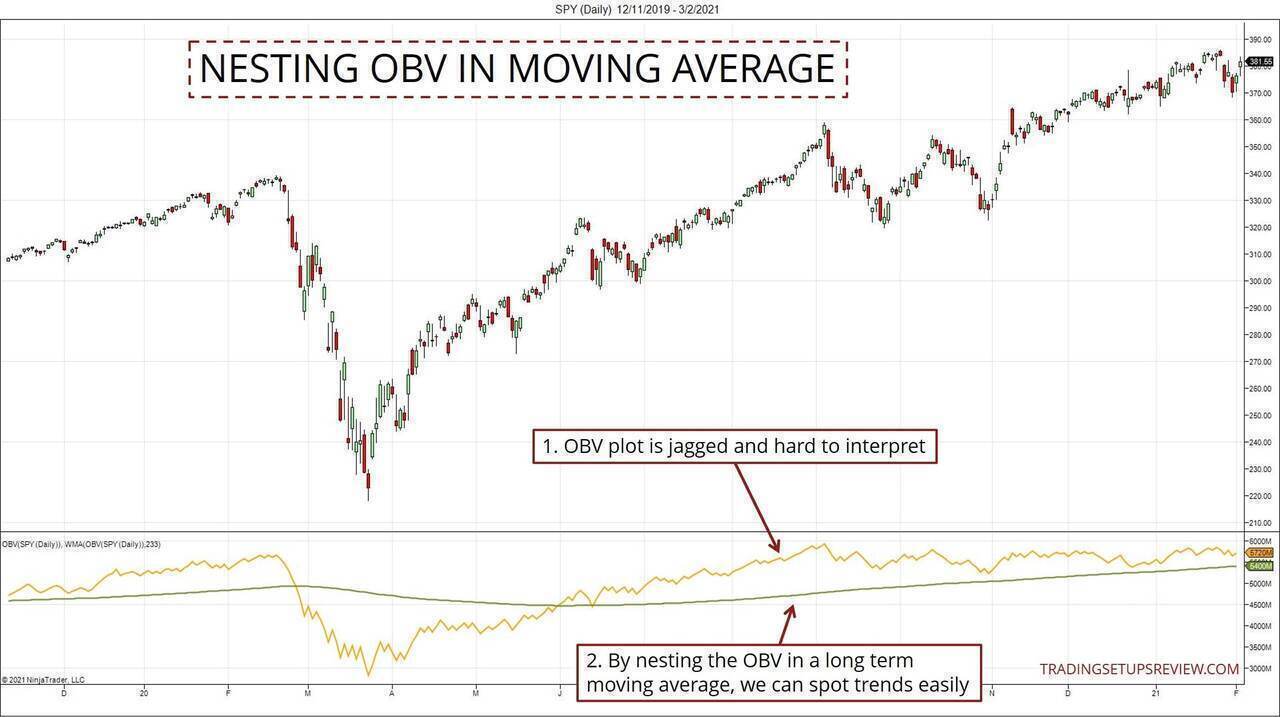
- The OBV plot is jagged and difficult to interpret.
- By nesting its values into a long-term WMA, we could spot trends easily and put the OBV values into context.
#2: Multiple Moving Averages
In search of confirmation, some traders use multiple MAs.
- When multiple MAs move in the same direction, it confirms a trend.
- When one crosses over another, it signals a possible trade entry.
The example below shows a trading system with three MAs. (20, 50, 200-period)
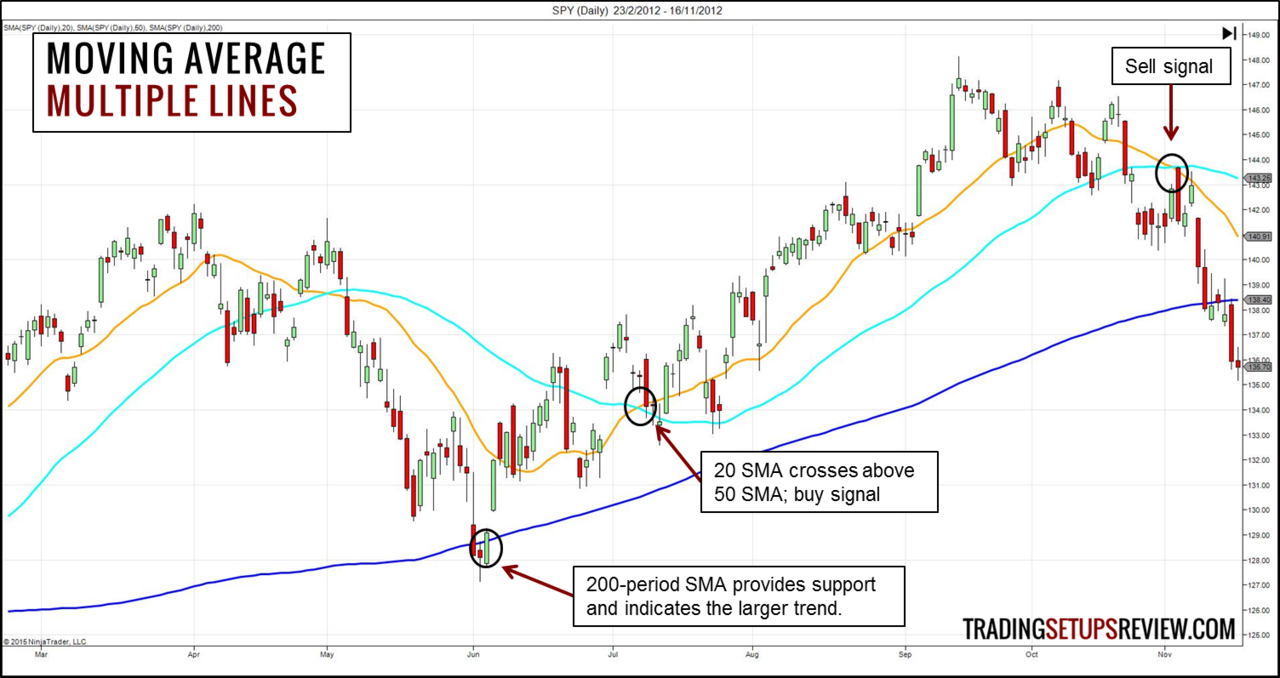
- The 200-period SMA tracks the overarching market trend.
- The 20-period SMA crossing above the 50-period SMA offered a bullish signal.
- Their bearish crossover issued a sell signal.
When you have a clear framework for interpreting each MA, they work well to highlight trends of varying degrees.
However, be careful of overdoing it as the law of diminishing returns apply here. Each MA you add offers less marginal value.
#3: Moving Average Bands and Envelopes
As mentioned, the distance between price and the MA shows the market’s momentum.
Price envelopes help quantify the distance between price and the MA. They perform well in the sideways market by offering credible support and resistance.
The best-known example is the Bollinger Bands. It consists of two standard deviation lines surrounding a moving average.
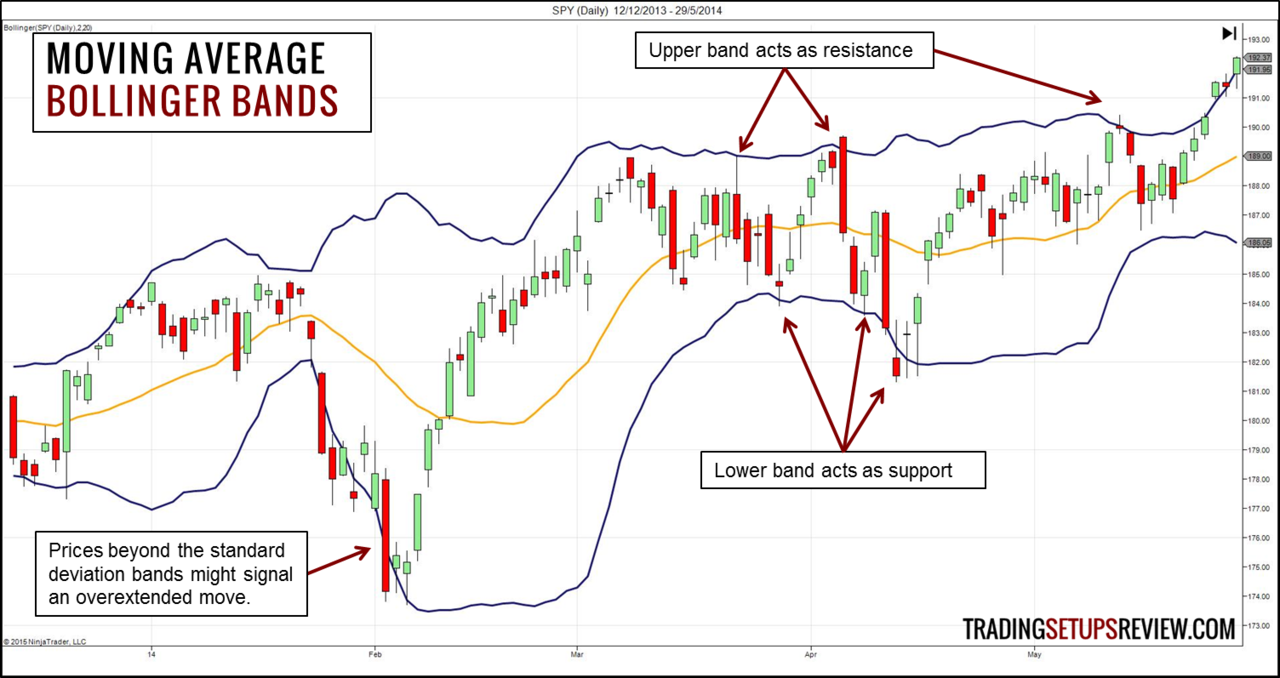
As you can see from the chart above, the Bollinger Bands highlight the trending and ranging parts of the market readily. Hence, it serves as a practical add-on to the plain old moving average.
Here are some guides to check out if you are interested in MA bands:
- Reading Price Action With Bollinger Bands
- Reading Price Action With Keltner Bands
- Trading Channels For Price Action
Exotic Moving Averages
As you learn more about MAs, eventually, you will encounter more exotic MAs designed to overcome specific problems with the essential MAs.
This list (not exhaustive) serves as a reference to the more uncommon MAs.
- Hull Moving Average
- Adaptive Moving Average
- Triple Exponential Moving Average
- Smoothed Moving Average
- Volume-Weighted Moving Average

- Displaced Moving Average
- Variable Index Dynamic Average
- Least Squares Moving Average
- Arnaud Legoux Moving Average
I’ll leave you to choose your favorite one.
Key takeaway: None of these exotic options is the Holy Grail.
They have their pros and cons. Do not use them without understanding how they differ from an SMA. An effective way to study these exotic MAs is to place them alongside an SMA.
Some traders perceive lag as a problem of moving averages. Hence, many of the “enhanced” options above seek to reduce lag.
However, try to think of the lag as a feature of the MA.
It is precisely due to the lag that MAs could fulfill their function to highlight trends. (If we want zero lag, we could just look at price action itself.)
The critical issue is to determine how much lag is optimal for our purpose. In other words, we don’t need the best MA; we need the MA that best fits our trading plan.
For instance, to highlight the long-term trend, we need a stable MA that most definitely lags. (like the 200 SMA)
But if we want to track price swings, we want a smooth but reasonably responsive MA. (like the 21 Hull MA)
Let the Moving Average Guide You
Moving averages are especially useful for traders who are new to analyzing price action.
However, using moving averages without considering the larger picture is unwise. Moving averages clarify price action but do not replace it.
In a nutshell, let moving averages guide you, but do not let them control you.
The article was first published on 27 March 2015 and updated on 23 March 2021.