A Simple Way to Look at Price Action - Trend Bars
By Galen Woods ‐ 3 min read
Learn a simple tool to help you understand price action. A Trend Bar helps you find market strength, hesitation, and traps - a solid trading tool.
Understanding price action is simple.
I am not talking about trading price action, but just reading it. I am referring to grasping what the market is doing right now.
Price action results from the struggle between buyers and sellers. It is the footprint of the fight between the bulls and the bears. When you look at a chart, it makes sense to focus on finding the bulls and the bears.
To find them, you don’t need to memorize dozens of candlestick or chart patterns. Let’s keep things simple.
The only concept you need is the Trend Bar.
What is a Trend Bar?
I explained the concept of Trend Bars in this setup. I borrowed the term from Al Brooks’ books, but I am using a more technical definition.
A Trend Bar has a body that is greater than 50% of the entire bar range.
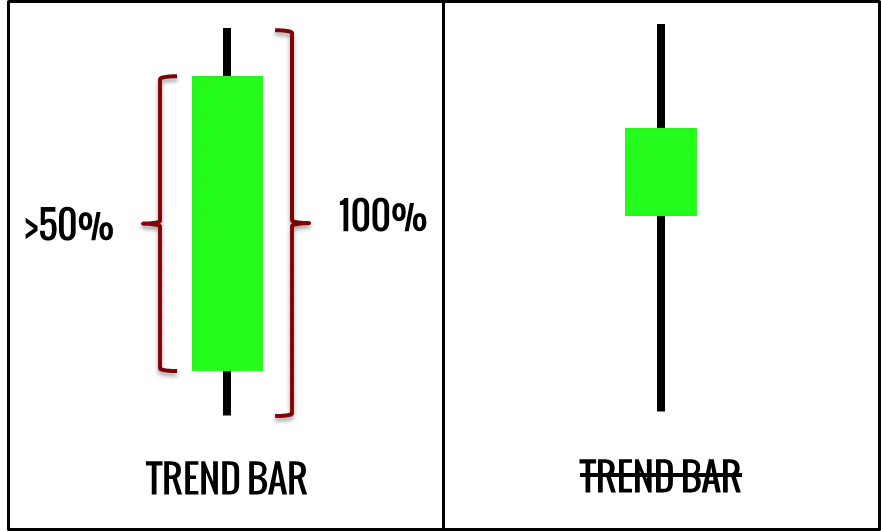
If a Trend Bar closes above its opening price, it is a Bullish Trend Bar.
If a Trend bar closes below its opening price, it is a Bearish Trend Bar.
Guidelines for Reading Price Action with Trend Bars
- Consecutive Trend Bars in the same direction display strength. Recognize it.
- Opposing Trend Bars imply a fight between the bulls and the bears. Find out who wins.
- Isolated Trend Bars are potential traps. Traps, by definition, are tricky. Is it really a trap?
Price Action Chart Examples
Let’s take a look at two detailed examples of this useful concept in action.
Chart Markup Legend
- Cyan Background - Trend Bar
- Blue Circle - Consecutive Trend Bars in the same direction
- Pink Dash Circle - Opposing Trend Bars
- Green Arrow - Bar following an isolated bearish Trend Bar (i.e., Bearish Trend Bar Failure)
- Red Arrow - Bar following an isolated bullish Trend Bar (i.e., Bullish Trend Bar Failure)
Example 1: SPY Daily Chart
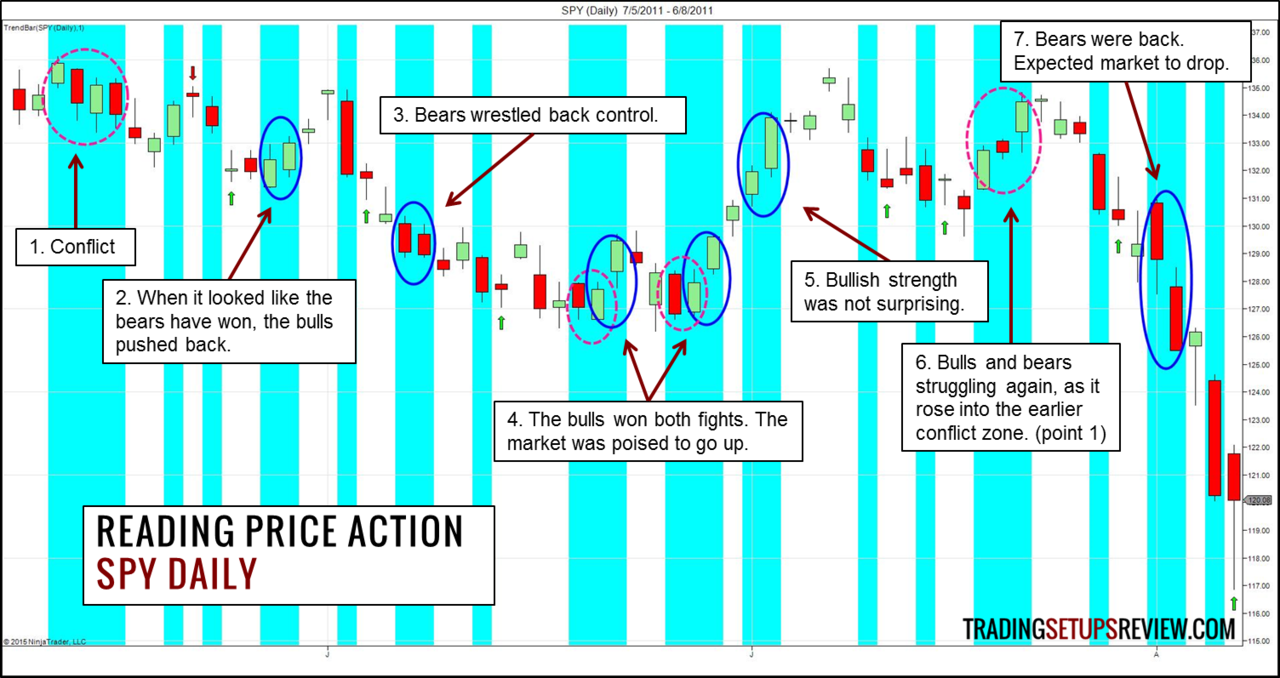
- Clear war zone with four consecutive alternating Trend Bars.
- Bulls tried to push back without much impact.
- Bears came back stronger.
- Both fights resolved in a bullish way. Likely that bulls have regained control.
- Bullish strength as expected.
- A fight that looked bullish. But we knew that the bulls did not have a clear win as the last extreme high was not exceeded.
- This thrust confirmed that the bears have taken over.
You can take a closer look at the red and green arrows. In the right context, they present solid bear and bull traps.
Example 2: ES Intraday 5-Minute Chart
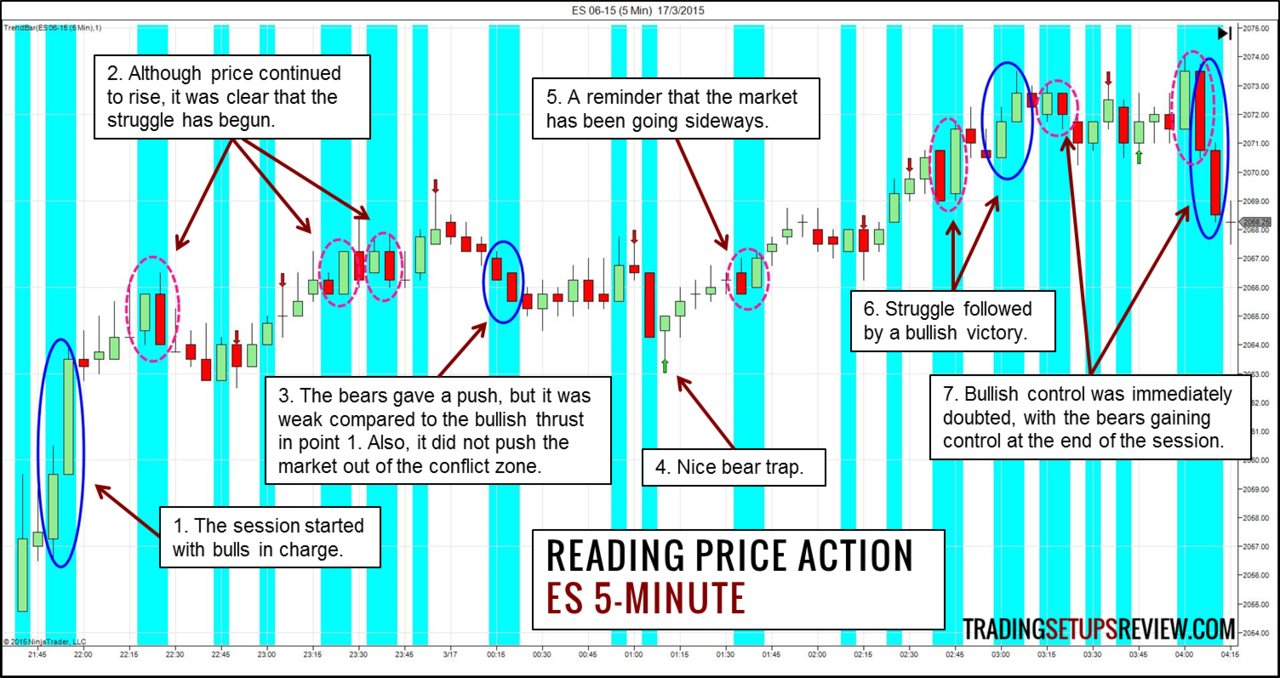
- The session started with the bulls in charge.
- However, the price soon stalled as both the bulls and the bears got involved.
- Bears were in but lacked strength when viewed in context.
- Accordingly, this was an excellent bear trap. (Chance to buy.)
- The bulls won this fight as price broke out above.
- More bullishness after some struggle.
- Sideways drift with two more instances of opposing Trend Bars. Bears win.
Open a Price Chart and Start Reading
This approach to reading price action is simple. This is why it works on all time-frames and instruments. (I selected the charts above at random.)
It takes some practice, but anyone can do it too. Open a historical chart, mark the Trend Bars, and practice how to interpret the constant price war.
After getting the hang of it, use the same method to understand the live market.
Remember that this is NOT a trading strategy. You need much more to form a price action trading strategy.
This is a price action method for understanding market movements. It’s not perfect, but it is a solid first step to understanding price action.