4 Price Action Trading Strategies That Profit From Trapped Traders
By Galen Woods ‐ 8 min read
Trapped traders are the basis of many price action trading strategies. Take on the opposite side of trapped traders to seize their losses as your profits.
Why do we need to understand the concept of trapped traders? What exactly do we mean by trapped traders? What are some specific strategies we can use to identify the flow of trapped traders?
We want to find traders who are trapped because they lose money. If we find them and take advantage of the order flow they create, we are poised to go along with the market momentum.
We can easily empathize with trapped traders because, at some point in our trading, we were trapped as well. (And will continue to be at times.)
Types of Trapped Traders
There are two types of trapped traders.
1. Trapped in Losing Positions
The first group consists of traders caught in a losing position.
What do they have to do eventually?
They must exit their positions as dictated by their stop-loss orders.
2. Trapped out of Winning Positions
The second group of traders is trapped out of winning positions.
Consider this scenario:
- You are in a long position.
- Now, the market falls and hits your stop-loss order. You exit your position.
- Almost immediately after the market hits your stop-loss, prices shoot up again.
- Then, the market moves quickly up towards your original price target.
You are now trapped out of a winning position.
What will you do?
Probably, you will chase after the market and try to join the trend.
The temptation is enormous here because you feel that you deserve to profit from your original prognosis.
Trapped traders are not a new concept in trading. Many trading patterns rely on this idea.
We will cover four trading strategies here.
We have already discussed them earlier in separate trading guides.
But here, our focus is different. This approach shows you a different way to interpret trading setups and allows you to focus on high-quality trading setups with a strong presence of trapped traders.
If you’re not familiar with the basic rules of each strategy, click on the links above to read up before proceeding.
Strategy #1: Hikkake Trading Strategy
Hikkake is an inside bar failure trading strategy. Hikkake means ensnared, so that gives us a pretty good idea of what to expect.
- It waits for a break-out of an inside bar to fail.
- Then, Hikkake traders enter as the break-out traders are getting out of their positions.
This diagram shows the different perspectives of two groups of traders:
- The trapped traders who were gunning for a bearish break-out of the inside bar
- The Hikkake traders waiting for the break-out to fail
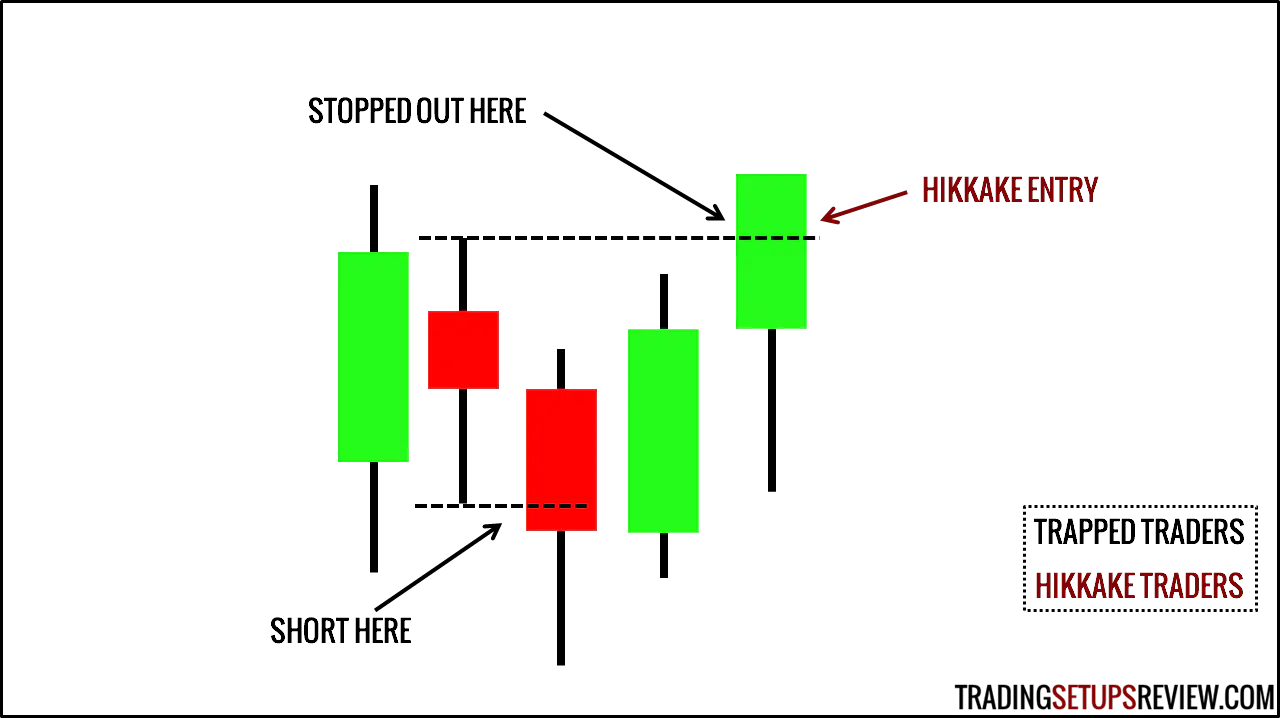
If you understand the concept of trapped traders, you will know why the Hikkake pattern works.
Inside bars are narrow range bars, which means less trade risk. Traders love to lower their risk, and will not give up a low-risk inside bar break-out setup.
What does this mean for the Hikkake trader?
It means more trapped traders and a higher chance of success.
So how do we find high-quality Hikkake setups?
- Find the best inside bar break-out setups.
- Then wait for them to fail.
Hikkake Trading Example
Let’s take a look at a trading example.
This chart uses the Price Action Pattern Indicator to mark out the Hikkake pattern.
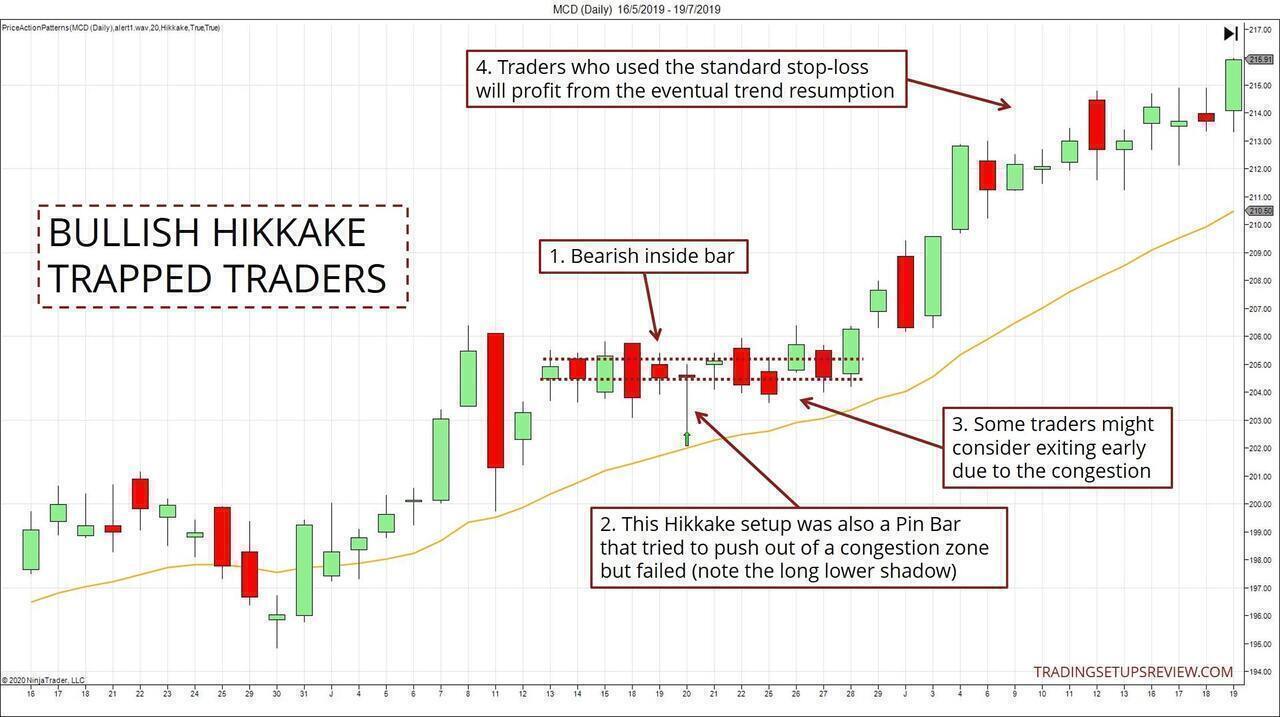
- After a small bullish opening gap, the market drifted sideways before forming an inside bar.
- This failed break-out of the bearish inside bar formed a Hikkake setup. It looked great as it was also a bullish Pin Bar that tried to push out of the congestion zone.
- The best setups move in our direction quickly. But in this instance, the market stalled. Nimble traders might choose to scratch the trade. (And they are not wrong to do so.)
- However, considering that the trend was in our favor, it was reasonable to at least stick to a standard stop-loss below the break-out bar (Pin Bar).
Strategy #2: Two-legged Pullback in a Trend
The two-legged pullback in a trend is another well-known price action trading pattern. Al Brooks popularized it in his books as M2S and M2B setups.
The two-legged pullback in the diagram below shows a pullback upwards in the context of a bear trend.
It marks the perspective of trapped traders in black.
- They shorted at the end of the first leg upwards, hoping to join the bearish trend.
- But they got stopped out by the second bullish leg.
- As the market resumed its fall, the traders got trapped out of a winning position.
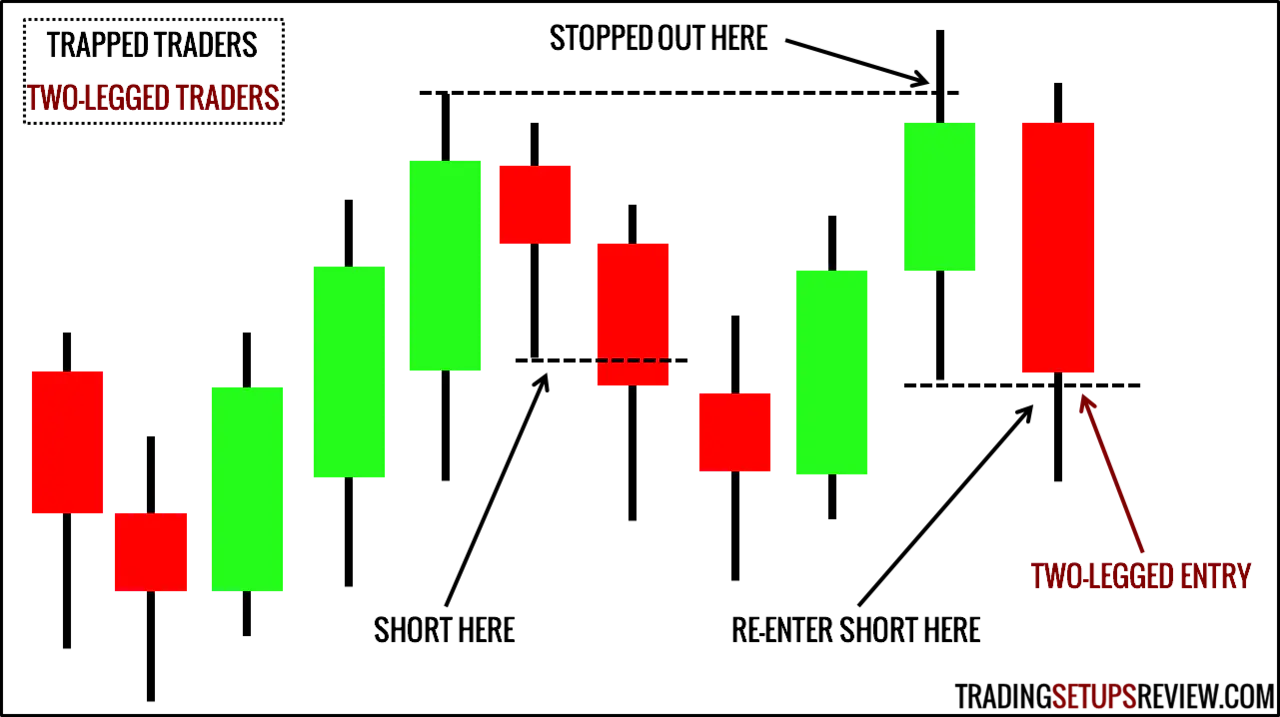
This is what the more patient traders do:
- They wait for the second leg to end before getting into a short position.
- By doing so, they benefit from the momentum created by the trapped traders who are desperately trying to get back into their short positions.
The concept behind this setup is similar to the re-entry trading strategy.
The power of two-legged pullbacks stems from two groups of trapped traders. The diagram above discusses one group.
The other group of traders tried to go against the trend. You will find them in the trading example below.
M2S Trading Example
This chart shows the 3-minute candlesticks from the broad market exchange-traded fund SPY.
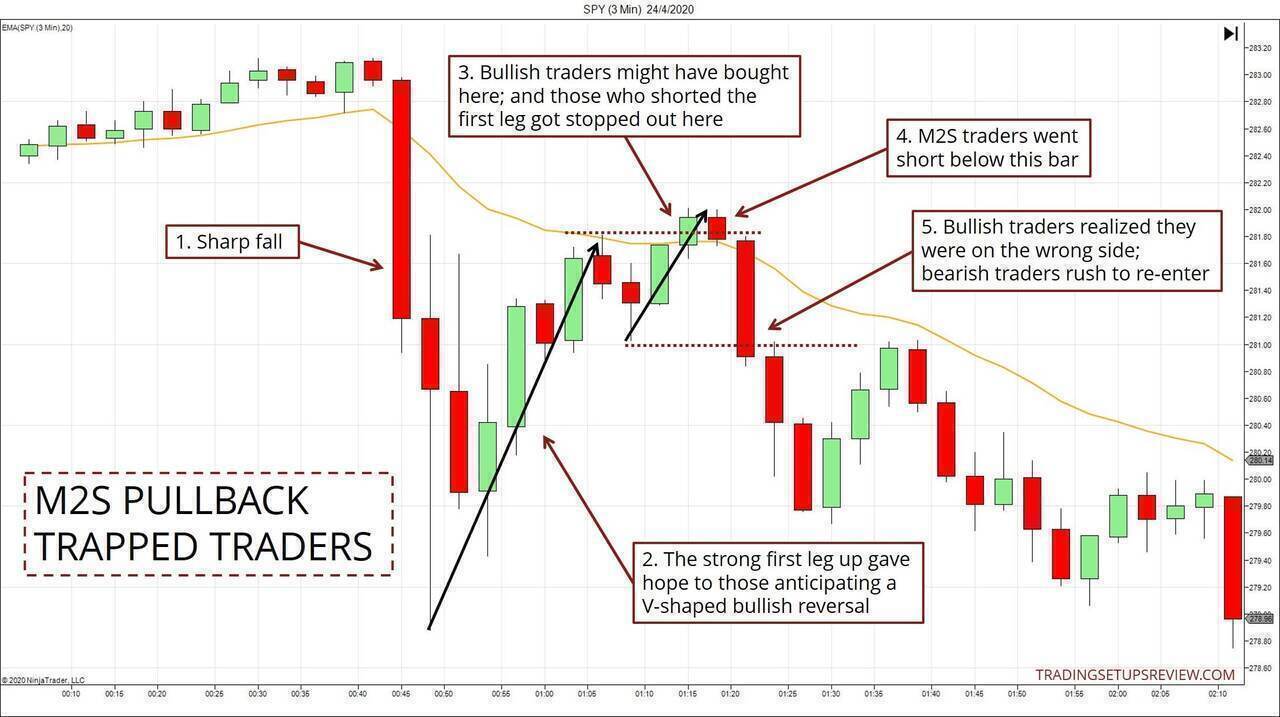
- This sharp fall gained the interest of bullish traders looking for a V-shaped reversal.
- This dominant first bullish leg drew the bullish traders into the market.
- However, for the bulls, the second leg was not as promising as the first.
- The standard M2S setup entry was just below this bar.
- At this point, the bullish traders lost faith, and bearish traders rushed to (re)enter. This order flow benefitted M2S sellers who shorted at the end of the second leg up.
Strategy #3: Pin Bar
The Pin Bar is a classic trap pattern. You can often find it as part of the other strategies discussed here.
It goes the distance to trap traders by poking up above a swing high or below a swing low. Also, its long tail confirms that a price trap is present.
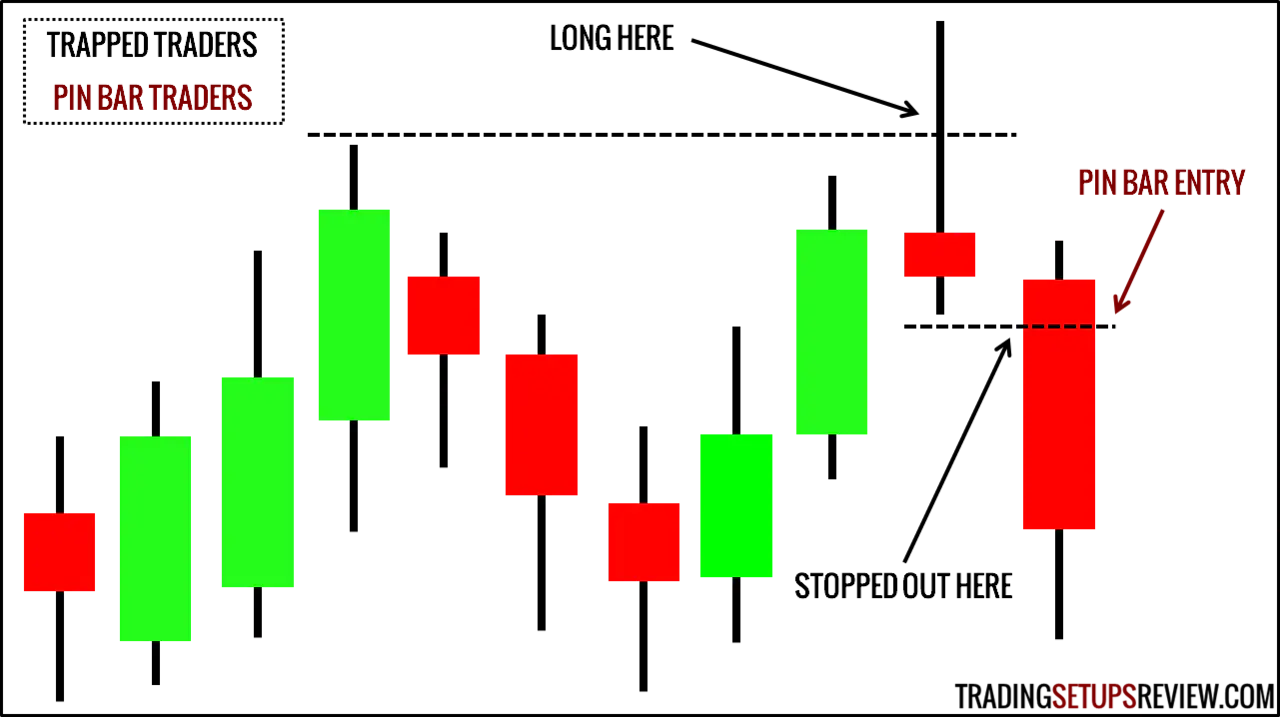
The best pin bars are those that went beyond significant swing highs and swing lows.
This is because many traders enter or exit their trades at major swing highs and lows. These traders, if trapped, will fuel our blast to profits.
Pin Bar Trading Example
This daily chart shows a Pin Bar highlighting trapped bullish traders.
Again, we are using the Price Action Pattern Indicator to mark out the Pin Bars. Of course, you can also spot Pin Bar manually. The indicator merely facilitates the identification.
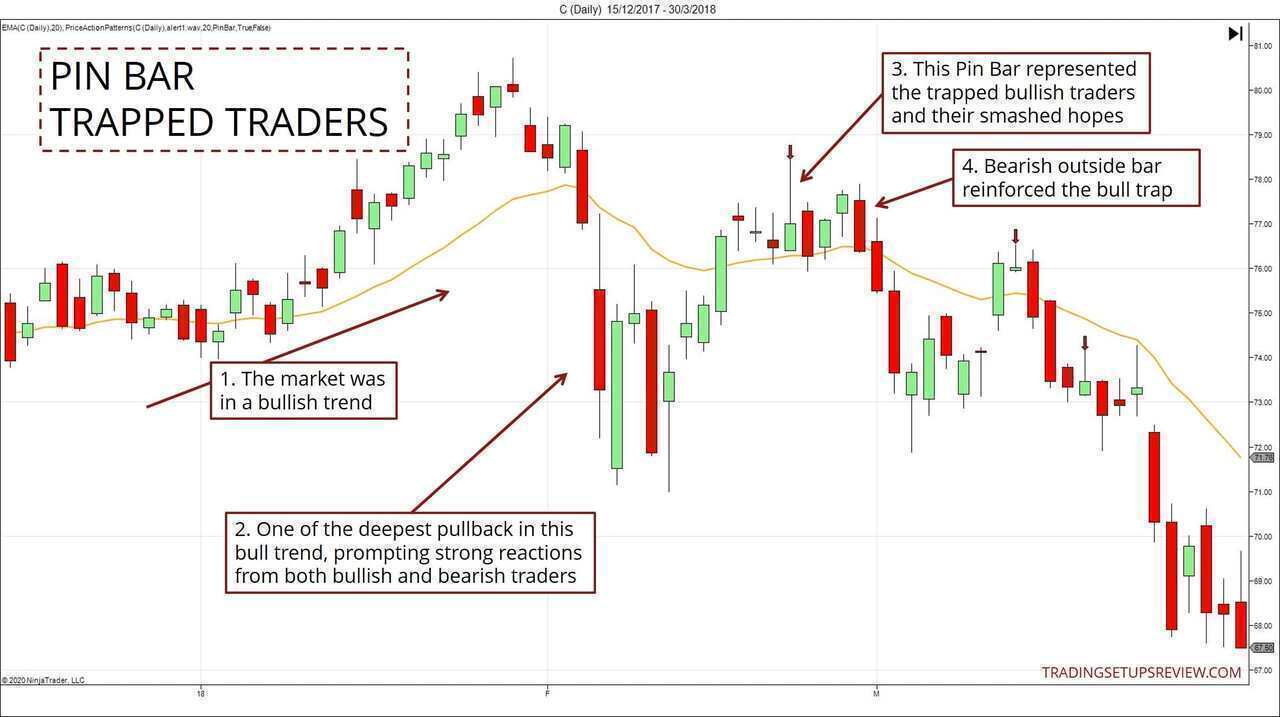
- The market was in a bullish trend.
- Deep pullbacks prompt strong reactions. Bearish traders looking for reversals get excited; bullish traders looking for a bargain entry pay attention too.
- Despite an initial bullish thrust, this Pin Bar was a sign of overhanging supply. It was a sign of trapped bullish traders.
- This bearish outside bar was another trap for the bulls. It rose above the previous candlestick before closing below it, reinforcing the bull trap.
For traders who missed the Pin Bar entry, the bearish outside bar offered an excellent second chance.
Strategy #4: Trend Bar Failure
Now let’s turn our attention to the Trend Bar Failure.
Its simplicity makes it one of the most versatile price action patterns.
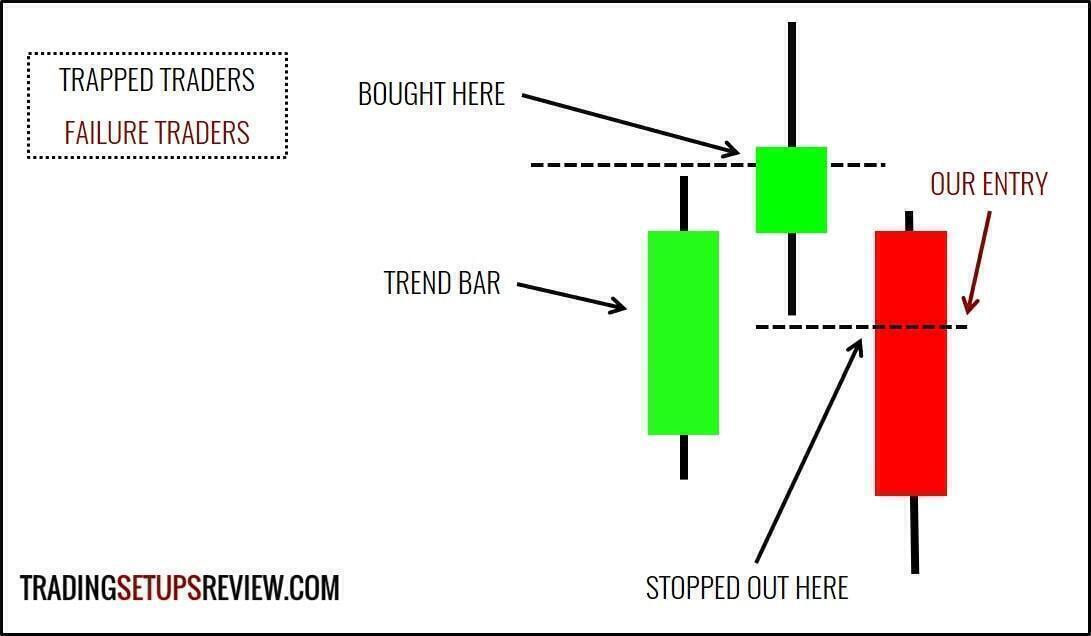
A trend bar is a healthy directional bar. In terms of OHLC chart analysis, it is the most basic form of a trend.
- Optimistic (but overly eager) traders expect the market to continue in the direction of the trend bar.
- So they buy immediately after the market breaks the high of a bullish trend bar.
- When the market actually reverses down, we look to fade the trend bar.
Remember that this is a short-term price pattern. So you should stick to finding fade trades in the direction of the overall trend.
Trend Bar Trading Example
This example shows a test of a support zone. There are many ways to define a support or resistance zone.
Here, we are using previous congestion areas to highlight the support zone. Hence, I’ve applied the Congestion Zone indicator (from my price action course) in the chart below.
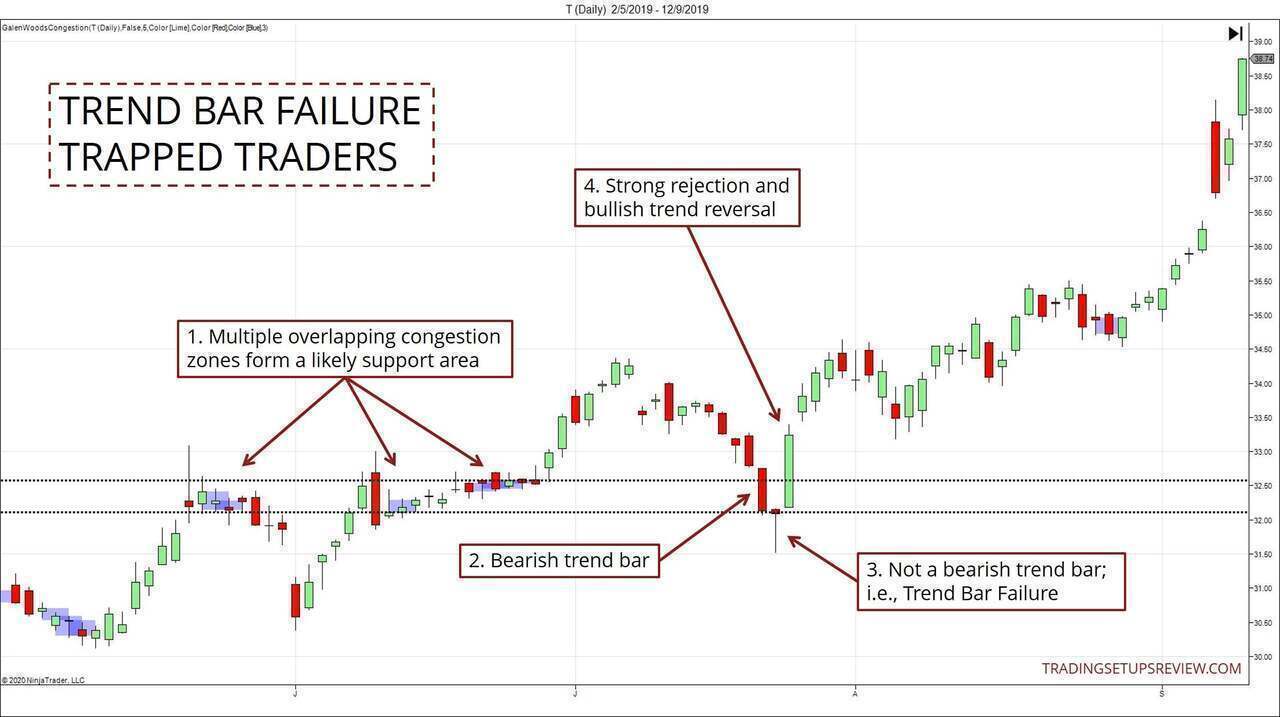
- Multiple overlapping congestion zones form reliable support or resistance zones.
- This bearish trend bar made it look like the support zone would not hold.
- However, the following bar was not a trend bar. This lack of follow-through after a trend bar is what defines a Trend Bar Failure.
- Indeed, traders who shorted below the support zone became trapped in a losing position as the market reversed upwards.
Here, the Trend Bar Failure was also a bullish Pin Bar. This is common.
However, the identification method differs:
- For Trend Bar Failures, we identify it by focusing first on the Trend Bar, and then the lack of follow-through.
- For Pin Bars, we identify by its long shadow poking beyond a support or resistance zone.
When two methods converge on the same price pattern, the confluence adds to our confidence.
Conclusion - Traders’ Trap
The story of trapped traders may not describe the underlying market mechanics entirely.
But from my experience, thinking about where traders might get trapped helps form an analytical framework.
It offers a simple way to improve your trading.
Focus on changing your perspective, but not your strategies.
Think like trapped traders, but do not act like them.
Once you switch your perspective, you’ll realize that it is not a difficult task. This is because all traders, including you and I, must have felt trapped at some point.
Thinking like a trapped trader will help you find high-quality trading setups.
And these four trading strategies are merely a start. You will find this trading concept repeatedly in many other trading strategies.
Want to study more examples of trapped traders? Click here for more chart examples.
The article was first published on 17 December 2013 and updated on 8 May 2020.