How To Trade Reversals By Spotting The Big Players With Volume Spikes
By Galen Woods ‐ 8 min read
Trends seldom reverse without the big players. By spotting high volume bars (volume spikes), you can focus on the key price action that leads to reversals.
If you’re reading this, you’re likely to be a minor player in the market. For small retail traders, one way to succeed in the market is to observe demand and supply. And the best way to do so is to follow the big players.
Who are the big players? The banks? The hedge funds? The pension funds?
Any individual, entity, or group that trades large volumes is a big player. It does not matter who they are or what we call them.
Hence, the best way to track big players is through volume.
In this guide, we will focus on a specific volume formation - volume spikes. What are volume spikes?
They are sudden surges in volume to a level that is impossible without the big players in the game.
Here, you will learn how to take advantage of this idea and implement it for reversal trading.
Trading reversals is rewarding, as catching the start of a new trend is one of the most profitable trades - the best-case scenario for traders. But trading reversals is also risky and has a high chance of failure.
Hence, we need to put the volume on our side while controlling our risk.
Reversal Trading Approach
This section covers a trading approach and not an exact strategy. An approach is flexible, so you can work it into your trading plan as you like.
How do we integrate volume spikes into a reversal trading strategy?
Before considering any reversal trading setup, look for:
- Price bars with volume spikes near the trend extreme
- Confirmation of a reversal
- An entry point
#1: Price bars with volume spikes at trend extreme
This guideline is the cornerstone of this method, as it confirms that the big players have an interest in the market.
Caution: If the trend extends past the volume spike bars without stalling, forget about a reversal.
How do we identify such volume spikes?
You can simply eyeball the charts with a volume plot for abnormal levels that stand out.
For me, I use a long-term Bollinger Band applied on volume data to identify spikes. This systematic approach improves my focus and consistency.
I created a simple indicator on TradingView to highlight volume spikes based on this concept. You can use it to help you spot volume spikes for further study. (It’s free to use.)
The chart below shows this indicator in action, with the volume spike bars highlighted in green. (The price action corresponds roughly to Example #1 in the next section
I have discussed the specifics of this method in an earlier tutorial - please refer to it for details.
#2: Confirmation of reversal
After spotting a volume spike, the next step is to seek confirmation.
Not all volume spikes lead to reversals. Hence, we need to wait for supporting evidence to increase the odds of a reversal taking place.
Essentially, you want to see the market make a convincing attempt to reverse. It can be a decisive trend line break or a powerful price thrust.
#3: Entry point
Finally, you need to decide on your exact entry point.
You can use a price pattern or a bounce from a support or resistance (S/R) zone. Your chosen entry pattern will also determine your stop-loss.
Selecting a well-timed entry will help to limit your risk.
Trading Examples - Finding The Big Players
Let’s study this approach with three in-depth examples. You’ll learn to spot the critical shifts in demand and supply as we go along.
In the examples below, I used two concepts from my price action course: Anti-Climax and Congestion Zone.
In a nutshell, this is what you need to know:
- A Congestion Zone is a pattern I use to identify congestion and to project potential support and resistance. (In the charts below, the Congestion Zones are shaded in purple.)
- An Anti-Climax Pattern is an unsustainable price thrust that acts as a reversal pattern.
Even if you are not familiar with these patterns, fret not; you can still follow the examples below. But in case you want to appreciate them better, check out the following links:
Example #1: Consecutive Volume Spikes Signal Demand
Our first example comes from the daily price action of Delta Air Lines (DAL on NYSE).
It shows how volume spikes signaled a rush of buyers into the market.
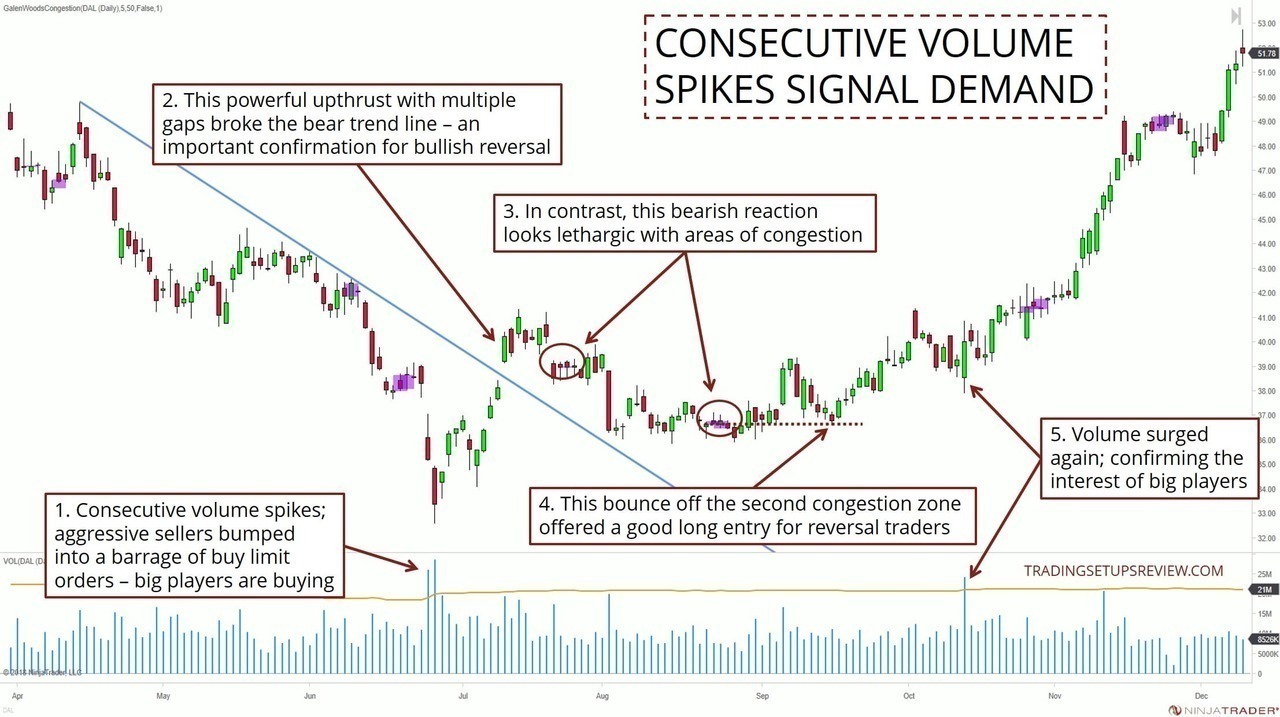
- Consecutive price bars were pushing to new trend lows with abnormally high volumes. Think of it as aggressive sellers bumping into a barrage of buy limit orders. These buy limit orders formed a demand zone that halted the bearish trend.
- Despite the excellent volume pattern, it was premature to take on a reversal trade. But this upwards thrust broke the trend line decisively and offered a wonderful confirmation of the market’s bullish intent.
- We expected a reaction to the powerful bullish thrust. But compare the attempt to push back down to the earlier bullish thrust. The bearish response was more sluggish. The context was ripe for considering a reversal trade. Next, let’s look for an entry.
- Congestion areas often act as support and resistance. Hence, this bounce off the congestion zone was a possible entry point.
- Here, we spotted a second volume surge. If it came as the market pushed to a new trend high, we would be concerned as it might be a sign of increasing supply. But instead, it took place during a pullback downwards. Hence, this volume spike bar was more likely to reflect a secondary influx of demand from the big players. From here, the buyers took over and fuelled a bull trend.
Example #2: Volume Spikes Within A Trading Range
This chart shows the daily candlesticks of Ross Stores, Inc (ROST on NYSE). There was an existing uptrend from which we projected a bull trend line.
As this example shows multiple volume spikes within a trading range, the analysis is more involved. Don’t forget that you can click on the chart for a larger version.
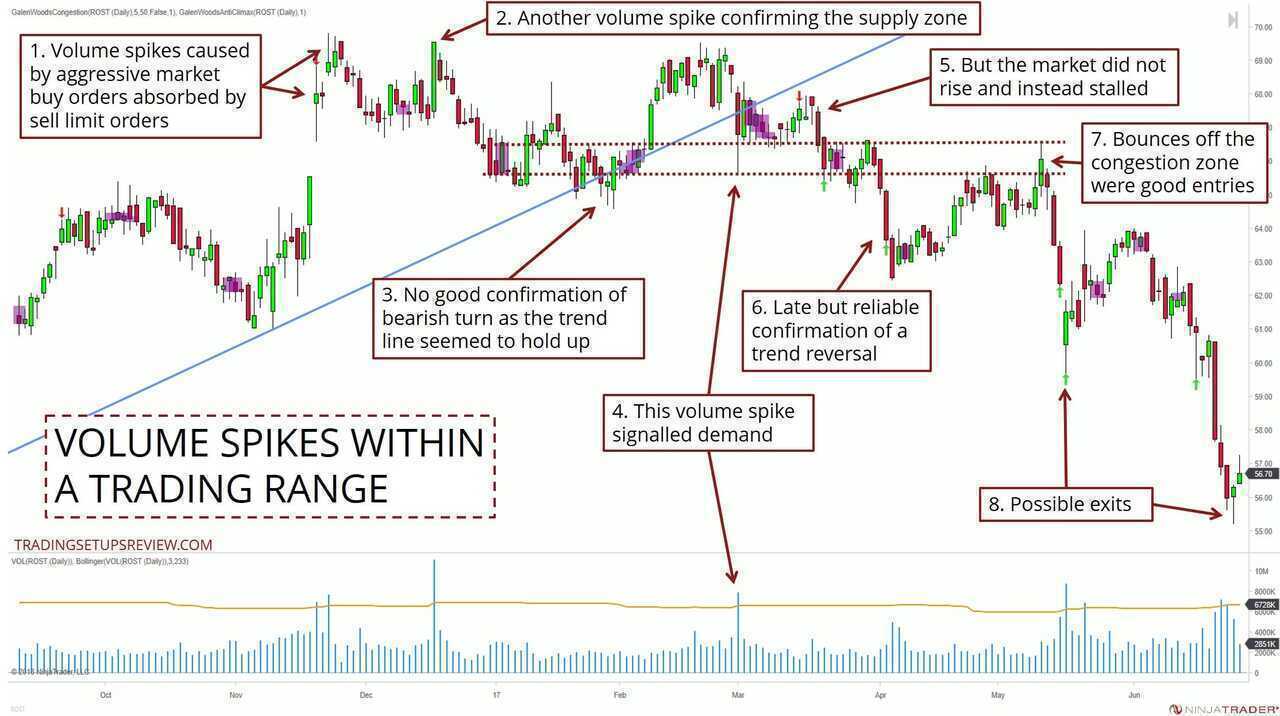
- These bullish gap bars showed heavy volume. It was likely that the buyers met a wall of sell limit orders around this area - a potential supply zone.
- This bullish candlestick was also a volume spike bar. Note that it was followed by a fall that lasted two weeks. This reaction confirmed that the market was met with overhanging supply.
- However, the market did not confirm a trend change as the bull trend line seemed to hold up.
- This volume spike within the trading range created the possibility of returning demand. Was support returning around the bull trend line? Would it hold?
- It did not seem that way. Instead of rising, the market drifted sideways. (Click on the image to enlarge. You will see a red arrow marking out a bearish Anti-Climax pattern - a last-ditch attempt by the bulls.)
- The market could still be within a trading range. (Especially with the volume spike pointed out in Point #4.) Hence, it was prudent to wait for the market to confirm the bearish reversal. And this downside breakout of the trading range was the confirmation we needed.
- These tests of the congestion area were valid triggers for a bearish reversal setup.
- Volume spikes are always helpful for timing your exits to take profit. These two instances were great examples.
Example #3: Trend Change With Ideal Entry and Confirmation
This chart shows the price action of Texas Instruments Incorporated (TXN on NYSE) on a daily timeframe.
Here, we see a mini double-bottom formation presenting a solid bullish entry.
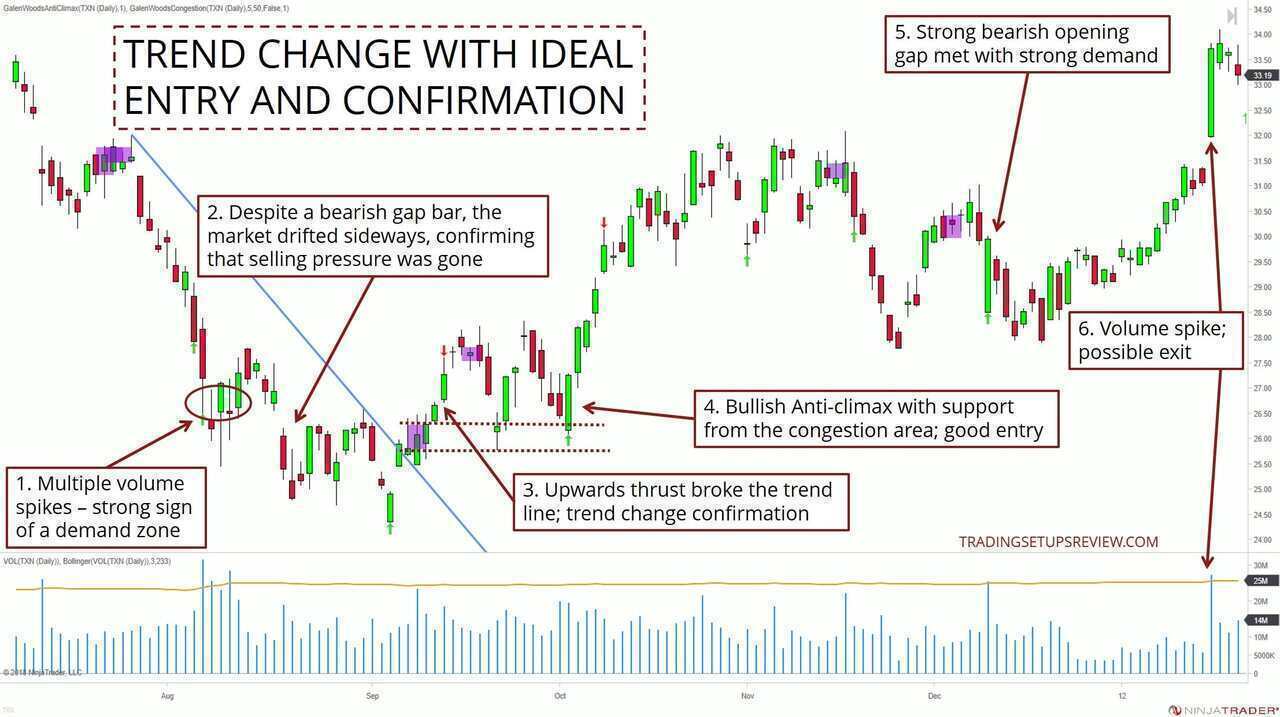
- There were three overlapping candlesticks, each with incredibly high volume. Hence, the market might have hit a demand zone.
- Despite a bearish gap, the market could not push much further below the last trend low. Selling pressure seemed diminished.
- This upthrust, made up of six consecutive bullish candlesticks, punched above the bear trend line. Hence, it confirmed a bullish trend reversal.
- This bullish Anti-Climax pattern found support at a congestion zone level. Taken with the previous swing low, it formed a small double bottom formation. Accordingly, it was an excellent trigger for a bullish reversal trade.
- Another volume spike bar, but here, it opened with a down gap but closed high - a powerful pattern that revealed strong and eager buyers.
- Again, high volume spikes are possible exits.
Conclusion
Finding volume spikes is one of the easiest ways to spot the big players, but it is not the only way.
Sophisticated players know how to minimize their market impact. They will distribute and accumulate positions in smaller volume chunks. To spot them, look for overlapping congestion zones or use a market volume profile.
And even when you do spot the big players, profits are not guaranteed. They offer a great first clue, but the demand and supply puzzle remains unsolved. You need to integrate other market information to determine if a reversal trade is worth the risk.
This approach overlaps with the stopping volume concept in VSA. But here, we paid less attention to the specific bars and focused more on the market context.
Importantly, don’t think of volume spikes as trade signals. Instead, use volume spikes to focus your analysis for potential reversal setups.
Volume spikes form infrequently, but they are fascinating formations worth a closer look. If you want to check out some volume spikes quickly in your favorite markets, use this indicator on TradingView.
The article was first published on 31 August 2018 and updated on 24 September 2021.