Trading the Bollinger Band Squeeze
By Galen Woods ‐ 9 min read
Using Bollinger Bands, the Squeeze finds stocks that are poised to breakout. The Bollinger Squeeze is a unique trading setup that leads to explosive moves.
This Bollinger Bands tutorial introduces the Bollinger Squeeze trading strategy. John Bollinger designed the Bollinger Band Squeeze as a way to profit from markets that are poised to break out of a consolidation area. This innovative tactic uses not just Bollinger Bands but also a related metric called Band Width.
To get an in-depth understanding of the Bollinger Squeeze strategy, we will cover two approaches in this tutorial:
- John Bollinger’s Band Width
- John Carter’s Bollinger Bands with Keltner Channel
Bollinger Bands Explained
First, let’s go through a short primer on Bollinger Bands.
Bollinger Bands form a volatility channel. It is a channel that expands and narrows based on market volatility.
The measure of volatility here is the standard deviation.
Default Parameters
- Type of moving average: Simple Moving Average (SMA)
- Lookback period: 20
- Multiple of standard deviation: 2
Based on the defaults above, the Bollinger Bands form a channel with three moving averages:
- 20-period SMA displaced upwards by two standard deviations (Upper Band)
- 20-period SMA without displacement (Middle Band)
- 20-period SMA displaced downwards by two standard deviations (Lower Band)
The chart below shows the Bollinger Bands applied.
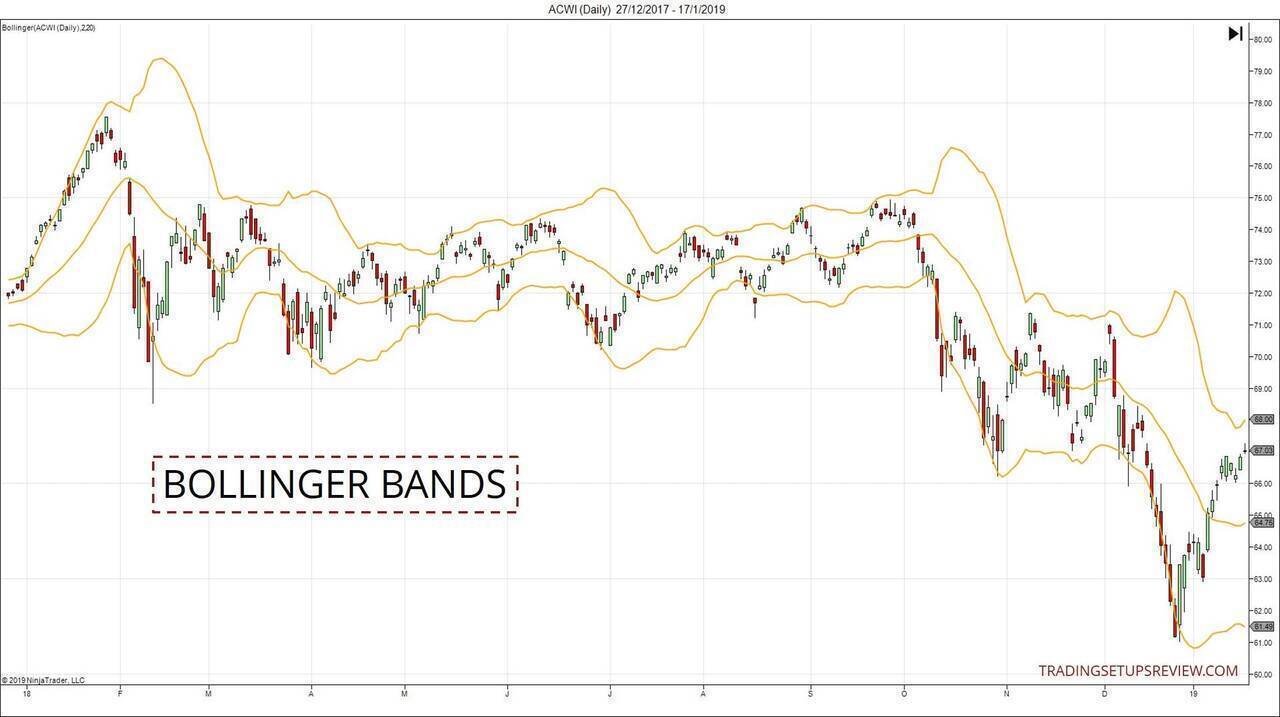
Observe that the market seldom pushes far beyond the Bollinger Bands.
This crucial characteristic is helpful for price analysis.
Learn: How to Trade a Channel
First Method: Bollinger Band Width
What is the Band Width?
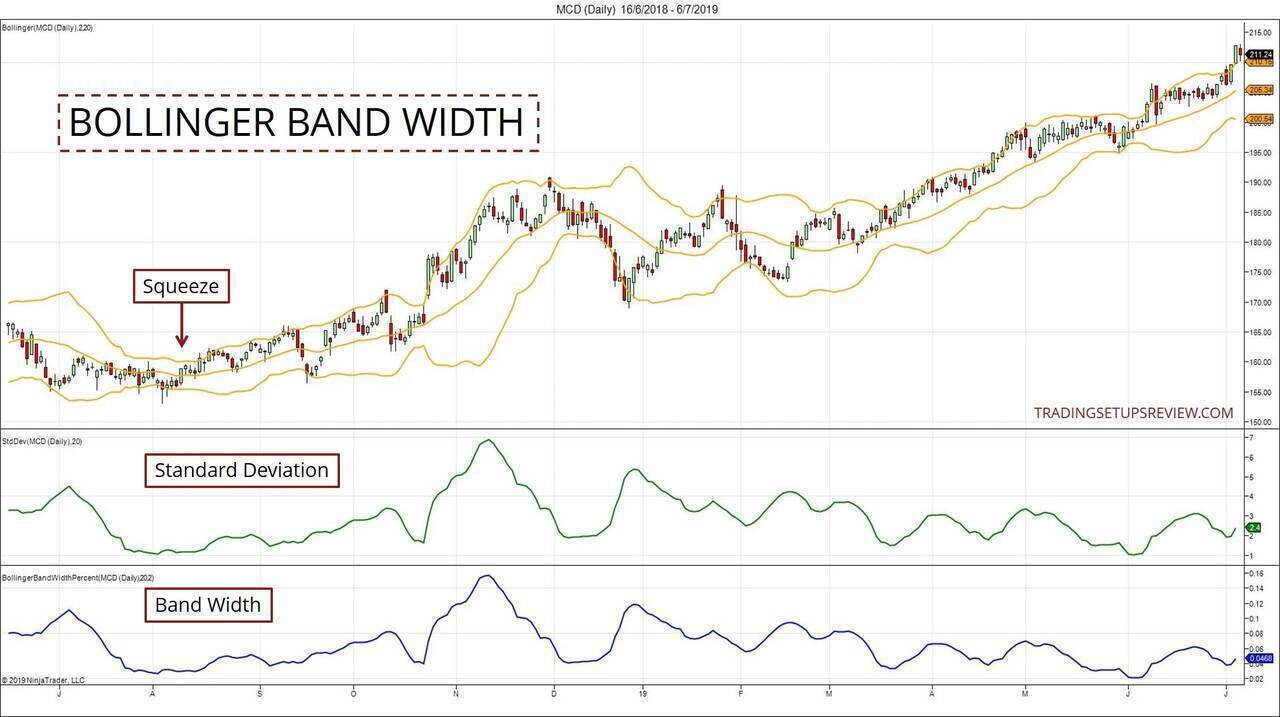
The Band Width is a measure based on the width of the Bollinger Bands.
Band Width = (Upper Band - Lower Band) / Middle Band
What does the Bollinger Band Width show?
- A decreasing Band Width shows decreasing volatility
- An increasing Band Width shows increasing volatility
The Bollinger Band Squeeze trading strategy relies on finding low values of Band Width to identify periods of low volatility.
From there, we get ready for a Bollinger Band breakout from the consolidation area.
If you cannot find Band Width in your charting platform, use Standard Deviation instead.
Although they display different values, they work fine for relative comparison.
Bollinger Squeeze Trading Rules
Long Squeeze
- Wait for the 20-period Band Width to reach its lowest in the past 120 periods*
- Take on a long position when a candlestick closes above the 20-period Bollinger Upper Band
Short Squeeze
- Wait for the 20-period Band Width to reach its lowest in the past 120 periods
- Take on a short position when a candlestick closes below the 20-period Bollinger Lower Band

. Here, we use 120 periods on daily charts as an approximation.
Trading Examples
To highlight the lowest Band Width value in the past 120 periods, the charts below include a Donchian Channel applied on the Band Width values.
Only the Lower Donchian Line is plotted.
Trading Example #1
This chart shows the daily candlesticks of Ameren Corp (NYSE).
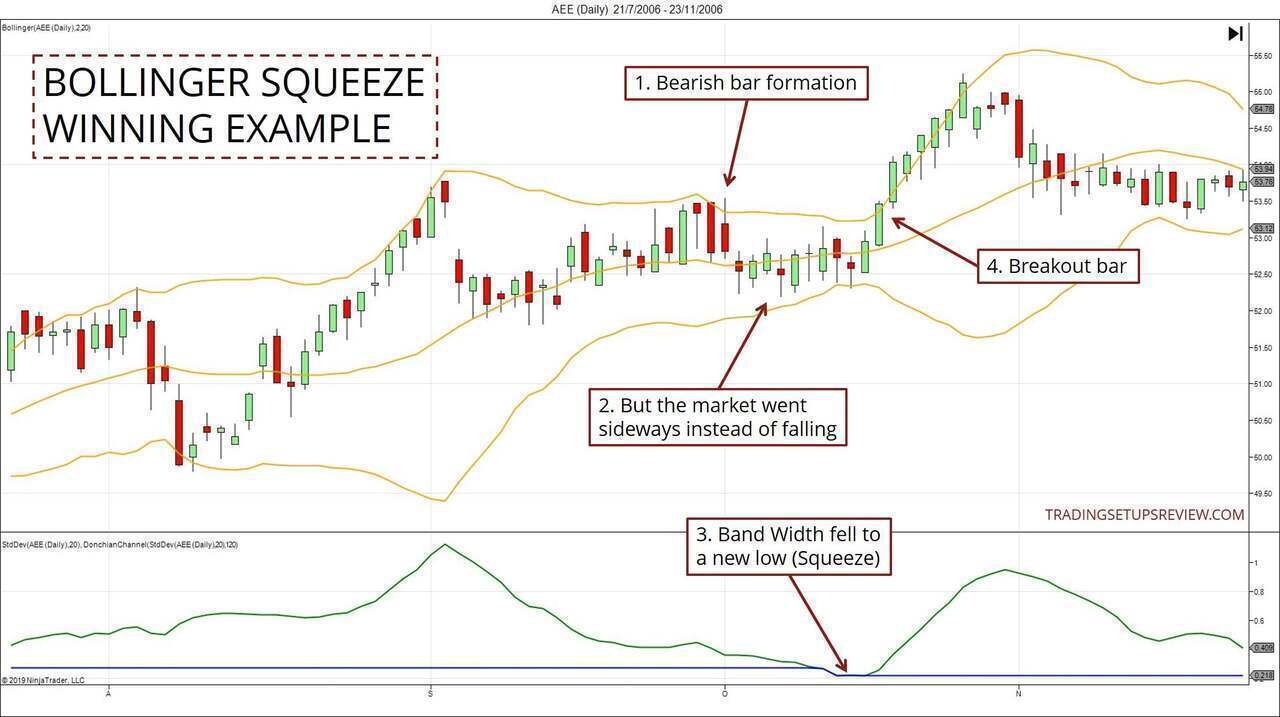
- This tag of the Upper Bollinger Band met stiff resistance. First, a strong bear trend bar formed. Then, the following bar tried to rise above it but ended up as a bearish reversal bar.
- Despite such bearish price formations, the market did not fall much. Instead, it entered a trading range. It hinted at bullish holding power.
- Here, the bottom panel showed that Band Width had dropped to its 120-day low. It signaled a Bollinger Squeeze.
- On 18 October 2006, the market closed above the Bollinger Bands and fired a buy signal. (Notice that the bar preceding this signal bar had a shaved bottom, indicating extreme bullishness.)
The market continued rising over the next six bars, concluding with a profitable swing trade.
Trading Example #2
The chart below shows a failed Bollinger Bands breakout followed by a successful one.
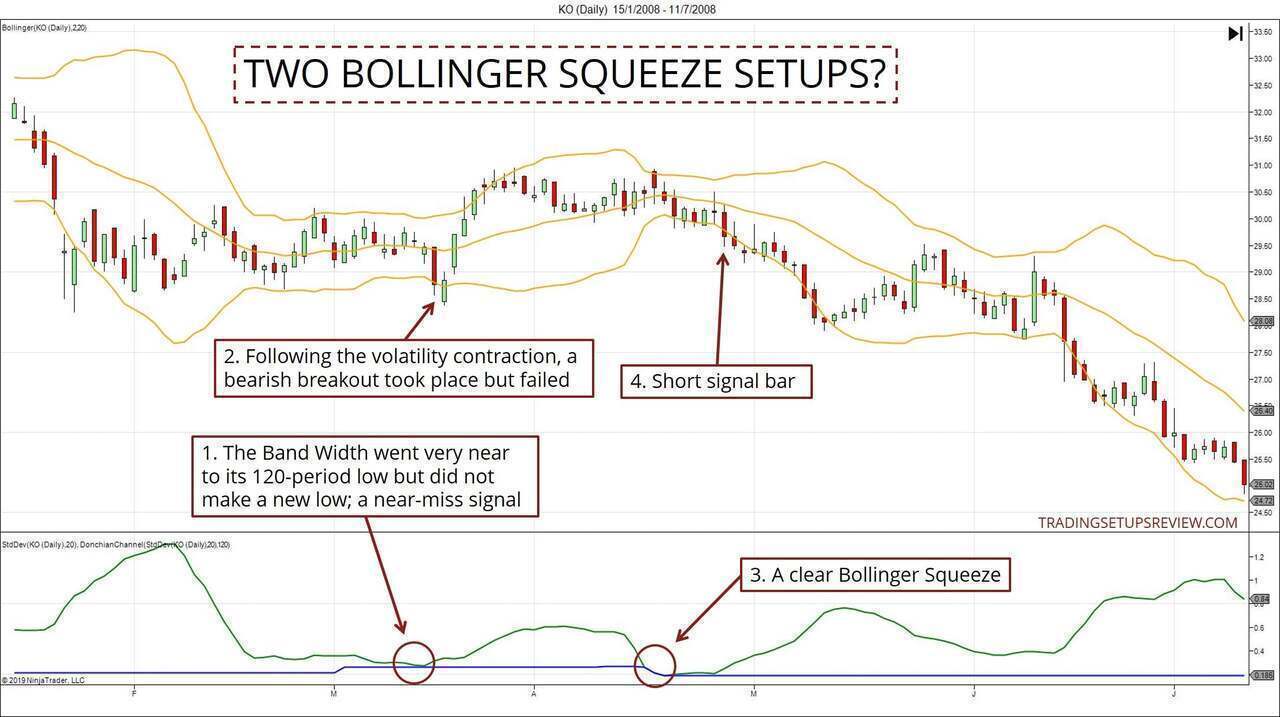
- The Band Width hovered above the 120-period low. While it was not a technical Bollinger Band Squeeze signal, you can still interpret it as a volatility contraction.
- This bearish breakout followed the contraction. However, the market rejected it straightaway.
- This second volatility contraction presented a clear Bollinger Squeeze signal, with the Band Width pushing to new lows.
- This bearish trend bar closed below the Bollinger Bands and fired a short signal.
This example highlights a crucial principle for trading breakouts: the longer the period of consolidation, the more likely you will find a successful breakout.
Trading Example #3 - Losing Trade
This chart shows the daily candlesticks of Bristol Myers Squibb Co. (BMY) listed on NYSE.
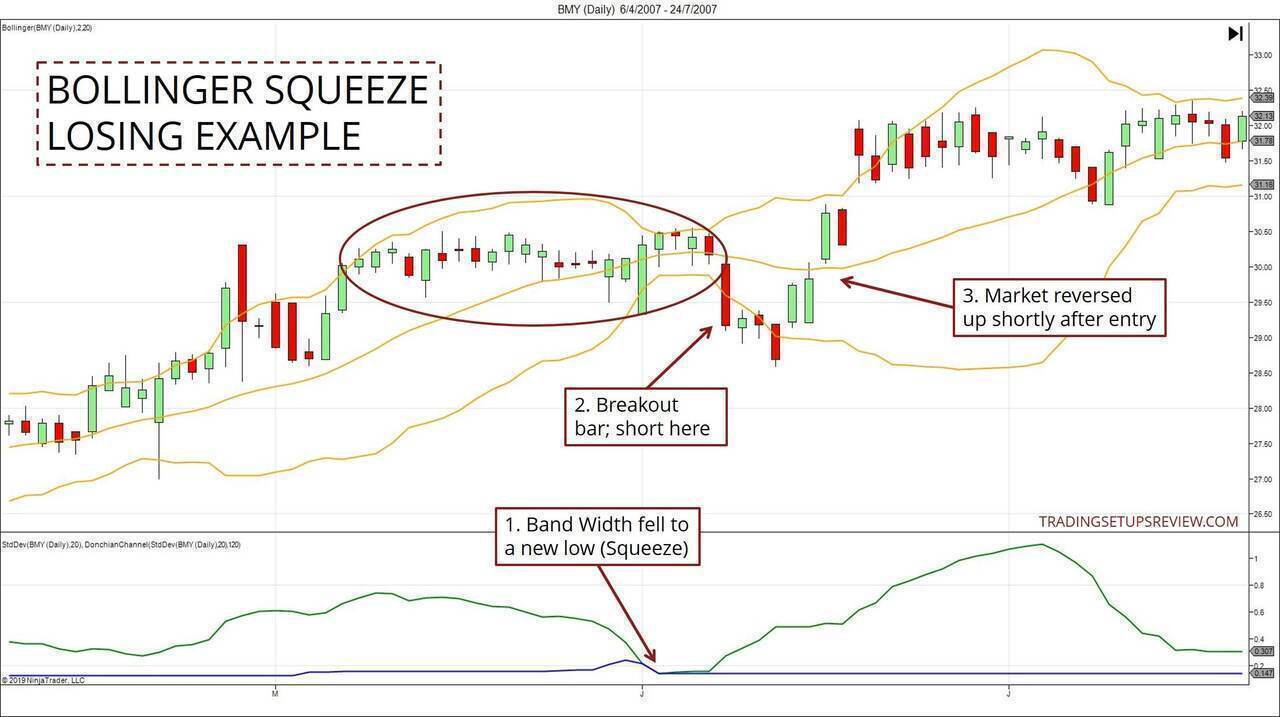
- Here, the Band Width dropped to its 120-day low to signal a Bollinger Squeeze. We braced ourselves for a breakout in either direction.
- On 8 June 2007, the day closed below the Bollinger Bands and signaled a short entry.
- However, the market did not follow through. It fell a little beyond our entry before reversing up.
Without over-analyzing, glance at the trading range before the breakout (the circled area). What do you see?
More green than red.
It was a sign that the buying pressure dominated despite the sideways action.
On top of that, before the Bollinger Squeeze, there was an existing upwards trend. Counter-trend breakouts, like the one in this example, have a lower probability of success.
Bonus Example: Bollinger Squeeze on TSN Daily
Second Method: Bollinger Bands With Keltner Channel
In Mastering The Trade, John Carter popularized another method to identify a volatility squeeze. (Also known as TTM Squeeze or Carter Squeeze)
His trading approach combines Keltner Channel and Bollinger Bands. If you are already familiar with Keltner Channel, you might prefer this technique.
In John Bollinger’s version, he focused on comparing Band Width with its historical values. Hence, you get a Bollinger Band Squeeze if the market displays low volatility when compared to its recent history.
John Carter takes a different approach. As you’ll see from the rules below, this alternative takes advantage of the difference between two types of volatility envelopes.
Criteria For Bollinger Squeeze (With Keltner Channel)
The rules below are adapted from John Carter’s concepts in his book - Mastering The Trade. For the original explanation, please refer to the book.
- Bollinger Bands: 20-period, 2 standard deviations
- Keltner Channel: 20-period, 1.5 ATRs
You can experiment with the volatility settings (standard deviation and ATR). But you should keep the lookback period consistent for both envelopes for meaningful comparisons.
A Squeeze is identified when the Bollinger Bands is entirely within the Keltner Channel.
Trading Examples
Example #1 - Identifying Squeezes With Keltner Channel
In the examples below, you will find the Bollinger Bands in orange and the Keltner Channel in blue.
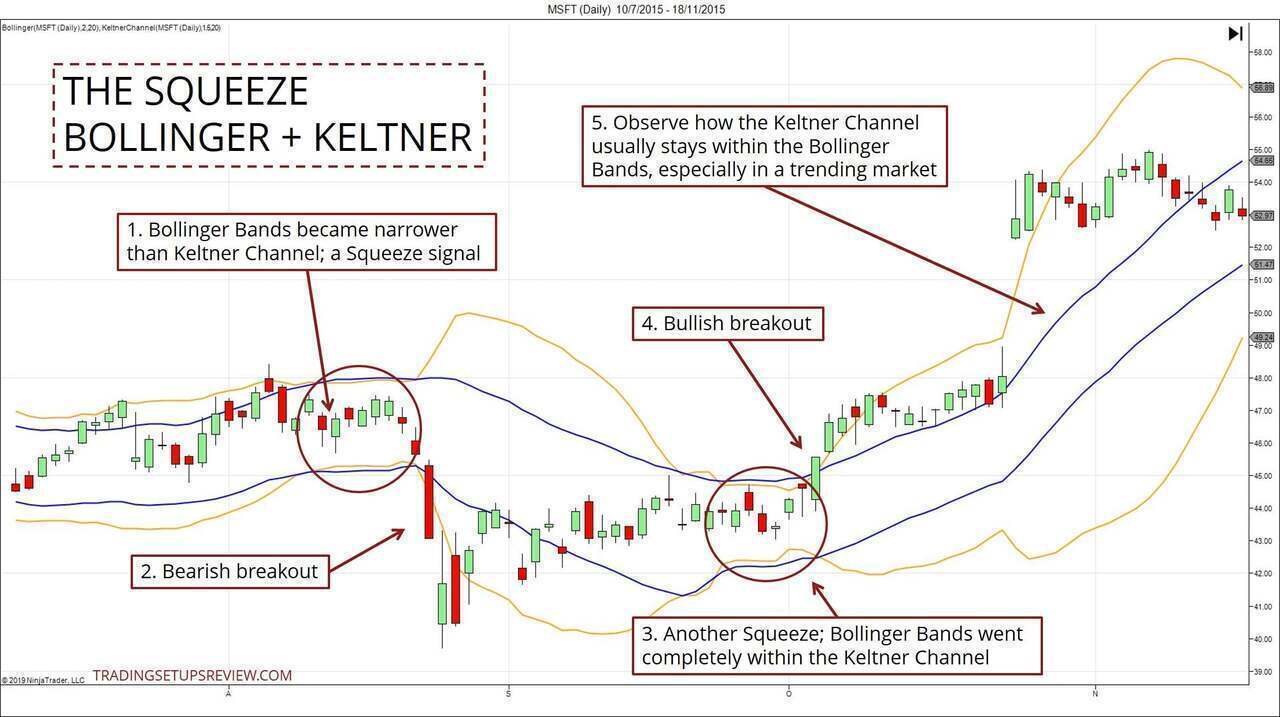
- As the market went sideways, the Bollinger Bands became narrower. When it nested completely within the Keltner Channel, a Squeeze signal is confirmed.
- This candlestick was the first bar of a bearish breakout from the Squeeze. It did not enjoy much followthrough before meandering sideways again. From a price action perspective, you can interpret this arrested bearish thrust as a sign that the bulls were still in control.
- Another Squeeze signal here.
- This bullish trend bar confirmed the breakout from the Squeeze. This setup was excellent, considering the bullish context highlighted in Point #2.
- To appreciate this approach better, observe how the Bollinger Bands interact with the Keltner Channel. Most of the time, especially in trending markets, the Keltner Channel is narrower than the Bollinger Bands.
Example #2 - Comparing Two Approaches For Bollinger Squeezes
When examining trading strategies, it is constructive to compare similar ones.
The chart below shows both the Band Width approach and the Keltner Channel method.
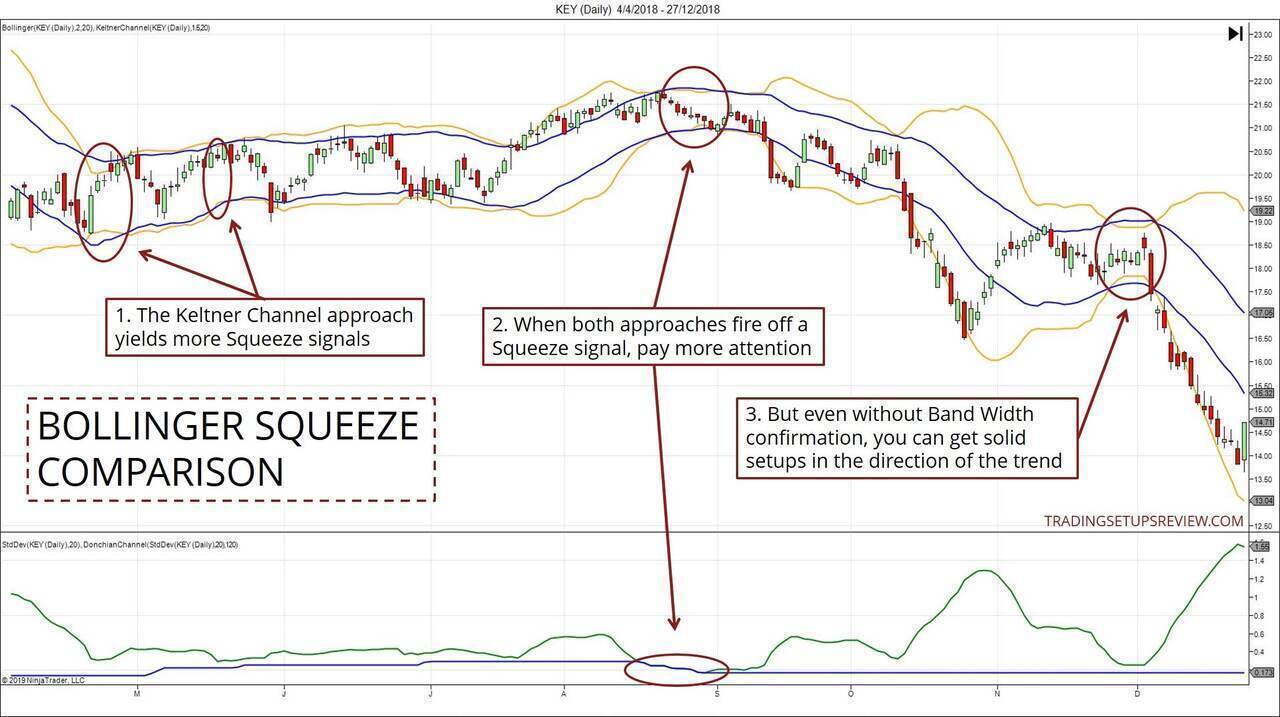
- With the settings in this tutorial, the Keltner Channel approach yields more Squeeze signals.
- This Squeeze signal enjoyed confirmation from both sets of indicators. Such signs precede strong breakouts.
- However, even without Band Width confirmation, you can find excellent breakout trades if you pay attention to price action. In this case, the breakout from the Squeeze was also a continuation of the bearish trend.
Review - Bollinger Squeeze Trading Strategy
The Bollinger Squeeze setup makes use of a sound trading concept: volatility cycles. Its premise is that high volatility follows low volatility.
Periods of low volatility are painful to trade due to false breakouts.
The Squeeze highlights record periods of low volatility when it is safer to look for breakouts.
This tactic is handy for trading options as it pinpoints explosive price moves following periods of low volatility.
However, such breakout plays are prone to failures (called ‘head fakes by John Bollinger in his book). Hence, looking for subtle price action clues in the trading range leading up to the breakout is invaluable. Of course, trading with the last established trend also increases your winning odds.
In Bollinger on Bollinger Bands, John Bollinger also explained how to avoid false breakouts with volume analysis.
The alternative approach to identifying a Squeeze uses the Keltner Channel in addition to the Bollinger Bands.
A vital feature of this tactic is that you do not need to create a separate panel on your chart. Hence, on top of highlighting Squeezes, it also allows you to analyze price action with the help of the volatility envelopes.
Here are two tutorials on how to analyze price action with the help of volatility bands:
Bonus: Bollinger Band Squeeze Resources
Bollinger Squeeze Scans & Indicators
- SwingTradeBot Bollinger Squeeze Scan - A scanner designed for swing traders by Trader Mike
- Squeeze Momentum Indicator - For TradingView users (Keltner Channel approach)
- Bollinger Band Squeeze Highlighter and Exploration - AFL code for Amibroker users. (Keltner Channel)
- TradeStation TTM Squeeze - Carter’s approach (paid app)
- Thinkorswim TTM_Squeeze - Carter’s approach
- NinjaTrader Bollinger Band Squeeze - For NT7 and NT8
There are various ways and settings you can apply to find Bollinger Squeezes. Hence, the scans and indicators might not be the same.
To have more control over the signals you’re getting, you need to write your own code or to nest and combine indicators like what I did for the examples above.
Bollinger Band Squeeze Breakout Strategy Backtests
- Bollinger Bands Trading Strategies Put To The Test [PDF] - Backtest results and code from JB Marwood of four Bollinger Bands strategies, including the Squeeze.
- Popularity versus Profitability: Evidence from Bollinger Bands [PDF] - An academic approach to backtesting the Bollinger Band Squeeze, showing its decreasing predictive power. A cautionary note to anyone who intends to trade it mechanically.
The article was first published on 4 March 2012 and updated on 15 August 2019.