10 Price Action Bar Patterns You Must Know
By Galen Woods ‐ 8 min read
Bar patterns are nifty tools for every price action trader. Here are 10 bar patterns that you must know, complete with trading examples and resources.
Bar patterns are nifty short-term patterns that are useful for timing trades and finding logical stop-loss points. No price action trader can do without learning about bar patterns.
So these are 10 bar patterns that you must know.
Reversal Bar Patterns
1. Reversal Bar
2. Key Reversal Bar
3. Exhaustion Bar
4. Pinocchio Bar
5. Two-Bar Reversal
6. Three-Bar Reversal
7. Three Bar Pullback
Volatility Bar Patterns
8. Inside Bar
9. Outside Bar
10. NR7
Learn more: Price Action Trading Resource Guide
1. Reversal Bar Pattern
What does it look like?
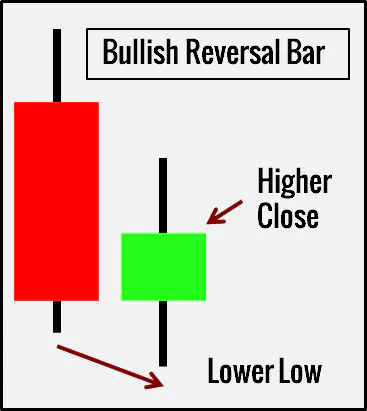
A bullish reversal bar pattern goes below the low of the previous bar before closing higher.
A bearish reversal bar pattern goes above the high of the last bar before closing lower.
What does it mean?
For the bullish pattern, the market found support below the low of the previous bar. Not only that, the support was strong enough to push the bar to close higher than the previous bar. This is the first sign of a possible bullish reversal.
For the bearish pattern, the market met resistance above the high of the previous bar. Furthermore, the resistance was powerful enough to cause the current bar to close lower.
How do we trade it?
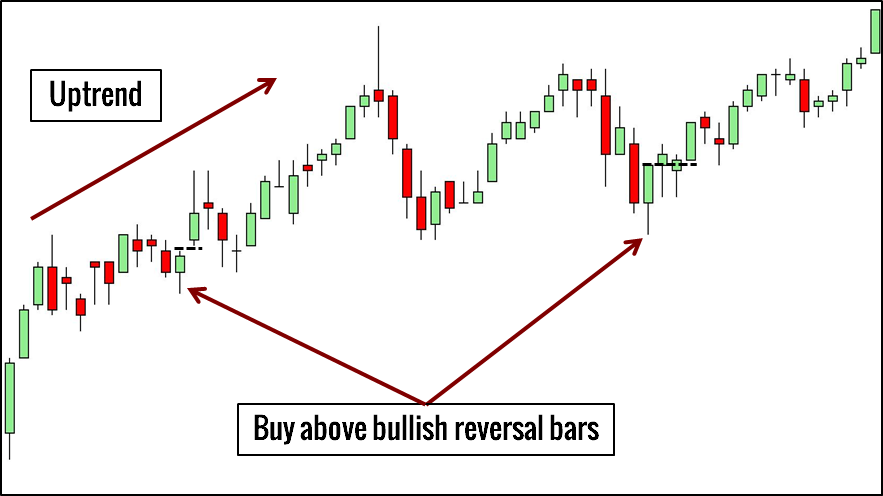
- Buy above the bullish reversal bar in an uptrend
- Sell below the bearish reversal bar in a downtrend
2. Key Reversal Bar
What does it look like?
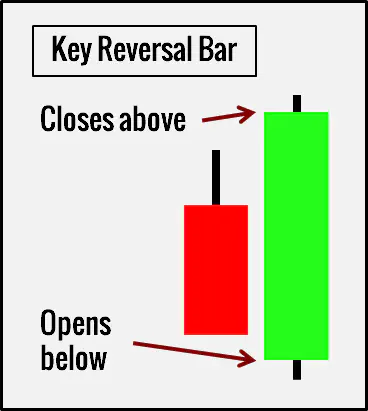
A key reversal bar is a particular instance of a reversal bar that shows clearer signs of a reversal.
A bullish key reversal bar opens below the low of the previous bar and closes above its high.
A bearish key reversal bar opens above the high of the previous bar and closes below its low.
By definition, key reversal bars open with a price gap. As gaps within intraday time frames are rare, you will find most key reversal bars in the daily and above time-frames.
What does it mean?
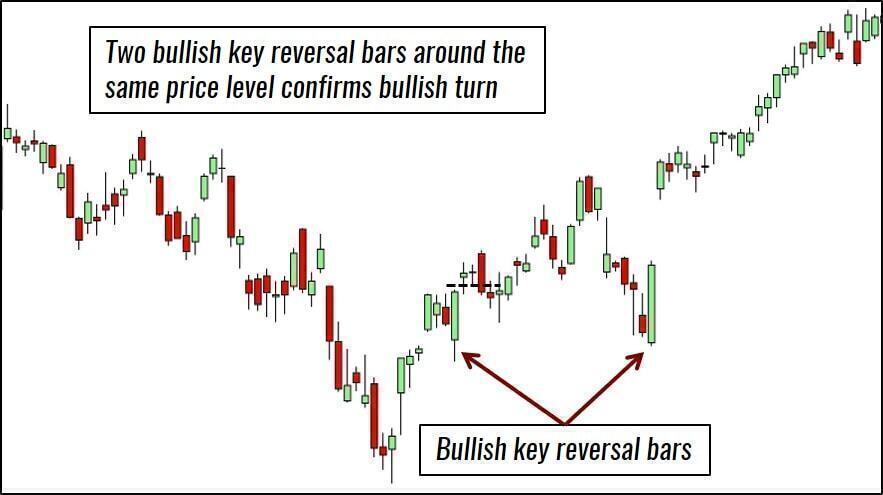
A down gap is a powerful down thrust. When the market rejects such a strong bearish move with certainty, it might have reversed its sentiment to bullish.
On the other hand, when a gap upwards bumps into clear resistance, the market might have turned bearish.
Essentially, a key reversal bar is a violent display of strength that hints at a change of market sentiment.
How do we trade it?
- Buy above a bullish key reversal bar (If uncertain, wait for the price to close above it before buying.)
- Sell below a bearish key reversal bar (If unsure, wait for the price to close below it before selling.)
3. Exhaustion Bar
What does it look like?
A bullish exhaustion bar opens with a gap down. Then, it works its way up to close near its top.
A bearish exhaustion bar opens with a gap up before moving down to close as a bearish bar.
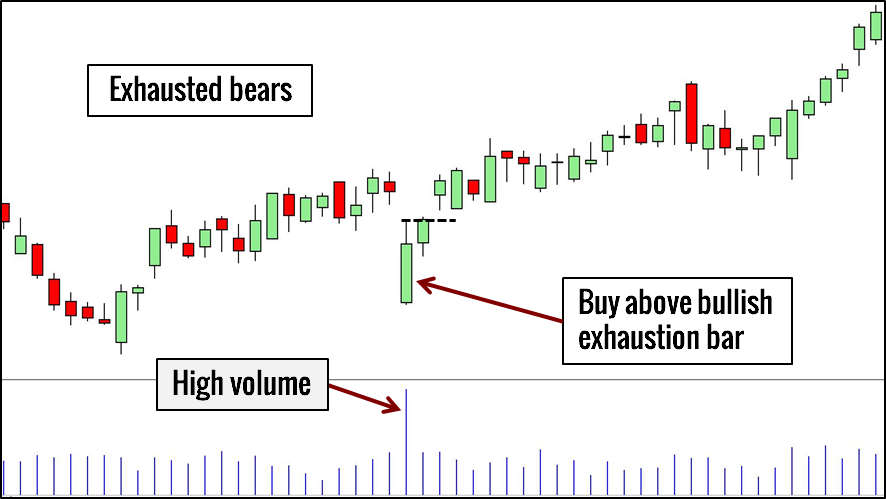
In both cases, the gap remains unfilled. Also, high volume should occur with the exhaustion bar.
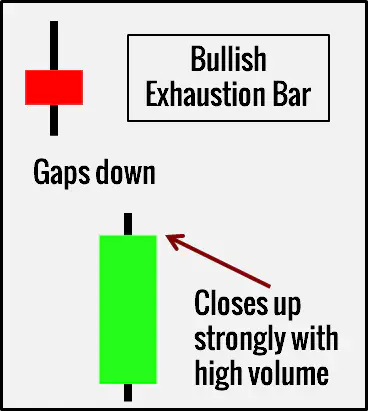
What does it mean?
Its name explains it all. It represents exhaustion and a failed last-ditch attempt.
After the bears are exhausted, the bulls will take over, and the market will rise.
After the bulls are exhausted, the bears will take the market down.
How do we trade it?
- Buy above a bullish exhaustion bar
- Sell below a bearish exhaustion bar
Read: Exhaustion Gap Trading
4. Pinocchio Bar (Pin Bar)
What does it look like?
It resembles the nose of Pinocchio. It has a long and distinct tail.
For bullish pin bars, the lower tail takes up most of the bar. For bearish pin bars, it is the upper tail that dominates.
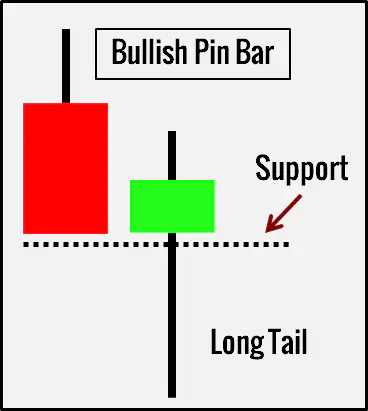
What does it mean?
Paraphrasing Martin Pring, the pin bar lies like Pinocchio.
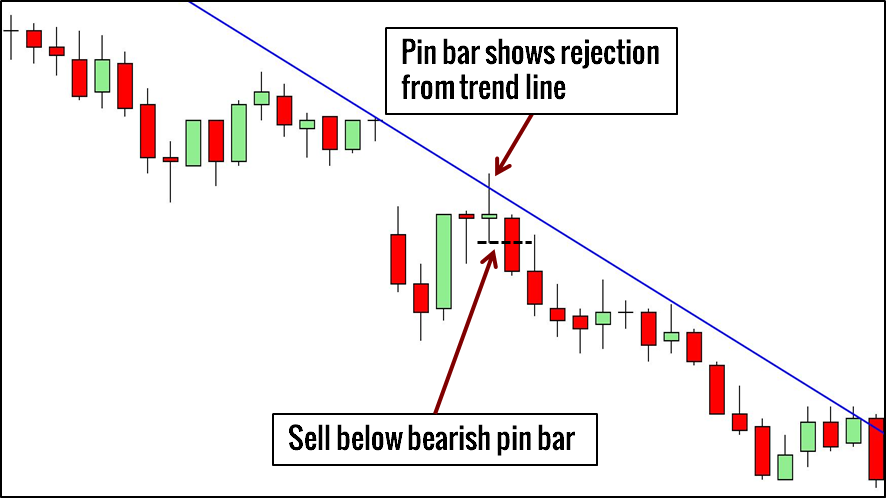
With its long tail, a pin bar breaks a support or resistance momentarily to trick traders into entering the wrong direction. These traders are trapped, and there is often money to be made when you find trapped traders.
How do we trade it?
- Buy above a bullish pin bar that is rejected from support level
- Sell below a bearish pin bar that is rejected from a resistance level
Find more pin bar examples here.
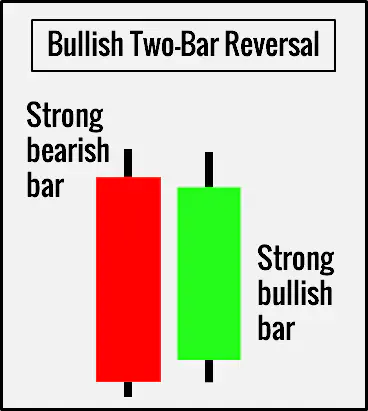
5. Two-Bar Reversal
What does it look like?
The two-bar reversal pattern is made up of two strong bars closing in opposite directions.
The bullish variant consists of a strong bearish bar followed by a bullish bar. Reverse the order to get its bearish counterpart.
What does it mean?
Every reversal pattern works on the same premise. A clear rejection of a downward thrust is a bullish reversal, and a clear rejection of an upthrust is a bearish reversal.
In this case, the first bar represents the first thrust, and the second bar represents its rejection.
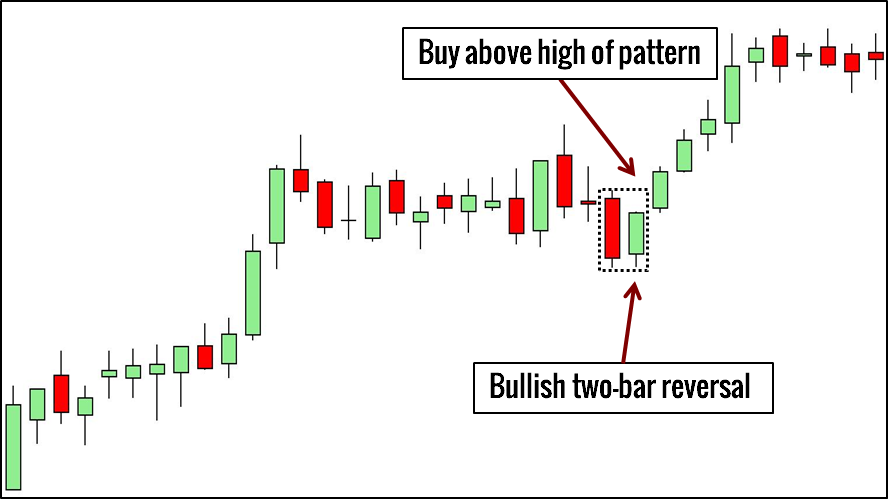
How do we trade it?
- For bullish reversals, buy above the highest point of the two-bar pattern.
- For bearish reversals, sell below the lowest point of the two-bar pattern.
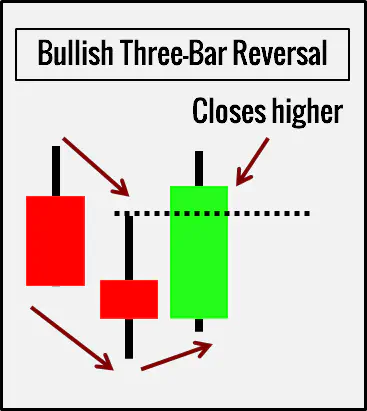
6. Three-Bar Reversal
What does it look like?
In sequence, the three bars of the bullish pattern are:
- A bearish bar
- A bar has a lower high and lower low
- A bullish bar with a higher low and closes above the high of the second bar
Accordingly, the bearish pattern is made up of:
- A bullish bar
- A bar has a higher high and higher low
- A bearish bar with a lower high and closes below the low of the second bar
What does it mean?
A three-bar reversal pattern shows a turning point. Compared to the other reversal patterns, the three-bar reversal pattern is the most conservative one as it extends over three bars, using the third bar to confirm that the market has changed its direction.
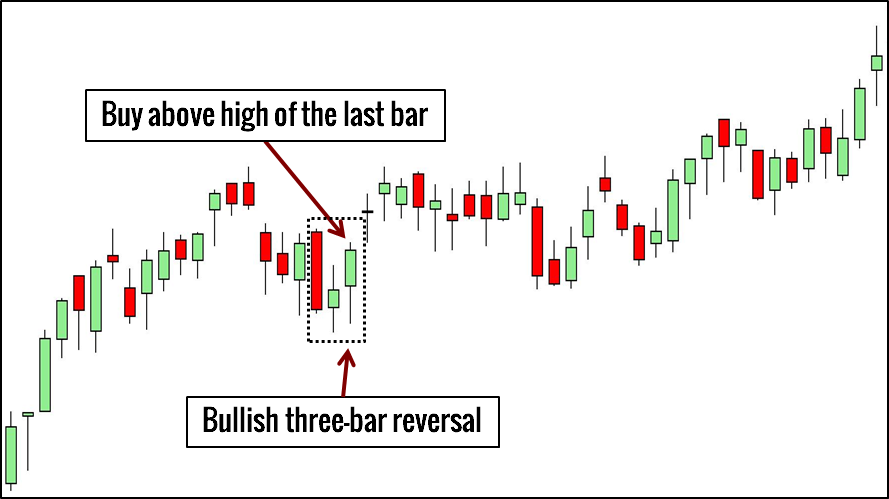
How do we trade it?
- Buy above the last bar of the bullish pattern
- Sell below the last bar of the bearish pattern
Read: Adapting the Three-Bar Reversal for Day Trading
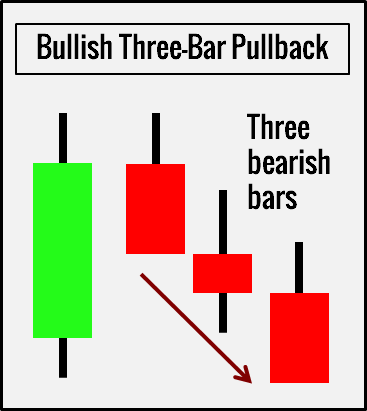
7. Three-Bar Pullback
What does it look like?
This bar pattern is easy to identify.
Three consecutive bearish bars form a bullish pullback pattern, and three consecutive bullish bars form a bearish pullback pattern.
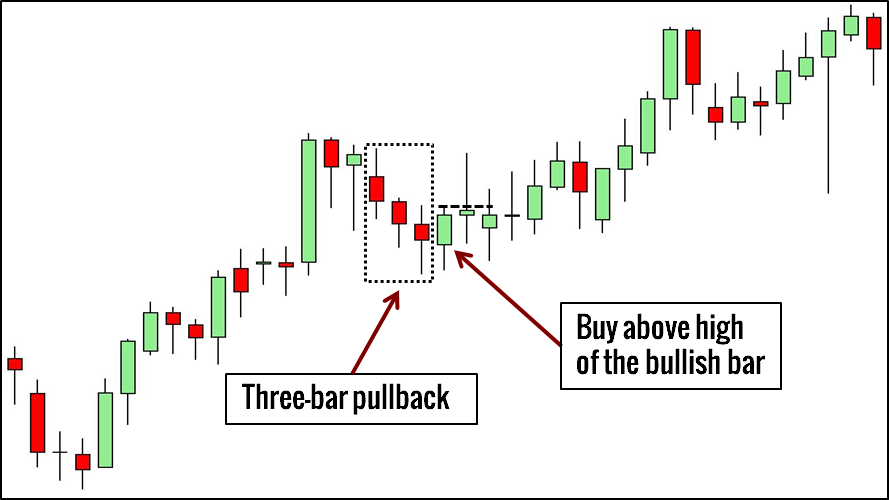
What does it mean?
When the market is trending, it is hard to sustain a counter-trend pullback. Hence, after a pullback of three bars, the trend is ready to resume.
How do we trade it?
- Within a bull trend, wait for three consecutive bearish bars. Then, buy above the next bullish bar.
- Within a bear trend, wait for three consecutive bullish bars. Then, sell below the next bearish bar.
Read: Improving the Three-Bar Pullback
8. Inside Bar
What does it look like?
An inside bar must stay completely within the range of the bar immediately before it. In other words, the second bar must have a lower high and a higher low.
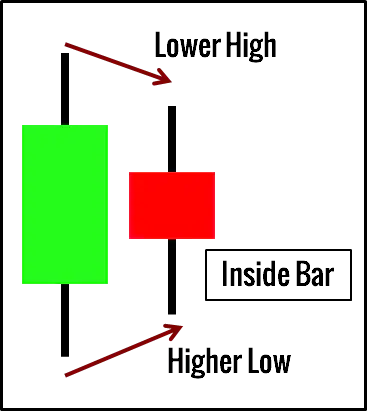
What does it mean?
An inside bar is a contraction in price range/volatility. Within the same unit time, the market covers less ground and stays completely within the range of the previous bar.
It is a pause in price action and does not show clear strength in either direction.
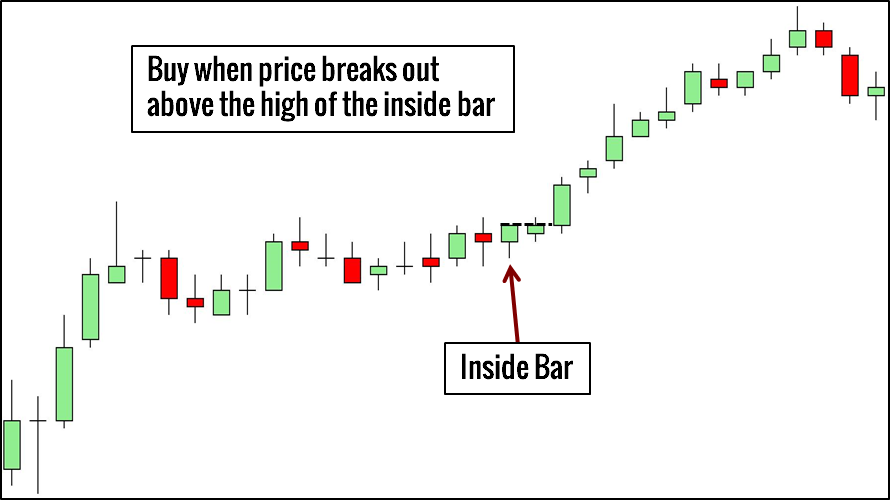
How do we trade it?
- Place bracket orders around it to trade its breakout in either direction. (A buy stop order above its high, and a sell stop order below its low. Once one order is triggered, cancel the other.)
- Place only one order (buy or sell) according to the market trend.
- Wait for a breakout of the inside bar and trade its failure.
Read: A Twist on the Inside Bar
9. Outside Bar
What does it look like?
An outside bar pattern is the polar opposite of an inside bar.
Its range must exceed that of the previous bar with a higher high and a lower low.
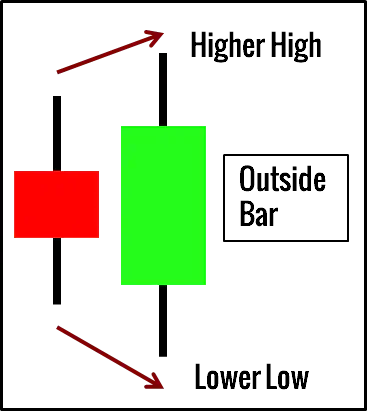
What does it mean?
It is a short-term expansion in price range/volatility. It shows strength in both directions.
In most cases, it is uncertain if the bulls or the bears have won. The only certainty is the increased volatility.
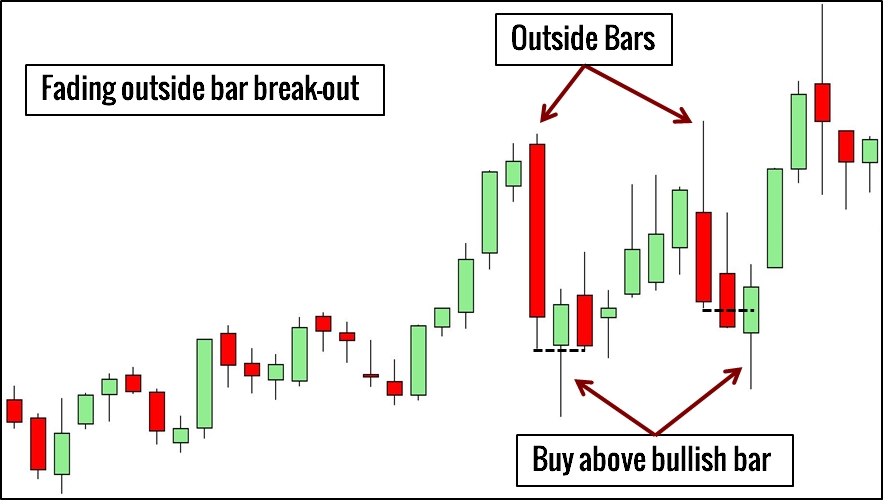
How do we trade it?
- Wait for a break-out of the outside bar and fade it. (Especially for outside bars that look like dojis, or those that go against the trend.)
- Trade its break-out, especially when the outside bar closes near its top or bottom. (e.g., Popgun Pattern)
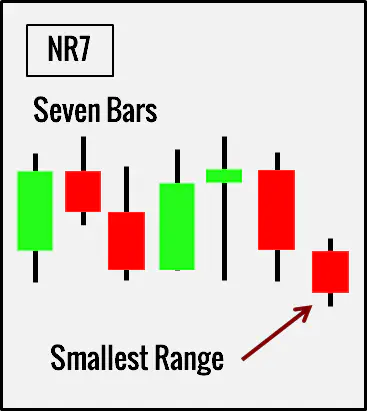
10. NR7
What does it look like?
This bar pattern requires seven bars. If the last bar has the smallest bar range within the sequence, it is an NR7 pattern.
To clarify, bar range refers to the difference between the high and the low of a bar.
What does it mean?
Like the inside bar, it indicates decreasing volatility.
As the lower volatility comes within the context of seven bars, instead of a single bar like in the case of an inside bar, the NR7 pattern is a stronger sign of decreasing volatility.
However, while the inside bar shows no strength in either direction, the NR7 pattern might drift upwards or downwards. In such cases, the NR7 represents a price thrust with decreasing volatility.
As the market alternates between range contraction and range expansion, the NR7 alerts us to standby for explosive moves.
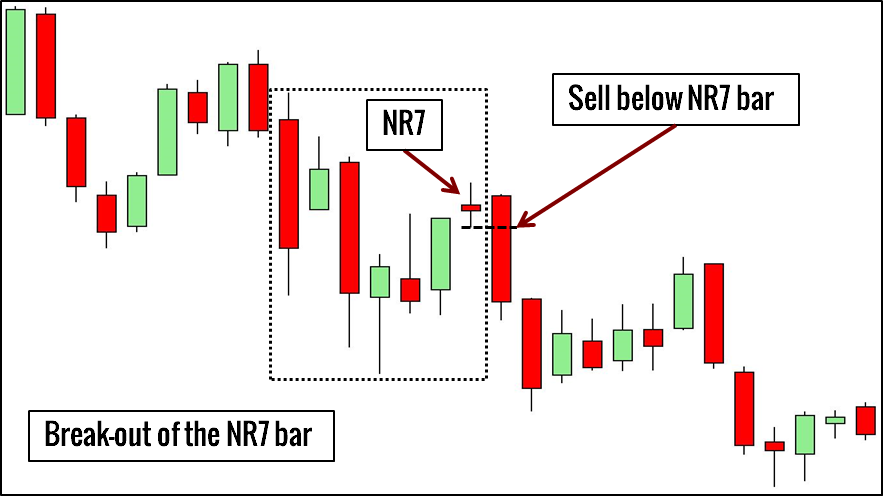
How do we trade it?
- Buy break-out of the high of the last bar if the trend is up
- Sell break-out of the low of the last bar if the trend is down
Read: NR7 Trading Strategy
What’s Next?
Hybrid Patterns
These ten patterns are not mutually exclusive. In fact, many combinations produce valid bar patterns.
Here are some examples:
- ID/NR4 combines an inside bar with a variant of NR7
- Reversal bar after a three-bar pullback
- Two-bar reversal with an inside bar as the second bar
Beyond Bar Patterns
Bar patterns alone will not offer a trading edge.
Common strategies incorporate market bias analysis, chart patterns, and volume analysis into the mix. Bar patterns form just one facet of a price-based trading approach.
Bar patterns represent just one aspect of a price-based trading plan.