How To Uncover Price Action Trading Patterns From Scratch
By Galen Woods ‐ 8 min read
This guide shows you how to unearth powerful price action trading patterns and build up your understanding of market price action to help you trade better.
Are you fascinated by price action trading patterns? Have you learned about candlestick patterns like the Engulfing and Harami? Have you studied volatility patterns like the NR7 or the ID/NR4?
If you answered yes to the questions above, then you must’ve wondered about their origins.
More importantly, you must’ve wondered how you can uncover price action trading patterns?
You don’t have to wait any longer. In this tutorial, we’ll show you, step-by-step, how to uncover price action trading patterns.
Before we proceed, let’s push two mental blocks out of the way.
First, recognize that no one has a monopoly on price action trading patterns.
Some traders might try to hold on to the right to name them. But the price patterns themselves belong to no one. So don’t be afraid to seek out and trade patterns you observe in the market.
Next, let me assure you that price action trading patterns are nothing mysterious. Neither are they extremely sophisticated. With practice, you can uncover them too, and you can start right now.
However, you must be prepared to work hard and put many hours into studying price charts.
Now, we’re ready to begin.
Uncovering Price Action Trading Patterns: Step-By-Step Guide
We will go through the process step-by-step with the help of an example to show you precisely what you need to do.
Then, we’ll review an extra example to help you reinforce it. In no time, you’ll be looking for intriguing price action trading patterns yourself. You might even start to enjoy the process of reviewing price charts.
Here, we will focus on simple price patterns that span two to three price bars (or candlesticks). But you can apply the same process to find other pattern types.
Here is an overview of the four steps:
- Open a clean chart
- Draw a line to determine the bias
- Circle your ideal entries
- Distill helpful observations
Rinse and repeat.
Step #1: Getting The Basics
Open a blank candlestick chart.
Adjust the zoom level of your chart to show around 200 candlesticks. For daily candlestick charts, you can load the price data for the past year.
(For our purpose, I’ll refer to candlestick and bar interchangeably. Both candlesticks and traditional price bars contain the same amount of price information.)
This image below shows a clean candlestick chart of Microsoft Inc (MSFT) daily prices. We’ll use this chart as an example to explain the following steps.
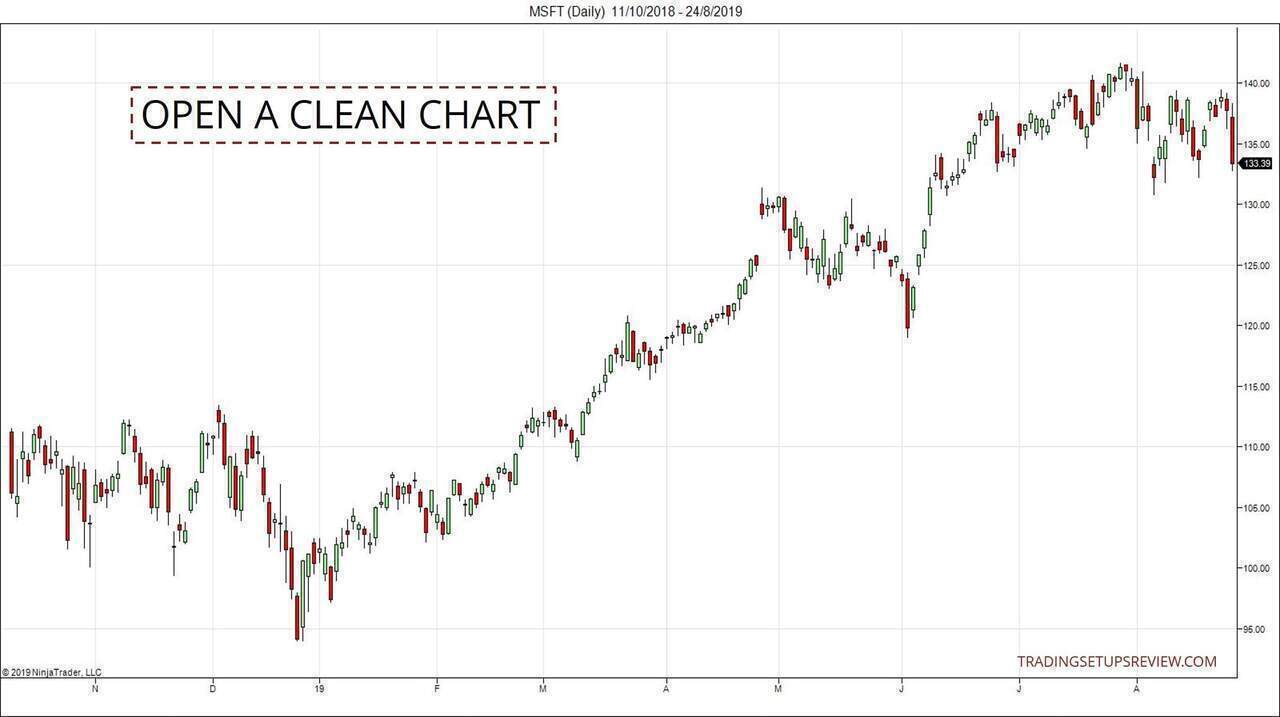
A few points to note:
- Load a standard candlestick chart (Not Heiken-Ashi, Renko, or any other enhanced chart types.)
- Make sure there are no indicators loaded.
If you need a charting platform, I recommend NinjaTrader or TradingView.
Step #2: Focus With A Bias
To look for price action trading patterns, we need to review candlestick charts.
But to the uninitiated, a candlestick chart is like an expanse of wilderness. How do we start?
This step helps us to focus our attention by giving us a market bias as an anchor.
Draw a line connecting the first candlestick (left-most) to the last candlestick (right-most).
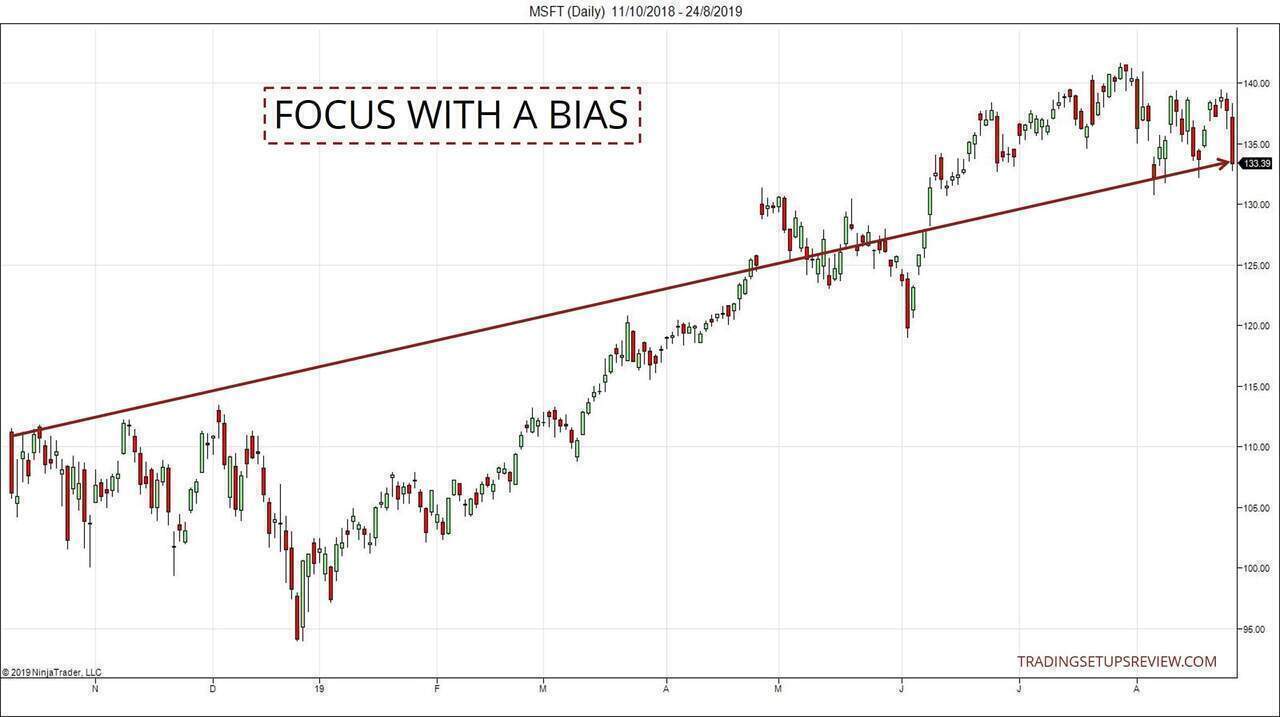
- If this line slants up (like the chart above), you will review your price chart with a bullish bias. In the next step, you are only interested in buying.
- If this line slants down, you will review your chart with a bearish bias. Within this context, you are only interested in selling.
- If the line is more or less horizontal, review your chart to look for entries in both directions.
Step #3: Find Ideal Entry Points
Circle the turning points you would, ideally, like to buy or sell at.
As explained in the last step, in the chart here, we are only interested in points to go long (i.e., buy).
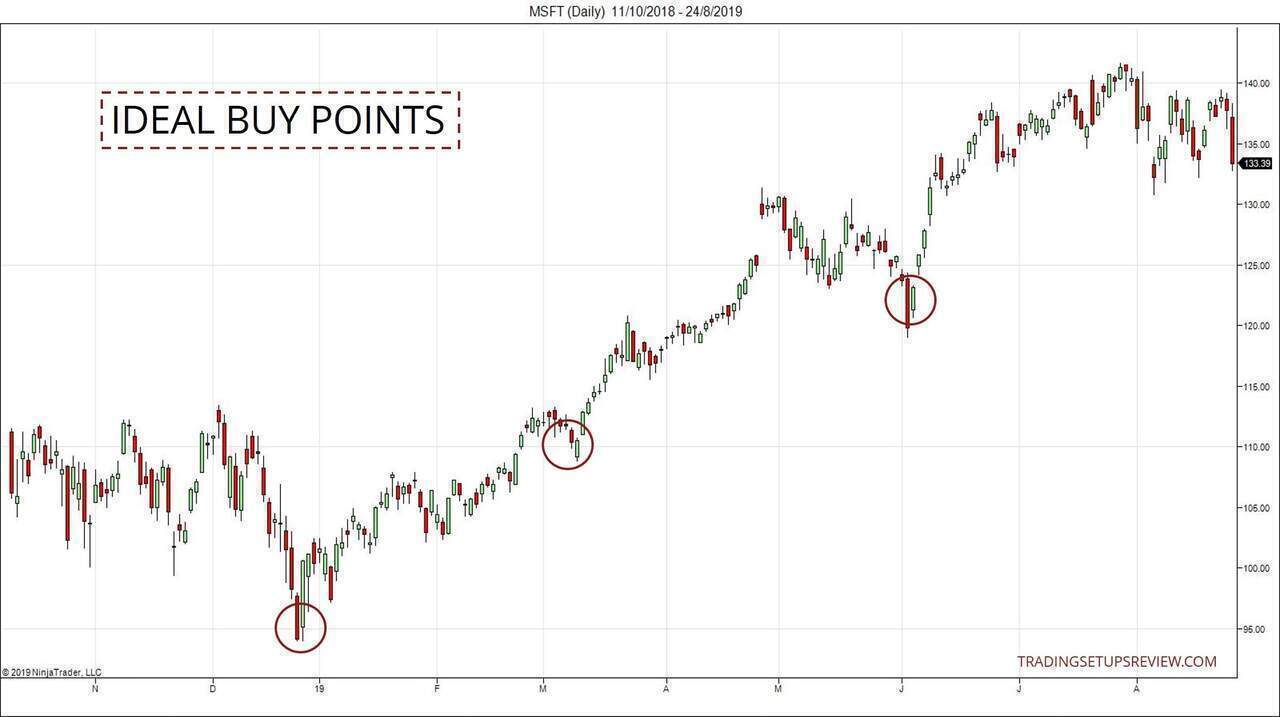
There is no correct answer here. Everyone will choose different points due to their preferences in the following:
- Holding period
- Reward-to-risk ratio
- Acceptable adverse excursion
So don’t overthink here, and select the entry points that appeal to you.
You can complete the first three steps without understanding candlestick charts. But for the next and final step, you need basic knowledge of OHLC charts.
Here are some resources for that:
- Beginner’s Guide To Reading Price Action
- 10 Candlestick Patterns For Price Action Trading
- Trend Bars For Reading Price Action
Step #4: Study For Similarities
This step is the exciting part. We have already identified the price action formations that interest us. Now, it’s time to distill them into observations that might be helpful going forward.
Draw broad observations from the highlighted price action.
The difficulty of this step depends on your familiarity with price action.
If you are struggling with this step, don’t fret. Always remember the basics and proceed from there.
Any observations you draw must come from the information in a candlestick chart.
So consider this:
What data does a candlestick chart show?
A candlestick shows you the Open-High-Low-Close (OHLC) prices of a period.
So let’s work with the OHLC data. Here are some questions to get you started:
- Is the candlestick bullish or bearish? (O>C or C<O)
- What is the range of the candlestick? (H-L)
- How does the OHLC of this candlestick compare to the OHLC of the preceding one? (e.g., Did it have a higher high? Did it close higher? Did it have a higher low?)
- Are they Trend Bars or Dojis?
- Is there a window or gap between the candlesticks?
While this list is overwhelming at first, it boils down to describing the patterns using OHLC. The aim is to distill helpful price action trading patterns.
Now, back to our MSFT example. We have magnified the candlestick chart below to zoom in on the circled price action. (You can click on the chart to expand it.)
What do you observe?
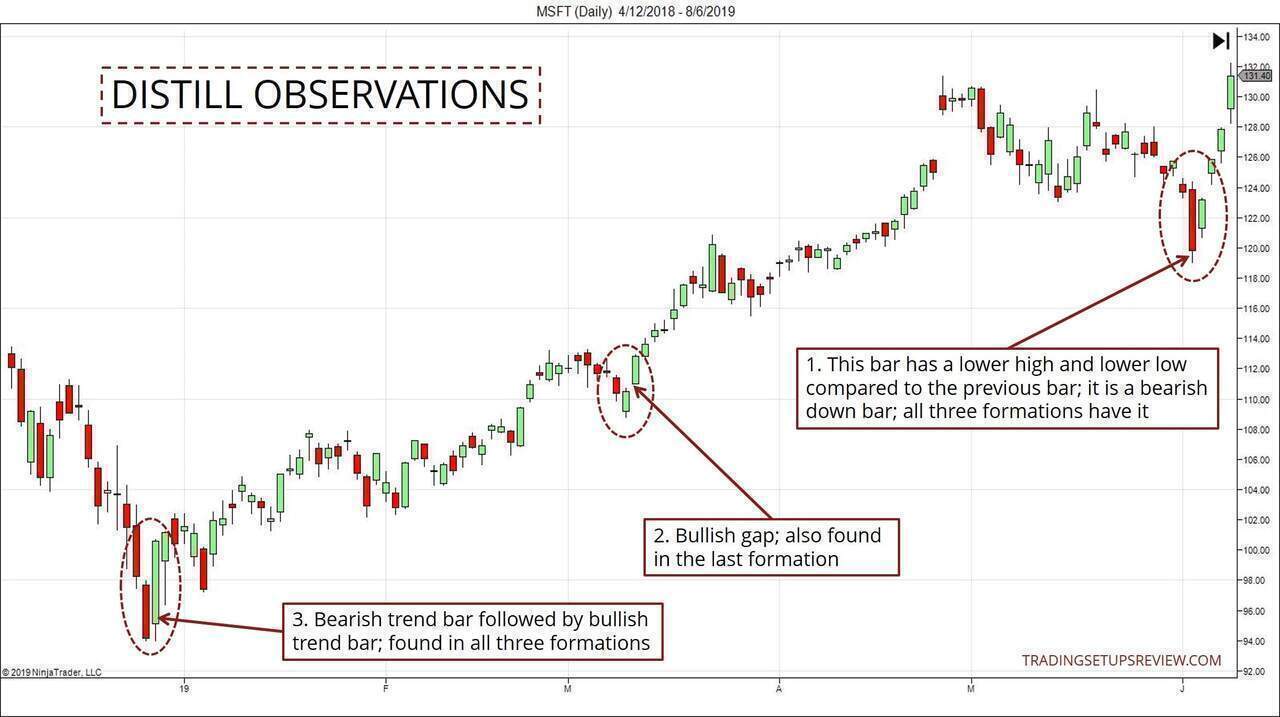
- Each of the three formations had a bearish down bar. A down bar is one with a lower high and lower low compared to the preceding bar.
- Two of the formations had a bullish gap right before the market took off.
- All three price patterns involved a bearish Trend Bar followed by a bullish Trend Bar.
If I observe these formations repeatedly in other charts, they might spur me to:
- Look for a bearish down bar in my scans for bullish setups.
- Use the bullish gap as a way to confirm bullish setups.
- Focus on trading two-bar reversals with Trend Bars.
Price Action Trading Patterns: Bearish Bias Example
The steps above are straightforward. But you’ll need practice, and more examples will help.
So let’s review one more example here.
The chart below shows the daily price bars (candlesticks) of the stock for Lumber Liquidators Inc. (LL)
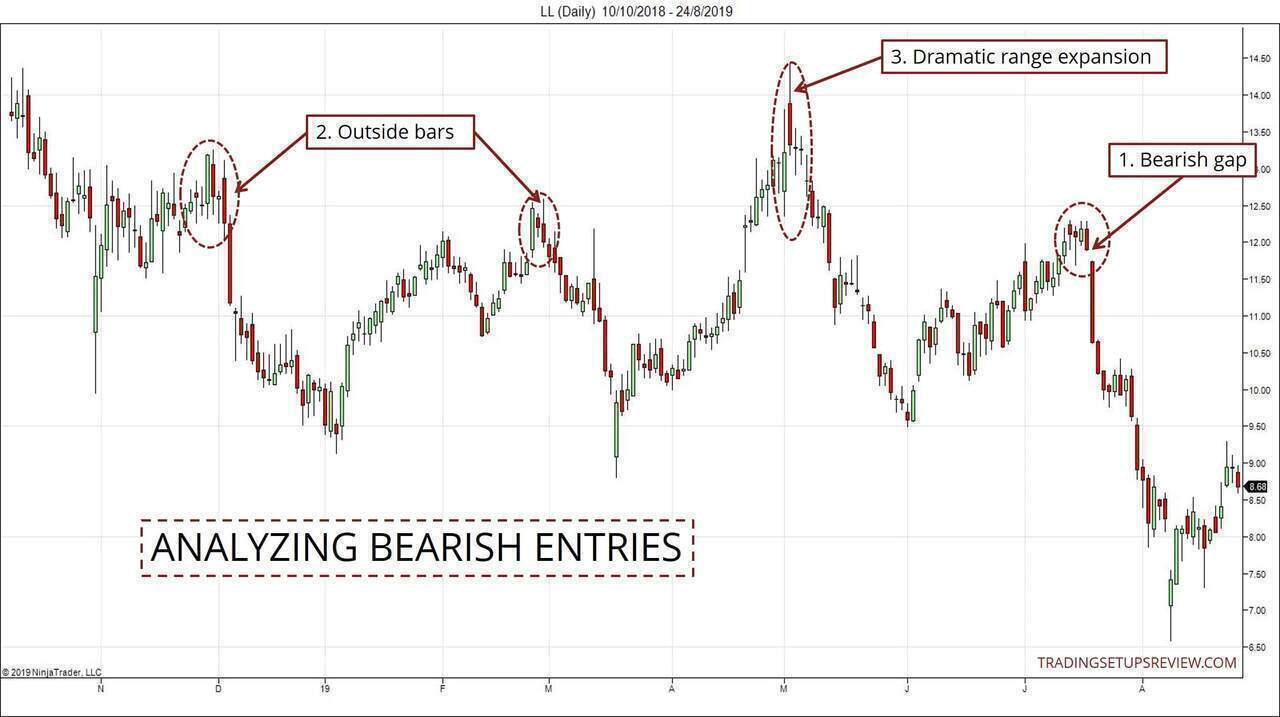
- This bearish gap reminds us of the bullish gap we observed in the MSFT example. Do gaps confirm entries?
- A feature we did not see in the MSFT example: outside bars (i.e., higher high and lower low compared to the last bar)
- The range (H-L) of the candlesticks expanded at this turning point.
You might have noticed that the entries here look different from the MSFT example.
Instead of neat two-bar reversals, you see more unruly outside bars. You also see more variability in the range of the bars.
What could explain the difference?
- Is it because bearish price patterns (in LL) are different from bullish patterns (in MSFT)?
- Or is it because entries in a steady trend (in MSFT) differ from entries in a choppier context (in LL)?
Study more charts to figure out the answer!
A Word On Expectations
Now, you’re ready to uncover price action trading patterns on your own.
But before you dash off and dive into your charts, let’s talk about expectations.
Many diligent and talented traders have analyzed charts for price action trading patterns. So it’s highly unlikely that you will find something groundbreaking.
Then, what is the value of going through these steps to find price action trading patterns?
This simple four-step process helps you to hone your trading instinct systematically.
It also helps you to develop your unique understanding of price action.
You’ll learn to read the market from scratch and will not take the words of any trading guru as a given.
In a nutshell, it helps you to develop as an independent price action trader.
What’s After Finding Price Action Trading Patterns?
Now that you’ve found some interesting price action trading patterns, what’s next?
- If you have coding experience, write a simple script to backtest the trading pattern. This is a fantastic way to gain even more insights. (Learn how to code for trading.)
- Look for similar price patterns. Then, analyze the market context within which they are valid.
- Here, we focused on finding short-term patterns. Extend this exercise to finding trading patterns that span an extended period. (e.g., chart patterns)
- Move beyond OHLC to consider volume patterns too.
Conclusion
While price action trading patterns are exciting, they are a small part of any trading plan.
So don’t stop after you uncover a new price pattern. Develop it into a complete trading strategy with bias identification and exit tactics. And don’t forget to incorporate risk management and psychological safeguards to ensure consistency.
This step-by-step process helps you to unearth price action trading patterns. While it is not the Holy Grail, it has enormous educational value. Over time, as you gain experience, you’ll be able to extract practical benefit from it too.
It has helped me uncover many price patterns, including the ones taught in my price action course - the Anti-Climax pattern is one of them.