Pin Bar Context Trading Method
By Galen Woods ‐ 8 min read
For price action trading, context is king. In this tutorial, learn a simple yet unique method to analyze the context with the Pin Bar price pattern.
The Pin Bar is one of the most popular price patterns. It is easy to spot and trade. But any trader who has tried utilizing it will know that it’s not the pattern that works. It is the context you find it in that is critical to its performance.
This is why the Pin Bar Context strategy you are about to learn is a valuable tool for any price action trader. This method involves finding at least two Pin Bars and analyzing them together.
By design, this method requires you to consider the Pin Bar within the context of recent price action.
I’m assuming this is not your encounter with the Pin Bar. But before we move on, let’s recap the Pin Bar’s anatomy to ensure that we are on the same page regarding the jargon.
Parts of a Pin Bar
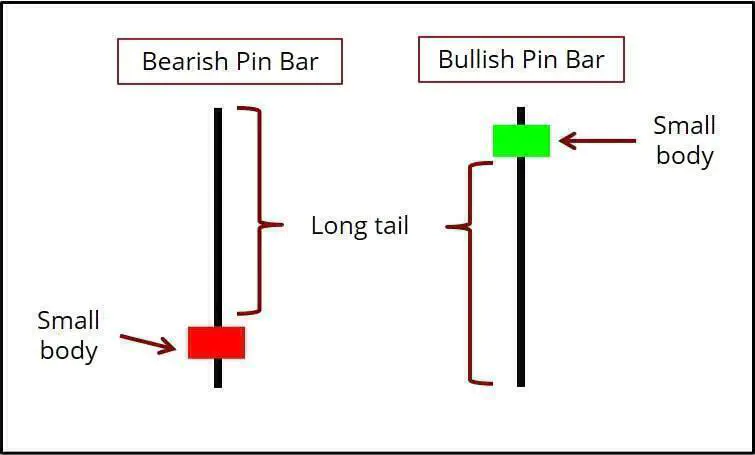
A Pin Bar’s striking feature is its long tail (or shadow), which implies buying or selling pressure.
(Top tail implies selling pressure; bottom tail implies buying pressure.)
Pin Bar Context Identification Guidelines
In this approach, we are interested in locating two (or more) Pin Bars:
- In the same direction (both bullish or both bearish)
- In proximity (in time)
- With long tails that overlap (in price)
One more important guideline is that the price action between two bullish Pin Bars should not fall too much below either Pin Bar. Similarly, the price action between two bearish Pin Bars should not rise too much above either Pin Bar.
The chart below shows these guidelines in action.
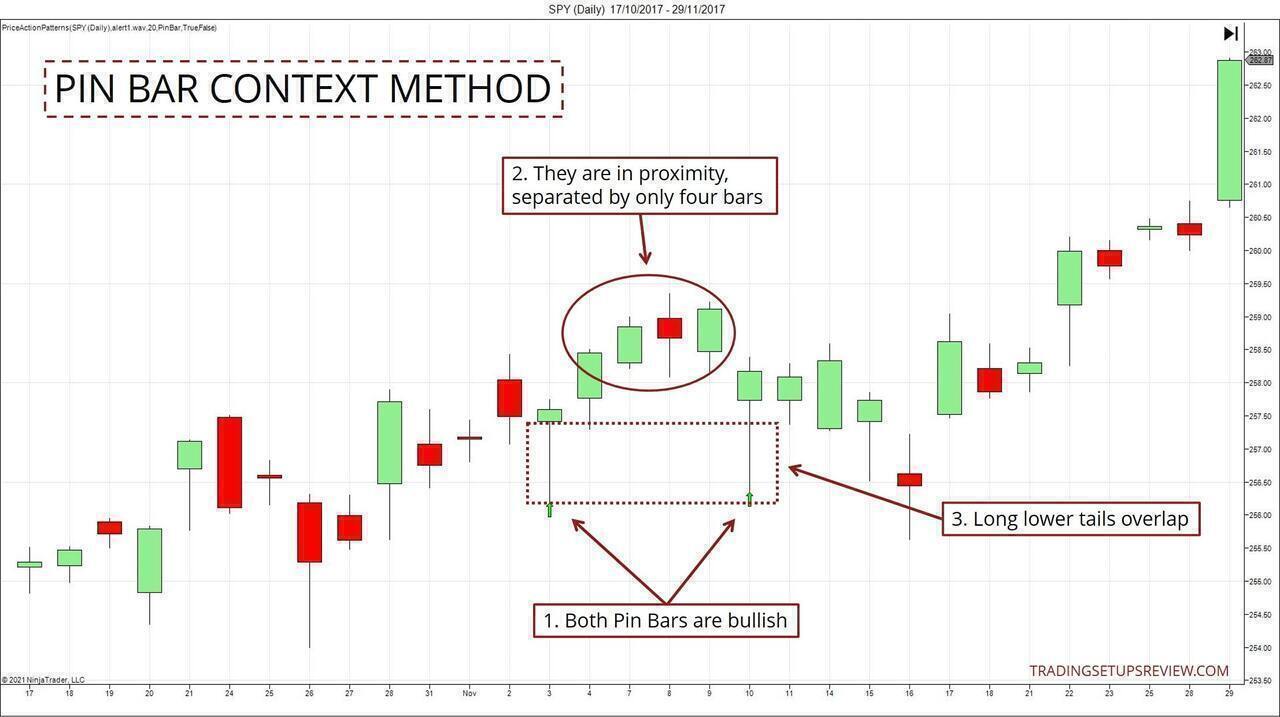
- Both Pin Bars are bullish.
- The Pin Bars are relatively close, separated by only four candlesticks.
- The long tails overlap.
Why is this formation significant?
Let’s discuss this in a bullish context.
The first Pin Bar implies bullish pressure around a price level. It’s reasonable to presume that the long lower tail is a potential support zone.
A second Pin Bar forming around the same price level confirms the bullish pressure. This observation is helpful to traders in many ways, as you will see in the examples below.
Because we are using the second Pin Bar to confirm the first instance, they should form close to each other. If not, the confirmation is weak.
How do we make use of this formation?
There are two ways to make use of this formation.
- First, you can use it as a typical trading setup to trigger an entry. (The second Pin Bar works like the re-entry setup in some cases.)
- Second, you can use it to find reliable support and resistance zones. The price zone where both long tails overlap projects a support/resistance belt.
Pin Bar Context Trading Examples
To appreciate and internalize this approach, let’s review five examples with detailed charts.
I applied the Price Pattern Indicator to highlight the Pin Bars (green and red arrows) in the charts below. It ensures consistency in our pattern recognition process.
Example #1: Three Pairs of Pin Bars
This example contains three pairs of bullish Pin Bars. It offers an excellent opportunity to distinguish the pair we are drawn to with this method.
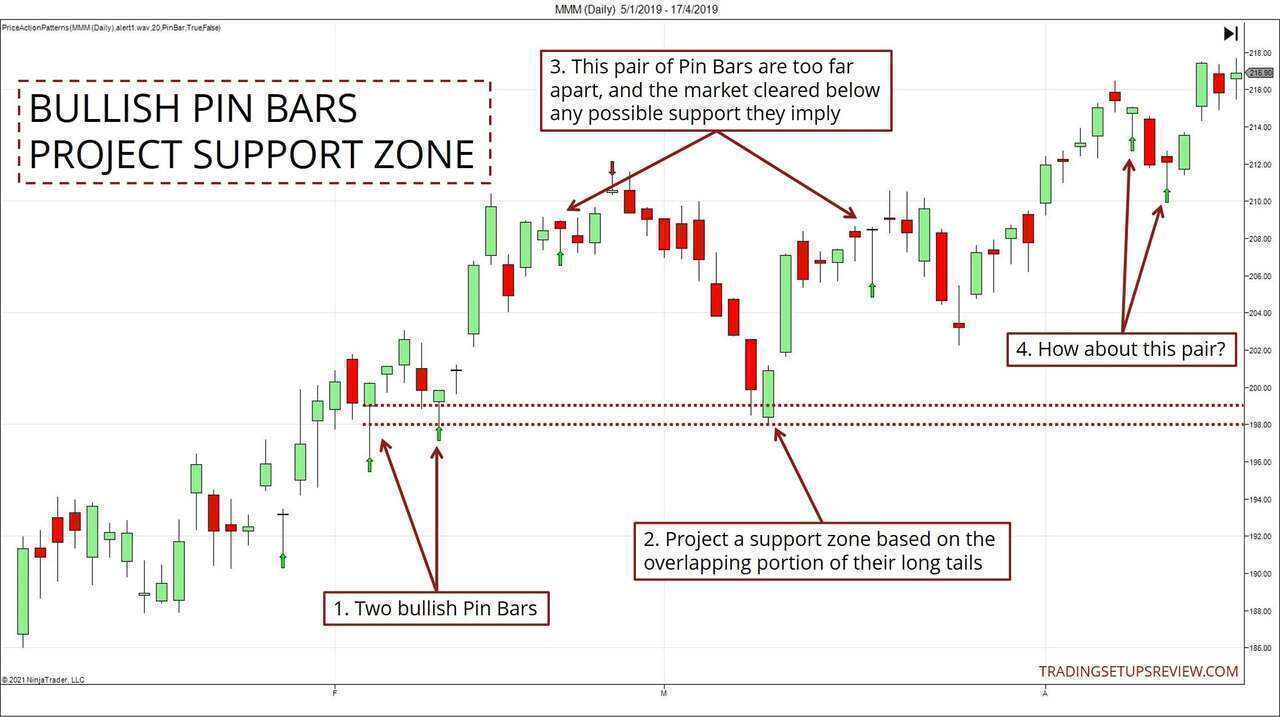
- These two bullish Pin Bars had only three candlesticks between them. Furthermore, the market did not dip below them. Hence, they fitted the guidelines above. We could take on a long position with the second Pin Bar.
- We could also use the overlapping part of their lower tails to project a support zone. As you see here, the area proved effective in supporting the market after a sharp decline.
- This second pair of bullish Pin Bars was in contrast with the first pair. They had more candlesticks between them. And significantly, the market blew through any bullishness they might imply by falling well below them. Hence, by the time the second Pin Bar was completed, we were no longer interested in this pair.
- How about this final pair? Their long tails did not overlap, so they did not fit our guidelines and were not our focus. But each Pin Bar can still be helpful as trade triggers in their own right.
Example #2: Range-Bound & Breakout
This example shows some messy price action that seemed hard to interpret at first.
Anchoring our perspective with a reliable support zone simplified our analysis.
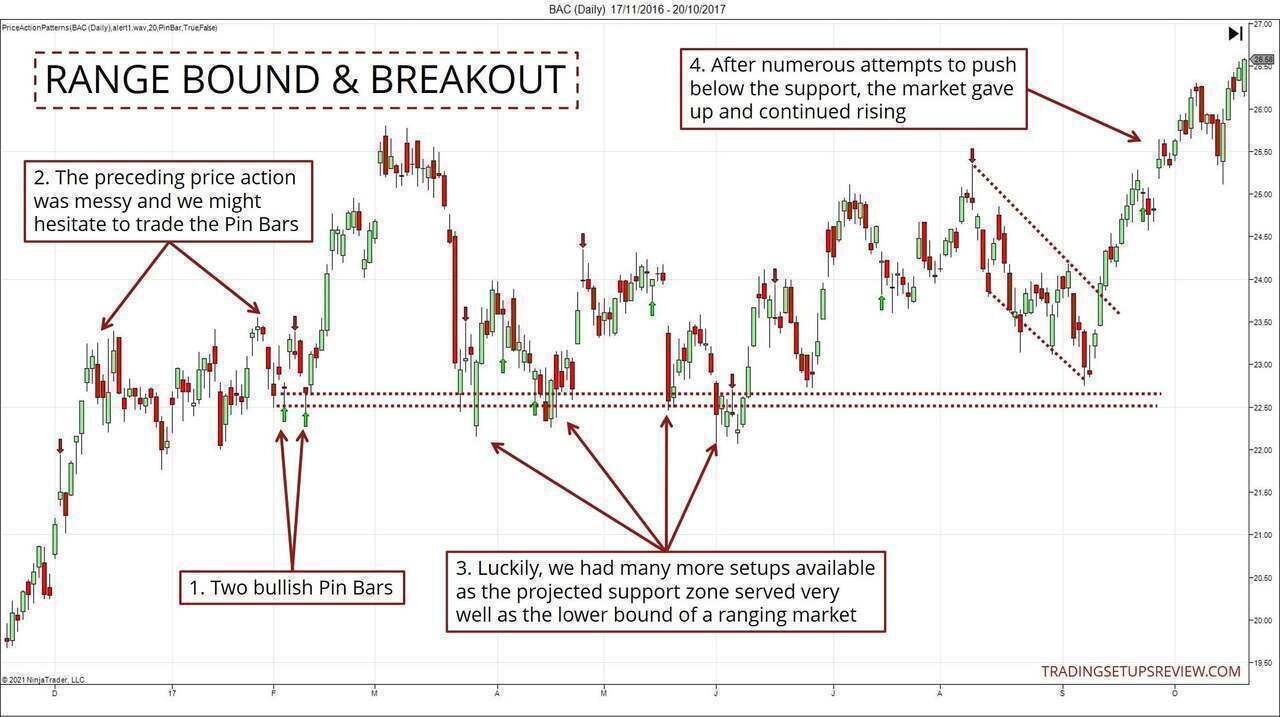
- These are the two Pin Bars the piqued our interest. We projected a support zone with the overlapping tails.
- The preceding range-bound price action (in between the two arrows) was messy. Hence, some traders might hold back from a long position despite the double bullish Pin Bars.
- Fortunately, the market gave us many more opportunities to accumulate our positions. The support zone drawn with the Pin Bars proved to be a solid lower boundary of the extended trading range.
- After many failed attempts to push below the support, the market gave up and continued rising. Note the bull flag that formed before the breakout.
Example #3: Conflicting Signals
This example makes for an exciting study.
It shows that we should not trade any method mechanically. If we had done so, we would not have spotted the tense tightness in the chart below. Picking up on that warned us of the erratic and volatile price action that followed.
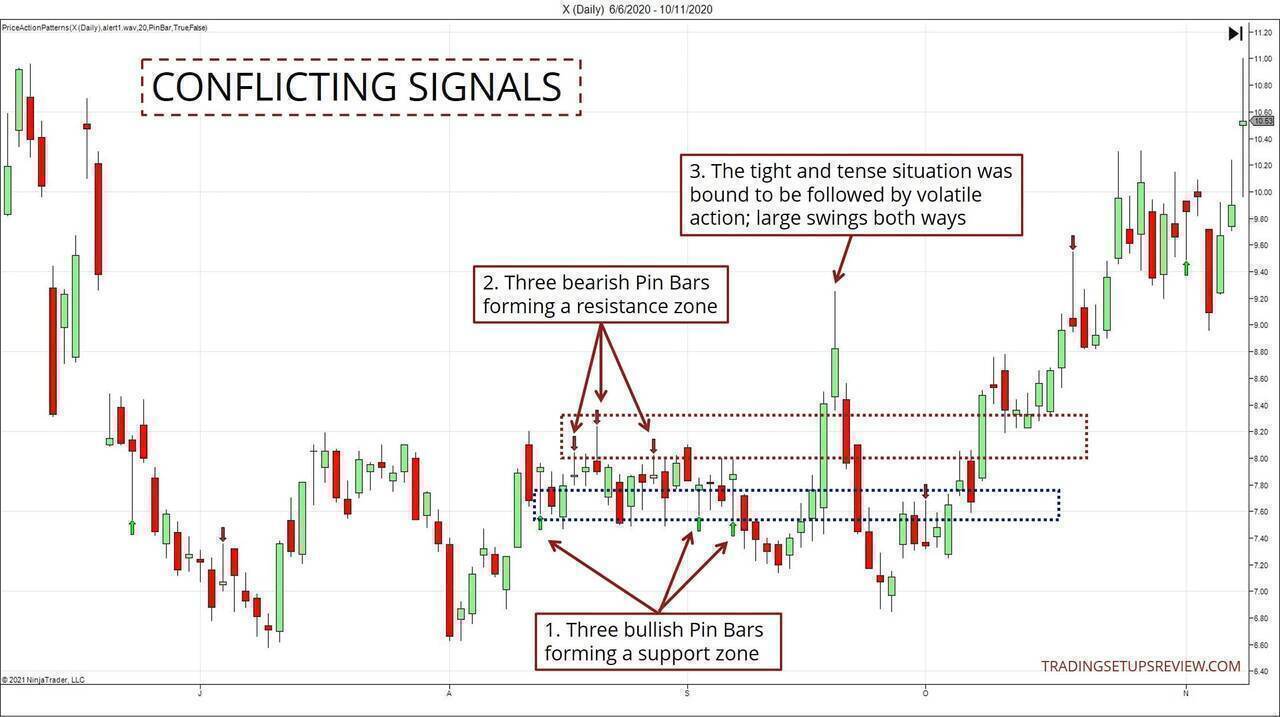
- These three bullish Pin Bars formed around the same price zone and projected a support zone. (Blue dotted box)
- These three bearish Pin Bars had an opposite effect and created a resistance zone. (Maroon dotted box)
- The two opposing zones formed in proximity. This implied that the market was wound up with tension. Hence, it was not surprising that it resolved in violent swings in both directions.
What’s the lesson here?
If we had paid attention to Pin Bars in both directions, we would have caught signs of the congested market. And as a result, we could avoid taking on any positions or exit any existing ones. (until the price action clears up)
If you’ve completed my price action course, you would be familiar with Pressure Zones. The idea underlying this Pin Bar Context method is similar to that of the Pressure Zones. (Think of it as a Pressure Zone that is spread out.)
Hence, just like when we find Pressure Zones in both directions, it is a good idea to stand aside when we have the Pin Bars pointing in both directions.
Example #4: Resisting A Bull Trend
This example shows that this method is not the Holy Grail.
It offers you a way to understand and spot market entries. But you still need to build a trading plan around it to trade successfully with it.
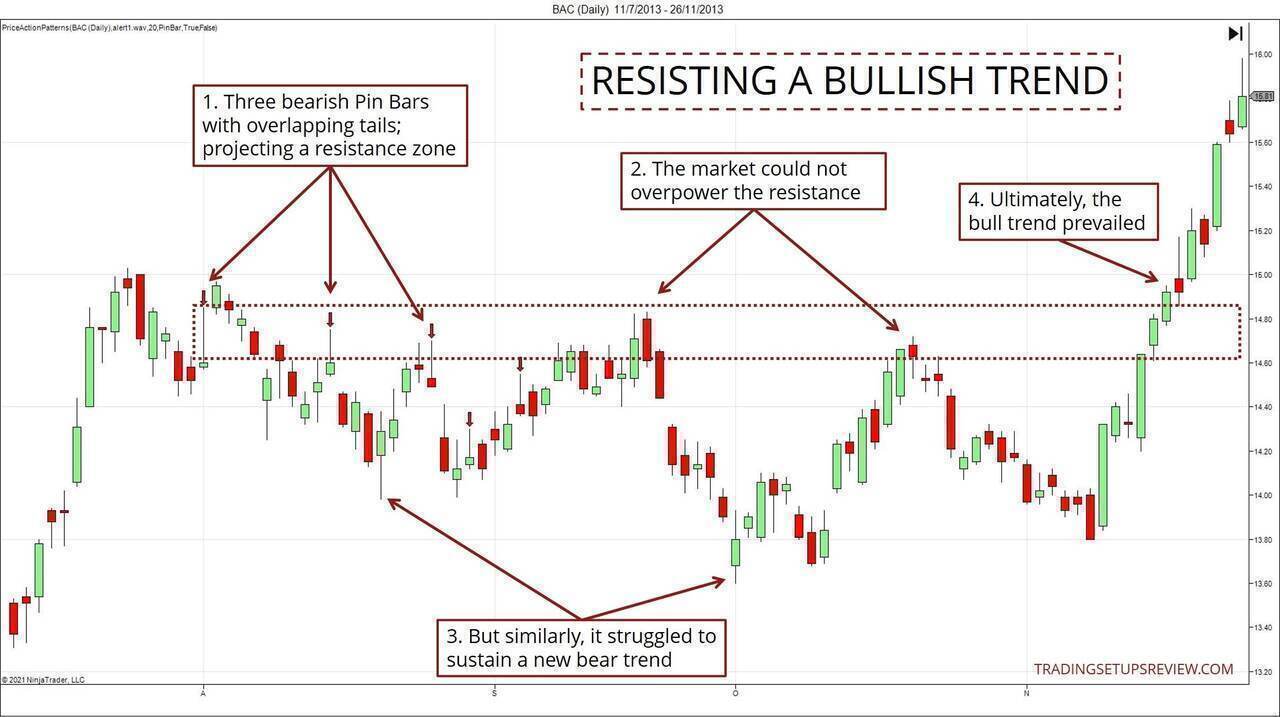
- These three bearish Pin Bars gave us the basis to project a reliable resistance zone.
- The zone proved effective as it halted the market at these two junctures.
- But we should not be too quick to assume that a bearish trend reversal is underway. If you look at these two trend extremes, you will notice that complex pullbacks followed both. These many-legged attempts to resume the bear trend showed that it was struggling.
- Eventually, the original bullish forces prevailed, and the market rose through the resistance.
In the scenario above, you might be able to end with a profitable short trade if you had aimed for a conservative target. But if you were gunning for a new bear trend, you would’ve been disappointed. In a nutshell, a lot depends on your exit strategy.
This highlights how important it is to integrate your trading method with other parts of your trading plan. A trading approach has no value if it is not part of a holistic and sensible trading plan.
Example #5: ES Futures 5-Minute
Let’s end off this series of examples with an intraday chart. Remember that you can apply most price action methods to a variety of timeframes.
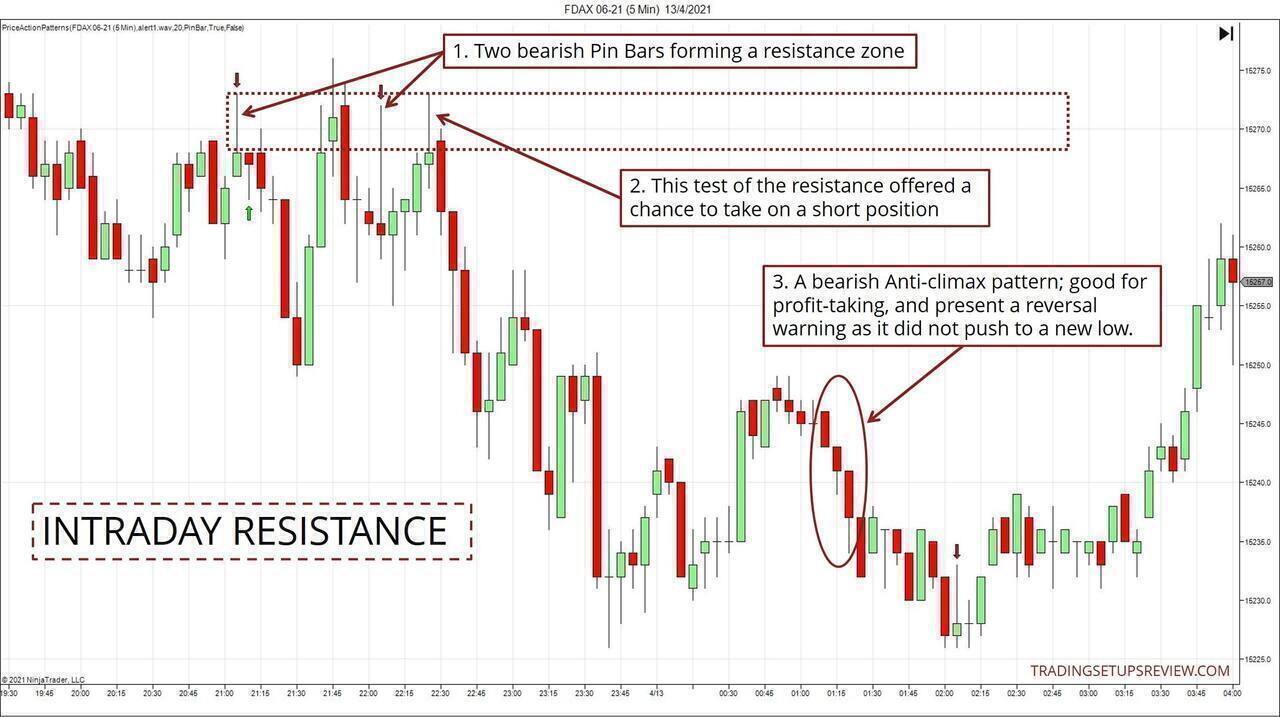
- These two bearish Pin Bars overlapped to project a resistance zone. The market did try to move higher between the two Pin Bars. If the market pushed much higher than the Pin Bars, we would need to abandon our method. But in this case, the test was minor and short-lived.
- This incursion into the resistance zone offered a bearish setup.
- For bears who need a profit-taking signal, this bullish Anti-Climax pattern was perfect. Bullish Anti-Climax patterns usually push to a new low, but here, it did not. Hence, we could also interpret it as a bullish reversal warning.
(If the Anti-Climax pattern is new to you, please download this free chapter from my course to learn more about it.)
Conclusion - Pin Bar Context Trading Method
Initially, I titled this approach “Double Pin Bar.” But I realized that this title does not highlight its crucial concept: to analyze the context using Pin Bars.
The method underscores how we can use price patterns as part of our broader context analysis.
We can use them strictly as trade triggers. Or we can interpret price patterns as information to enhance our market analysis.
If you an experienced price action trader, you might be thinking of applying this method with other patterns. You certainly can.
This method adapts well to other price patterns like the Two-Bar Reversal. I chose to use the Pin Bar pattern in this tutorial because it allows me to introduce this approach with a well-known price pattern that’s easy to understand.
Finally, despite how the examples above look, this approach does not always work. This is why we need to limit our risk through stop-loss placement and position sizing.