How To Lay A Solid Foundation For Price Action Trading
By Galen Woods ‐ 7 min read
Learn the basics of price action trading and get a solid foundation for advanced market analysis. A step-by-step guide to mastering price action.
Welcome to the fascinating journey of price action trading. Most new price action traders are eager to start trading and focus on looking for trading setups. Inevitably, they overlook the need to build a solid foundation as a price action trader. Focus on the four pillars of price action trading to avoid this mistake.
This guide will help you, step-by-step, to build the right foundation. It will give you the price action skills you need to approach any market: stocks, futures, forex, cryptos.
Whether you’re:
- New to price action trading
- Thinking if you missed any crucial essentials in your learning
- Just curious about what you need to succeed with price action
You can benefit from this guide.
Overview
- Section #1: Appreciate Demand And Supply
- Section #2: Read Price Action Bar-By-Bar
- Section #3: Track Price Swings
- Section #4: Dive Deeper Into Support And Resistance
This guide assumes that you know how to read a candlestick chart. Can you draw a candlestick to represent the high, low, open, and close prices of a period?
- If you answered yes, please proceed.
- If you answered no, click here to learn how to read a candlestick chart.
Warning: This is a hands-on guide. You need to do much more than reading. You need to study tutorials, scrutinize charts, and contemplate concepts.
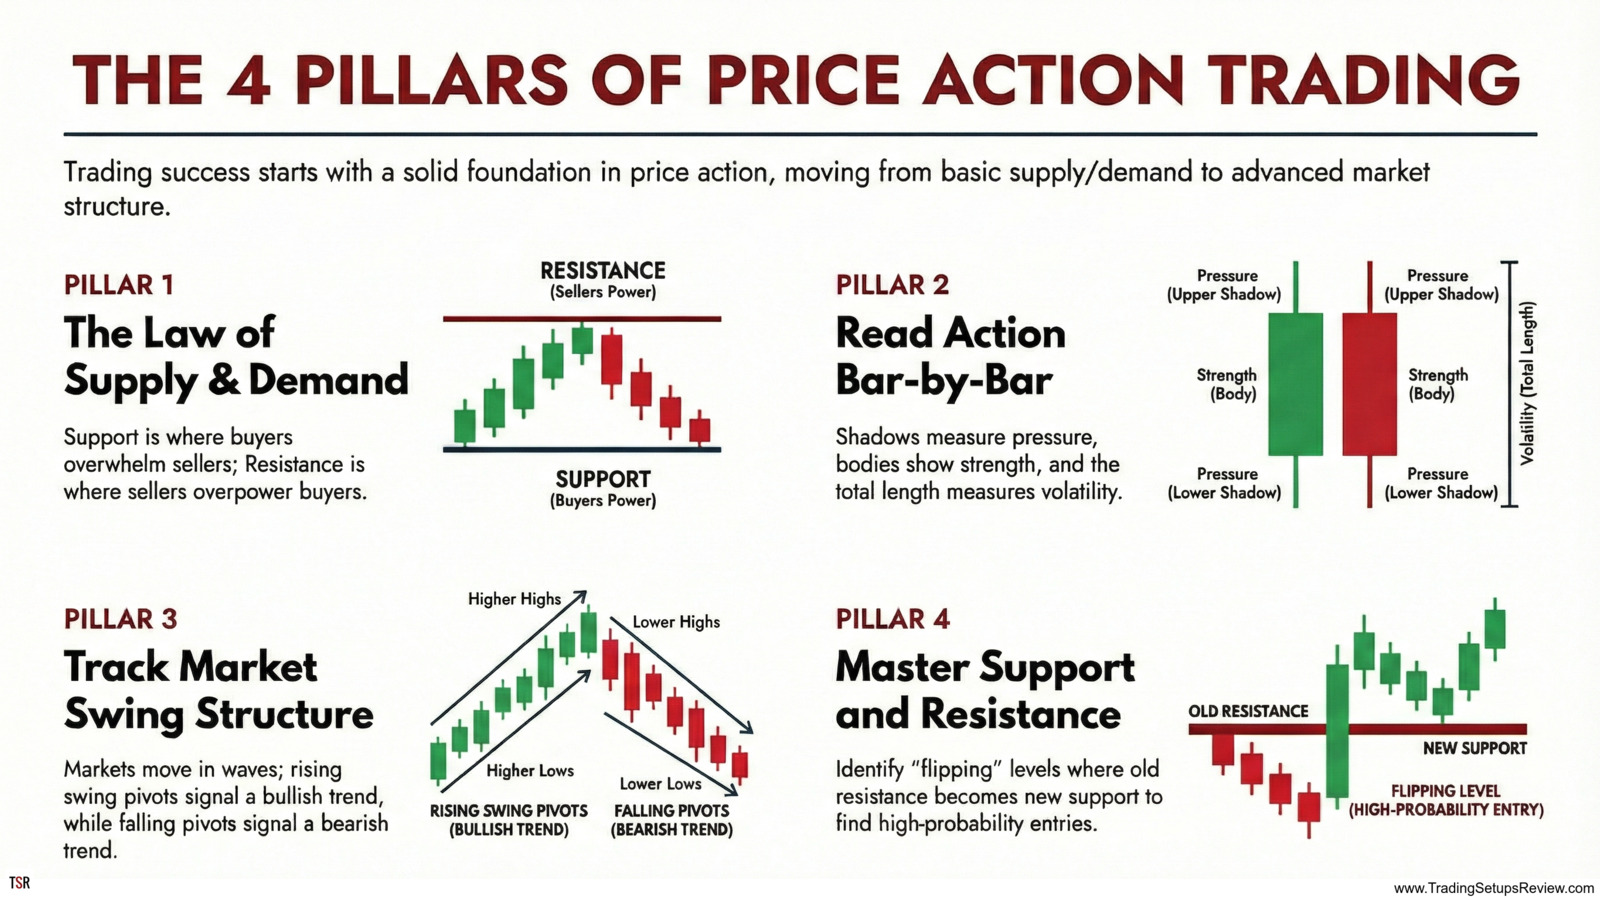
Section #1: Appreciate Demand and Supply
Price action is the result of changes in demand and supply.
What does it mean when the market bounces up from a price level?
It means that at that price level, demand is stronger than supply. It says that the buyers had bought everything the sellers wanted to sell. Now, they are offering higher prices to buy even more.
The price level where the buyers overwhelmed the sellers is called a support level. It tends to support the market and prevent prices from falling.
Ponder
What does it mean when the market reverses down from a price level?
Using the logic above, try to explain the reversal as a struggle between buyers and sellers.
The price level where the market reverses down is called a resistance level.
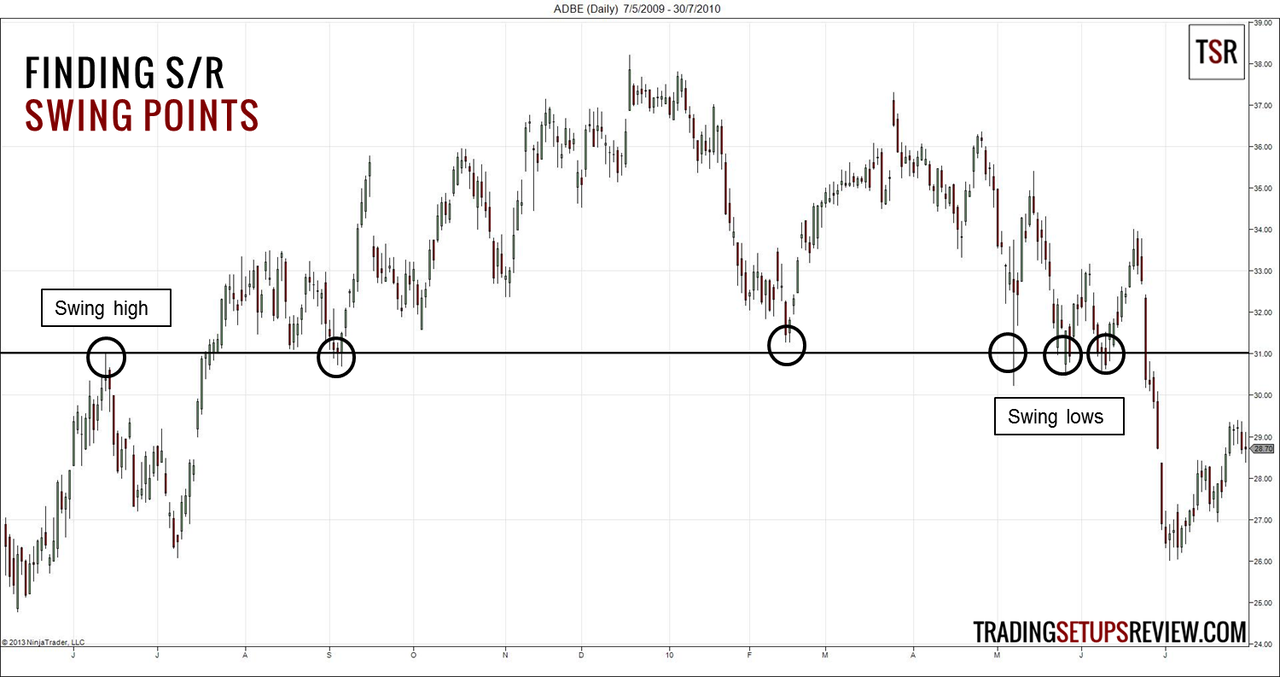
The chart below illustrates support and resistance at work.
Take a look at it, but don’t dwell too much on it at this point.
Hold This Thought
Everything in price action trading revolves around support and resistance (S/R).
Section #2: Read Price Action Bar-By-Bar
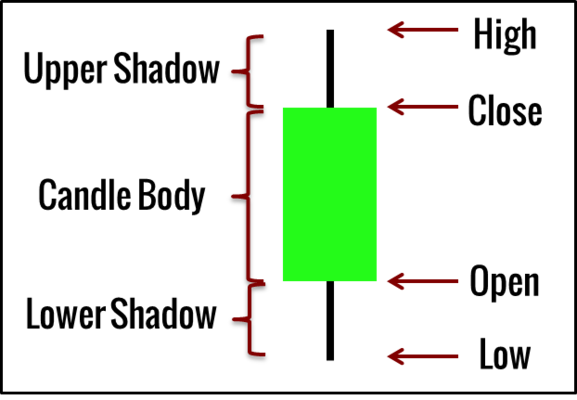
A candlestick means a lot.
- The length of the top shadow is a measure of selling pressure.
- The length of the bottom shadow is a measure of buying pressure.
- The length of the entire candlestick measures volatility.
- The length of the candle body is a measure of strength.
- The high of the candlestick acts as a minor resistance.
- The low of the candlestick serves as a minor support.
Applying these guidelines on a single candlestick is of limited value.
But when you apply them to a series of candlesticks, their utility increases many folds. This observation is the basis for candlestick and bar patterns.
(I use candlesticks and price bars interchangeably.)
Study
Work your way through this tutorial on reading price action. It will show you how to interpret a single price bar, two price bars, and three price bars.
Do it slowly, and make sure you understand the examples.
For the extra mile: Complete this trend bar tutorial to level up your price action trading skills.
Apply
In these two tutorials, you’ll find 20 price patterns.
Put to use the reading skills and perspective you learned. Explain the price action dynamics of each price pattern to yourself.
Section #3: Track Price Swings
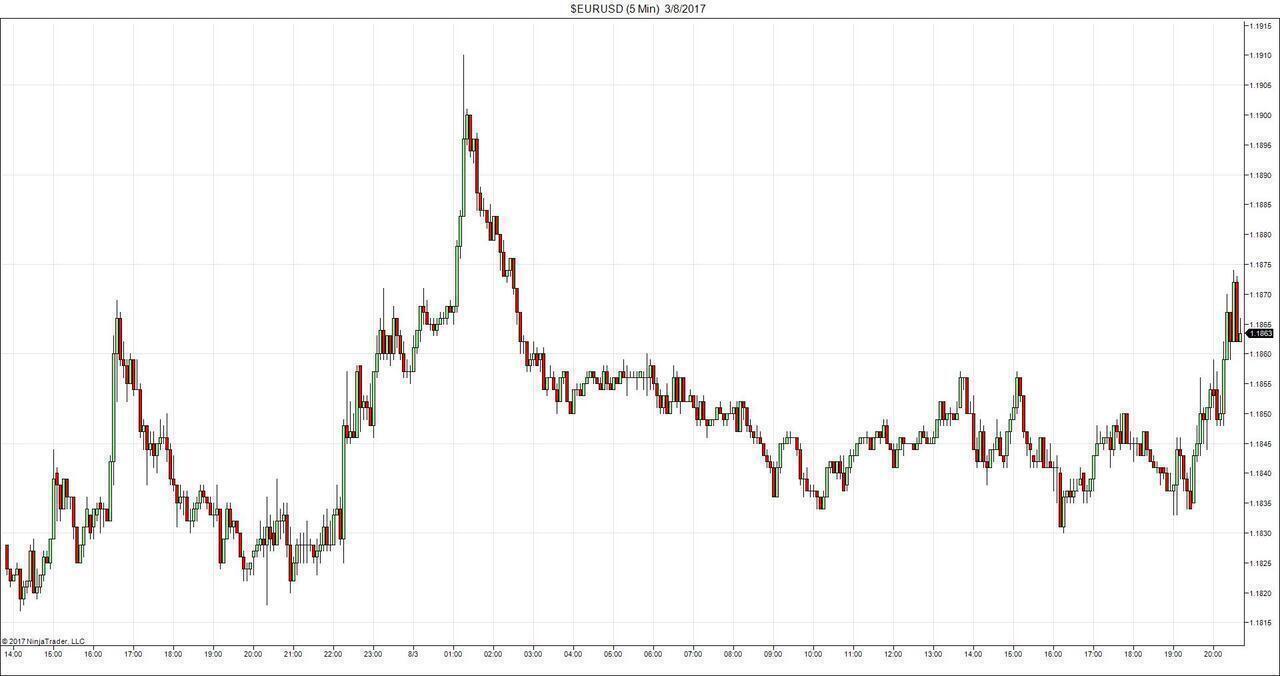
Look at the chart above (or any price chart you have), and answer these questions.
Do prices move vertically up and down?
Or does the market move in a swing (wave) structure?
Yup, the market structure composes of swings.
The market rises and turns down. It goes down and turns up. In doing so, it forms waves or swings.
In this section, you’ll focus on recognizing and interpreting these swings.
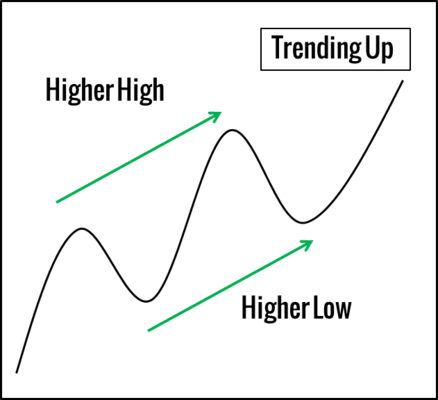
This market swing structure has a few important implications for price action traders.
First, you can identify the market trend by following the swings. Each time the market ends a swing and start moving in the opposite direction, it forms a turning point. These turning points are also called swing pivots.
If these swing pivots are moving up, the market trend is bullish. If these swing pivots are moving down, the market is bearish.
Second, swing pivots tend to act as support and resistance.
Third, the magnitude and speed of each price swing differ. If you observe a series of price swings, you can get a sense of what the market is doing. This concept forms the basis for chart patterns.
Study
Work your way through the ten chart patterns in this tutorial. Observe how you can explain each one as a series of swings behaving in a specific manner.
E.g., a series of weakening swings within a price range forms a triangle pattern.
The tricky part about price swings is how to identify when the market has turned.
Some traders do not follow a set of rules to identify market swings. These traders tend to perform perfect analysis on historical charts. They also tend to get confused during actual trading. Don’t join them.
Develop a consistent method to identify swings and stick to it.
Here are some ideas:
Integrate
This tutorial has three examples of bar-by-bar analysis. Each instance takes place within the context of the most recent swing high and swing low.
Hence, they are an integration of what you learned in the last section with what is covered in this section.
After studying those examples, randomly select three sets of twenty price bars from any chart. Then, try your best to analyze them similarly.
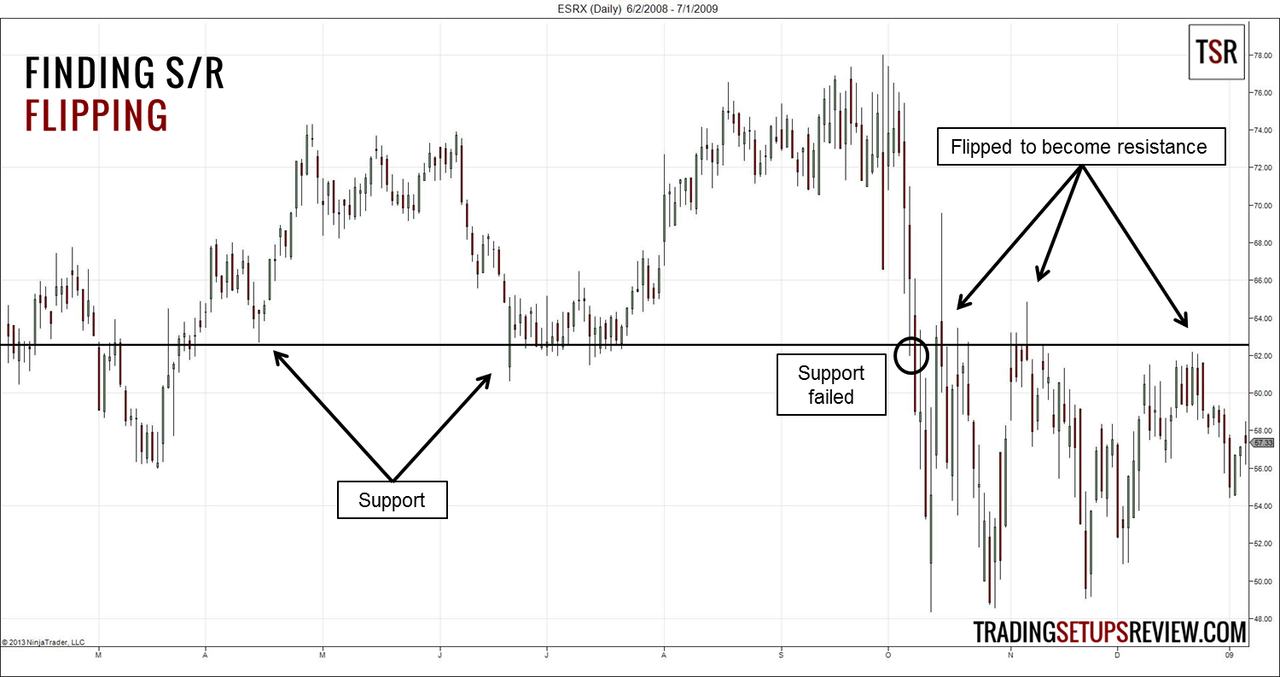
Section #4: Dive Deeper Into Support and Resistance
At this stage, you should have a pretty good grasp of price action fundamentals.
Hence, in this final section, you’ll be exposed to more profound price action concepts.
The aim here is not for you to become an expert overnight. It is to establish a broad foundation for you to explore further.
Read & Apply
For each of the tutorial below, read and apply the concepts to your charts. (Remember to link these concepts back to what you learned in the last three sections.)
Let’s take the S/R flipping tutorial (first one below) as an example. First, go through the examples. Then, on your charts, mark up a few S/R levels. Observe how price action interacts with the S/R levels and see for yourself if flipping occurs.
Conclusion
If you’ve worked hard and followed this guide thoroughly, congratulations!
You should be able to look at any chart now and describe what is happening.
You’re also well-prepared to move on to advanced price action concepts. (e.g., channels and congestion)
But I still don’t know where to buy and sell!
Yup. Now that you have a solid price action foundation, it’s time to move on.
What you need now is a trading strategy. Here are your options.
Want to create your own trading strategy?
Take a look at your charts and mark out what you think are good entries. Then, examine the price action around these entries.
Try to spot similarities among them and record your thoughts. As you cycle through the charts, you’re already developing your own approach to the market.
And this is possible only because you have a solid price action trading foundation.
Want to use an existing strategy as a template?
Don’t forget to use the concepts you picked up here to complement your chosen strategy.
Regardless of your choice, you should paper trade your trading strategy to hone your skills.
And before you start to risk your money in real trading, make sure you know how to:
- Manage your emotions while trading
- Size your trading positions
- Limit your losses
- Take advantage of positive expectancy
If you want a complete price action package that includes all the above points, take a look at my trading course.