The Complete Breakaway Gap Trading Guide
By Galen Woods ‐ 8 min read
Breakaway gaps kickstart powerful trends that offer a high reward-to-risk ratio. Learn how to trade breakaway gap setups with this in-depth trading guide.
Gaps, or windows, are a vital feature on charts that show up in daily (and above) price charts. These gaping holes in your chart are the result of extreme supply and demand imbalances. And the gap pattern with the best reward-to-risk ratio is the breakaway gap.
As a swing trader, you cannot ignore gaps.
Gaps are everywhere, and a breakaway (or breakout) gap has a special status. It breaks out of an area of consolidation and kickstart trends.
For retail traders, our best shot at a profitable trading strategy is to join a trend as early as possible. The earlier you hop onto the market trend, the larger your potential reward. For this reason, it pays well to understand breakaway gaps.

Guide Overview
- What is a Breakaway Gap?
- How Do You Identify A Breakaway Gap?
- How To Scan For Breakaway Gaps?
- How To Assess The Quality Of A Breakaway Gap?
- How To Trade A Breakaway Gap? (Entry, Stop-Loss, Targets)
- How To Take Profit?
What is a Breakaway Gap?
Many price action patterns have names that are not helpful. The breakaway gap is an exception. It helps you to remember what it is and how to identify it.
Breakaway gaps must break away from something.
From a price action perspective, it must break out of an area of consolidation.
As the market breaks away with a forceful gap, it signals the start of a new trend. It may reverse the market direction or start a trend from any consolidating pattern.
(Although breakaway gaps often kickstart trends, it’s not always the case.)
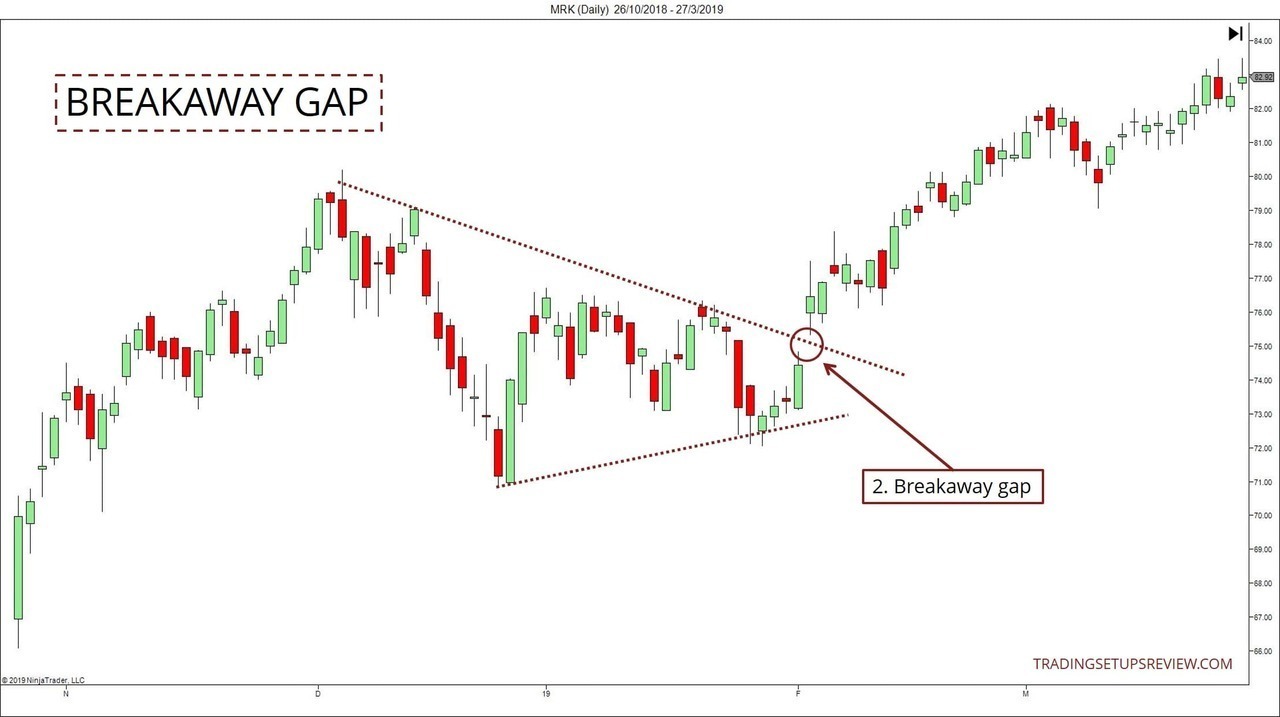
The chart below shows a breakaway gap that broke out along from an area of consolidation. The breakout was in the direction of the trend.
To put the breakaway gap in perspective, you need to contrast it with other gap types.
A simple guide to interpreting different gap types:
- Breakaway gaps - starts a trend
- Runaway gaps - continue a trend
- Exhaustion gaps - ends a trend
- Common gaps - insignificant (fills too quickly)
Click on the links above to learn more about each gap type.
Some chart examples:
This list above describes what happens in an ideal market ruled by gap traders.
However, in practice, trends can start, continue, and end without forming any gaps.
Also, while it’s easy to label gaps after the fact, it’s much harder to do so in real-time as they develop. Remember that it can be messy, and taking clues from other price patterns help.
Knowing the typology of trading gaps is critical for grasping the big picture.
But, to trade and profit from them, you need to dive in deep into the behavior of each individual gap type. You need to master the gap types one by one.
In this guide, you learn to master the breakaway gap.
How to Identify a Breakaway Gap
First, let’s get down to the nitty-gritty of how to identify breakaway gaps.
Three main criteria of a breakaway gap:
- Gap out of a consolidating chart pattern
- High volume (especially crucial for bullish breakouts)
- Does not fill quickly
The third criterion is an ex-post observation, so it can only serve as a confirmation after the first two requirements are met.
Let’s look at an example below.
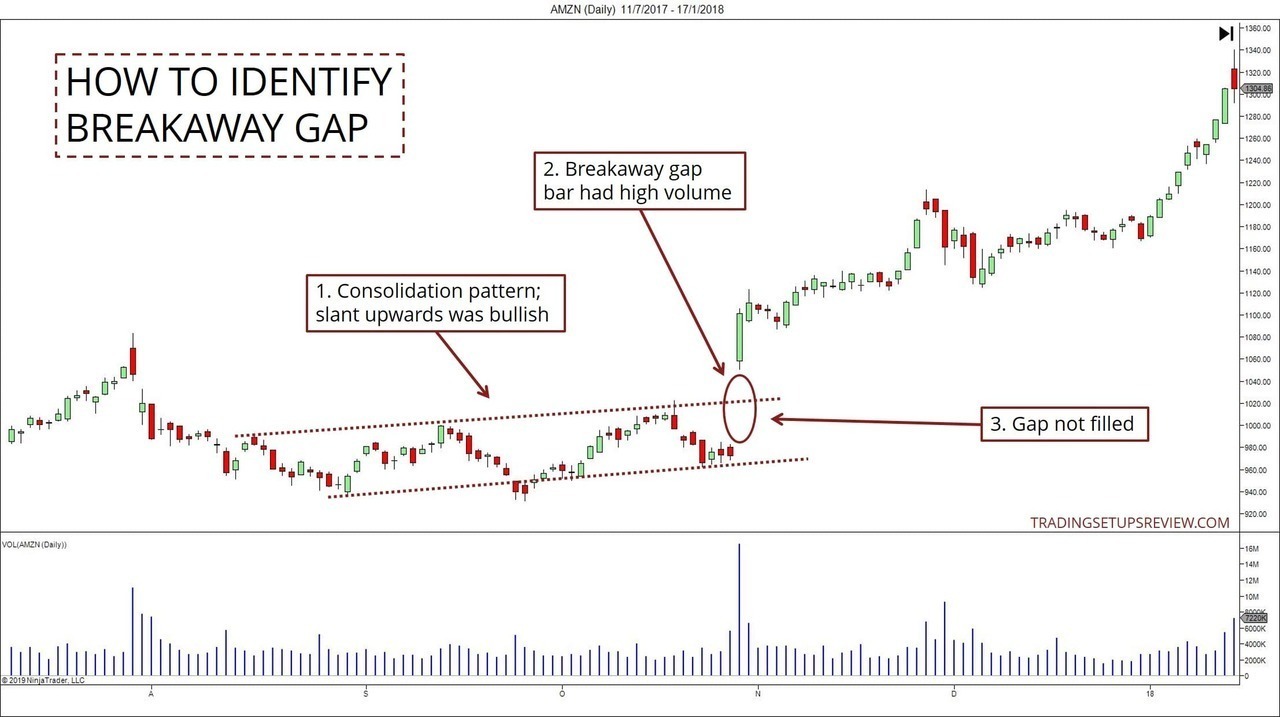
- The gap broke away from this consolidation pattern. Take note of the rising swing lows within the pattern. They boded well for an upside break out.
- The gap bar pushed to a new high with exceptional volume.
- The bullish momentum followed through, and the market did not fill the gap.
Event-Driven Breakaway Gaps
Here’s one last note on identifying breakaway gaps.
They are powerful price occurrences. Thus, it’s uncommon that they form without underlying events. (e.g., earnings surprise or important announcements.)
Major fundamental events drive the formation of most breakaway gaps. Hence, tracking critical events that affect your stock helps to confirm them.
All traders will benefit from a deeper understanding of price gaps. But breakaway gaps are particularly relevant for position traders who combine fundamental analysis with technical analysis.
How To Scan For Breakaway Gaps?

You can use most stock scanners to scan for gaps.
However, you will need to review the chart manually to determine if it is a breakaway gap.
Here are three gap scanners you can check out:
Another method is to find breakaway gaps is to observe the earnings calendar. As discussed, critical events like earnings often drive gaps.
Hence, you can start by finding stocks that are:
- About to report their earnings; and
- Moving in a consolidation pattern
These steps will help you build a shortlist that you can monitor for potential breakaway gaps. This approach is anticipatory.
Here are three earnings calendars you can follow:
How To Assess The Quality Of A Breakaway Gap?
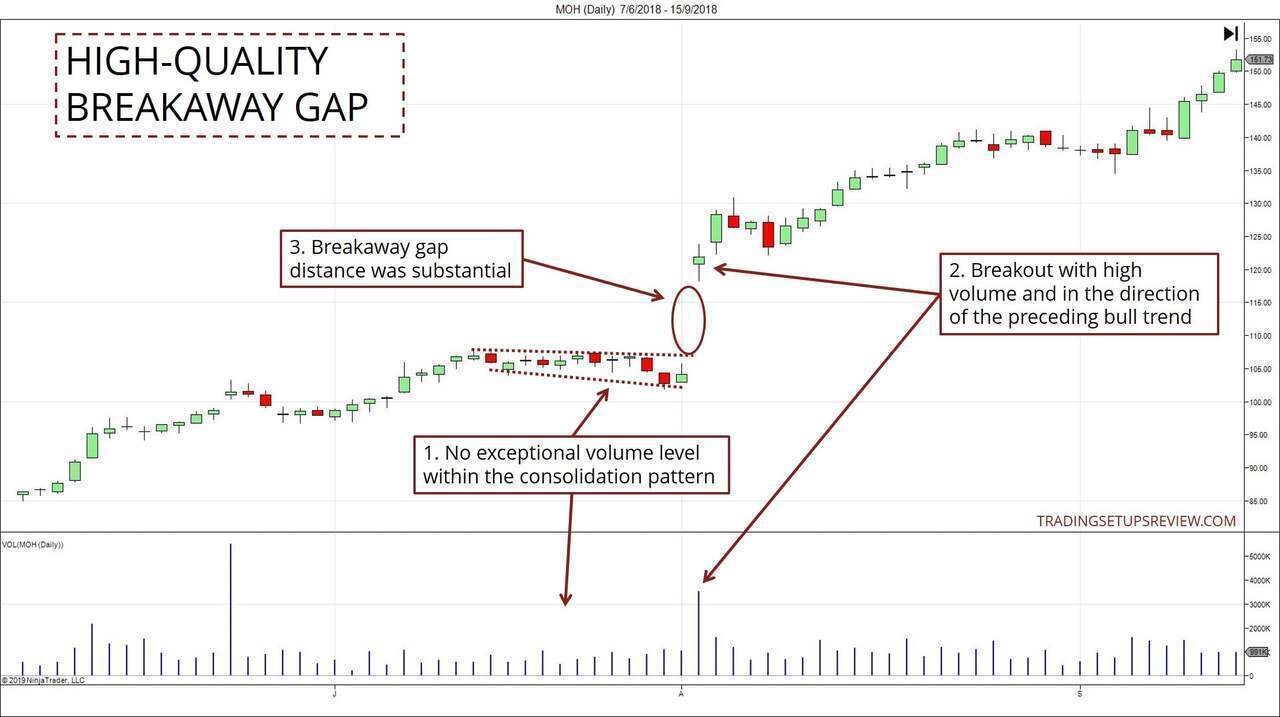
First, you want to see low volume within the consolidation base and high volume on the breakout gap.
Next, according to Bulkowski’s research, you should focus on breakaway gaps that have the support of the trend. Look at the market’s direction before it started consolidating. A breakaway gap in that same direction bodes well.
Finally, the gap distance gives a hint at the ultimate power in the trend.
However, the absolute dollar amount of the breakaway gap distance is not informative. Instead, you should use one of or a combination of the following methods:
- % Price Change
- ATR Multiple
- Chart Formation
% Price Change
This method helps to normalize the gap distance with respect to the stock price.
ATR Multiple
Take the distance of the gap and divide it by the ATR of the stock. This will give you a sense of the significance of the gap over the ATR lookback period.
Chart Formation
As we discussed, a breakaway gap breaks away from a chart pattern.
Take the gap distance and divide it by the height of the chart pattern. A higher number represents a more notable gap.
How To Trade A Breakaway Gap?
Aggressive Method
The aggressive method is to enter right after a breakaway gap.
But unless the trend takes off straight away, be prepared for adverse movement. This approach gets you into more trades but incurs higher risk.
For this strategy, you can place your initial stop-loss order just below the consolidation pattern. Then, find opportunities to tighten it as the breakout pans out.
Take a look at the example below.
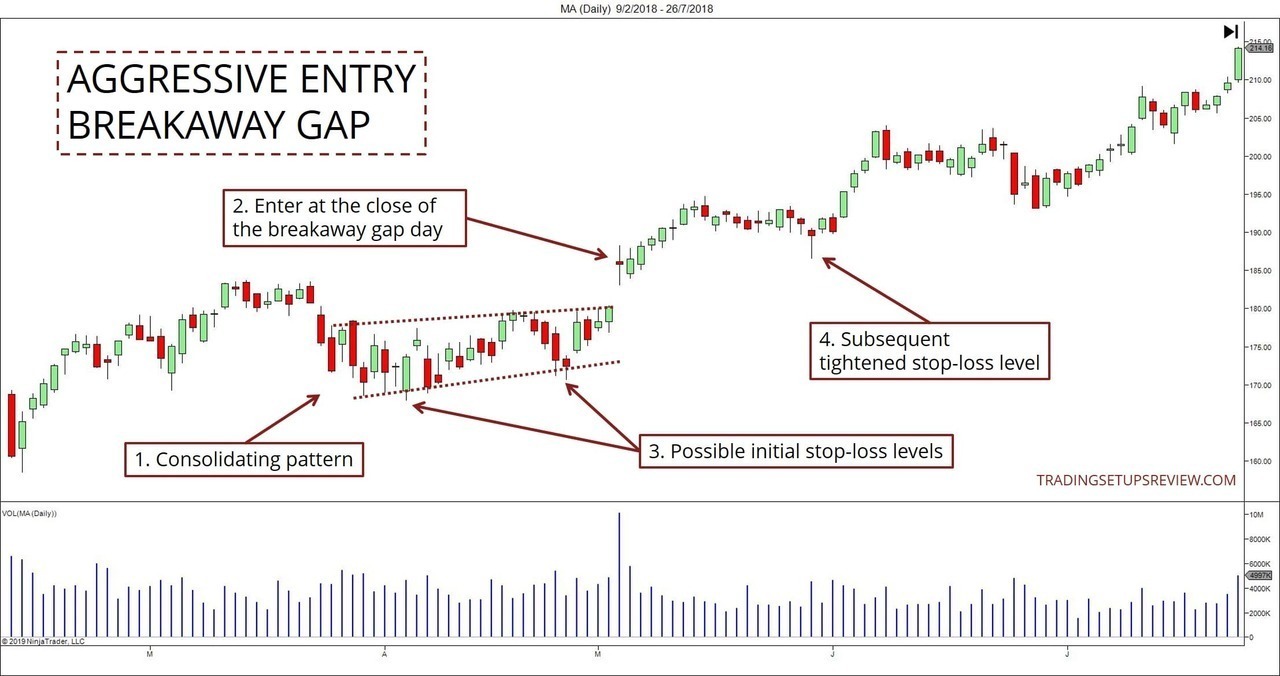
- The market moved sideways, forming a consolidation pattern.
- Enter a long position at the breakaway gap day close.
- These are possible initial stop-loss levels for this breakaway gap setup.
- You can then use this subsequent swing low to tighten your stop-loss.
Find putting the stop-loss below the consolidation pattern too risky? A valid alternative is volatility stop-losses.
Conservative Method
The conservative method is to enter on a pullback.
Ideally, the pullback should test the gap. But this is not essential. The problem here is that you might miss some superb trends that do not offer pullback entries.
One of the advantages of entering on a pullback is that you can place a much tighter initial stop-loss order.
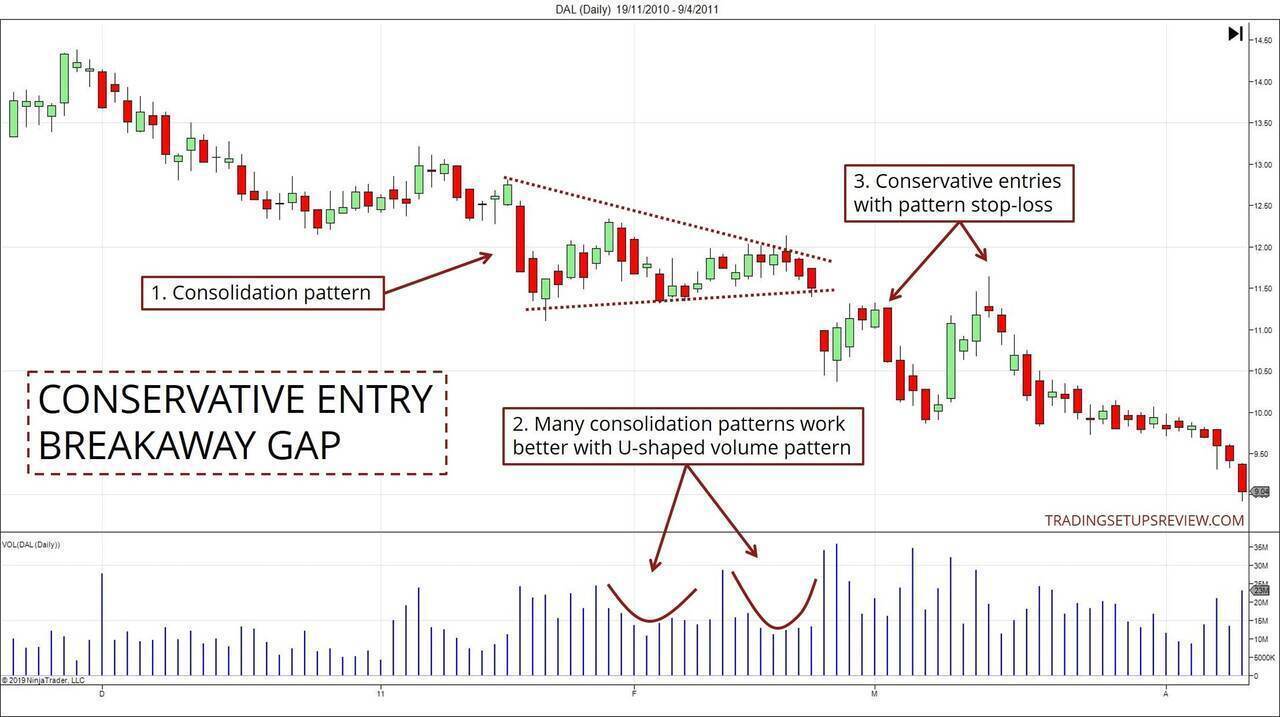
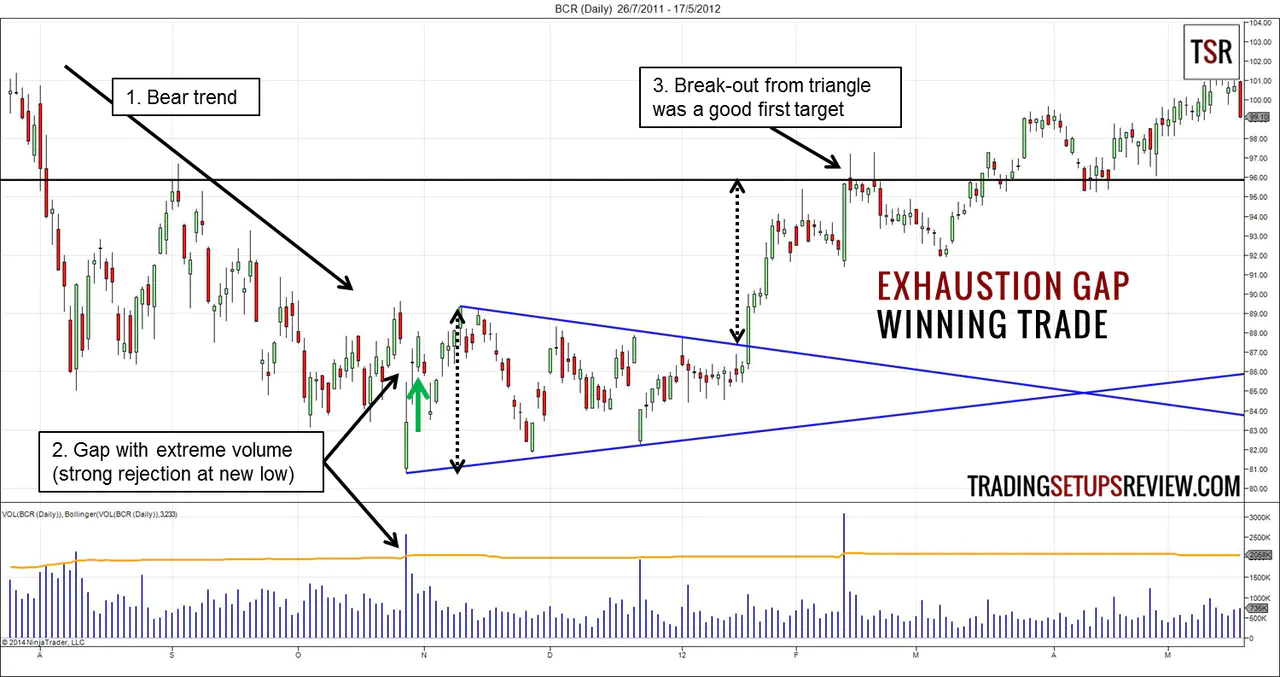
- The breakaway gap broke away from a triangle chart pattern.
- Most consolidation patterns work better with U-shaped volume patterns.
- Conservative entries with pullbacks to the gap. Here, the second entry with a bearish Pin Bar worked better.
How To Take Profit?
For a breakaway gap setup, there are three options you can consider for taking profits.
- Let profits run with a trailing stop-loss.
- Project targets with a chart formation.
- Wait for a continuation (or runaway) gap and project a target.
#1: Trailing Stop-Loss
Given that breakaway gaps start trends, trailing stop-losses are ideal as they allow profits to run. This tactic gives you a chance to capture most of a significant trend.
This approach helps you to tighten your stop-loss as well as letting your profits run.
Here are a few common trailing stop-loss strategies to consider:
- Trailing swing pivots
- Parabolic SAR
- Chandelier Stop-loss
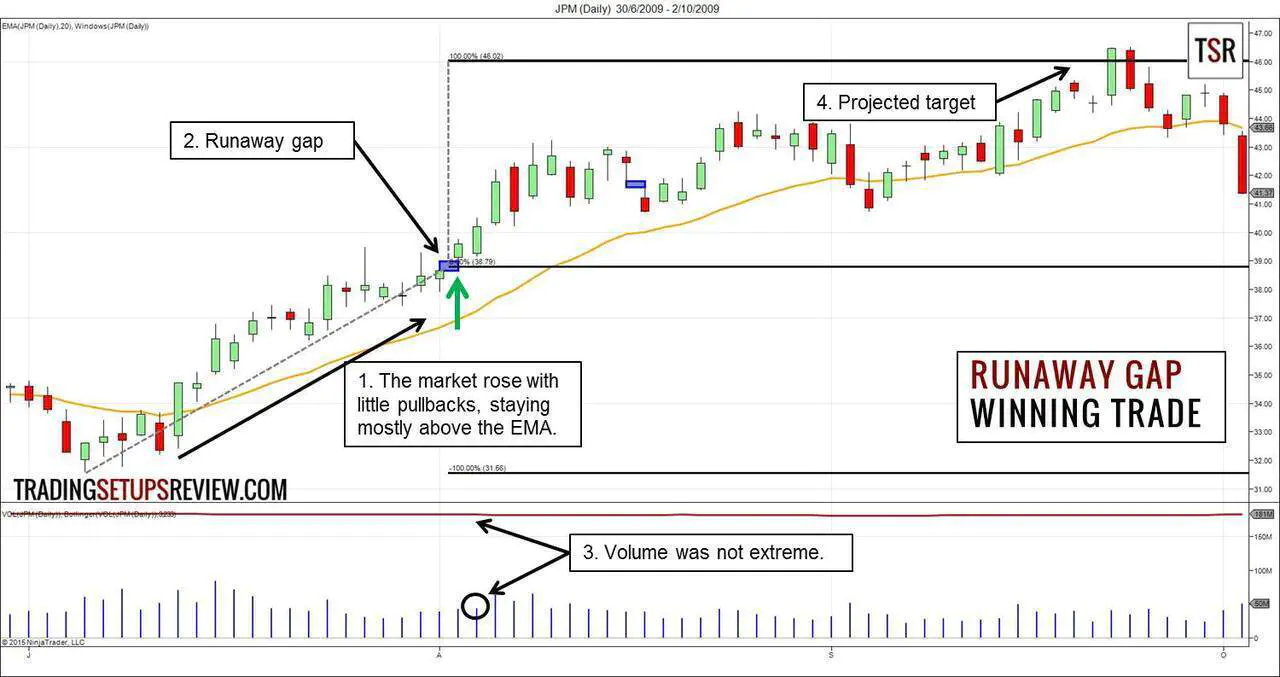
The example below shows how you can use the Parabolic SAR to trail stop-losses behind the trend following the gap.
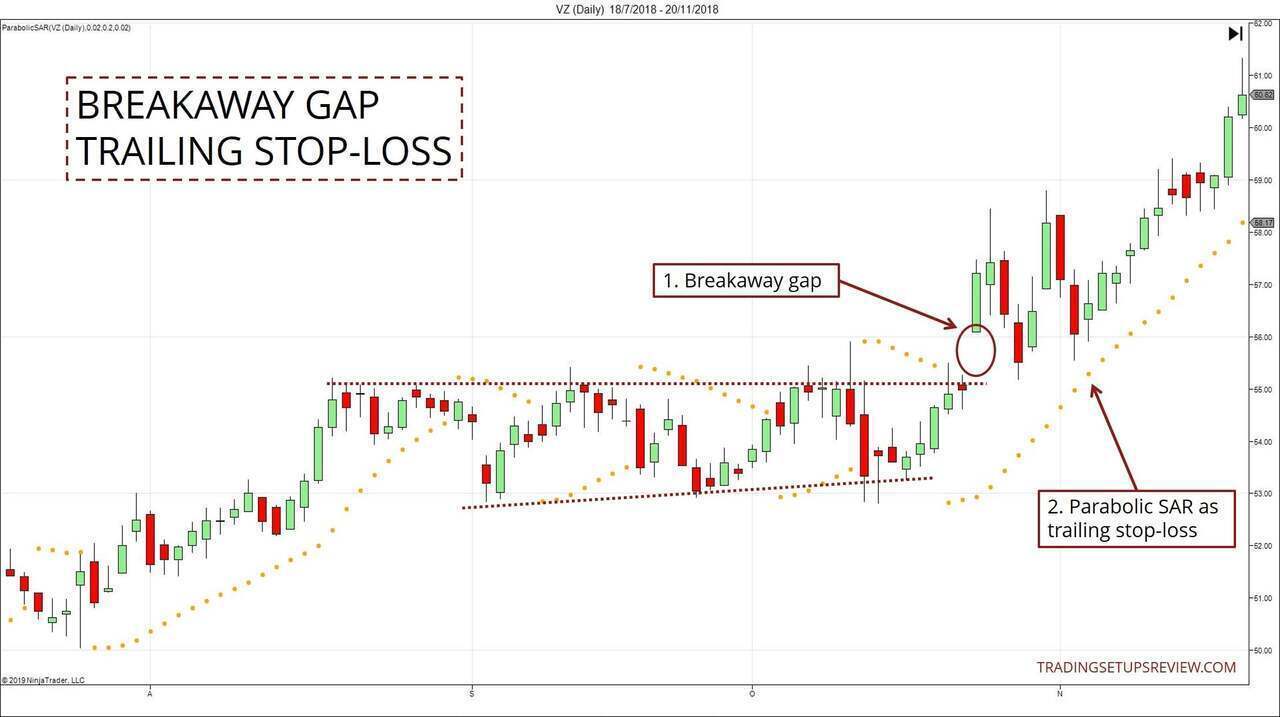
As the market rises, the Parabolic SAR will only be adjusted upwards and never downwards. This behavior makes it a natural candidate for trailing stop-losses.
#2: Projected Targets From Chart Patterns
All breakaway gaps hop away from a consolidation pattern like a wedge or a triangle.
The height of these chart patterns offers a basis for projecting a price target. Click here for a variety of examples.
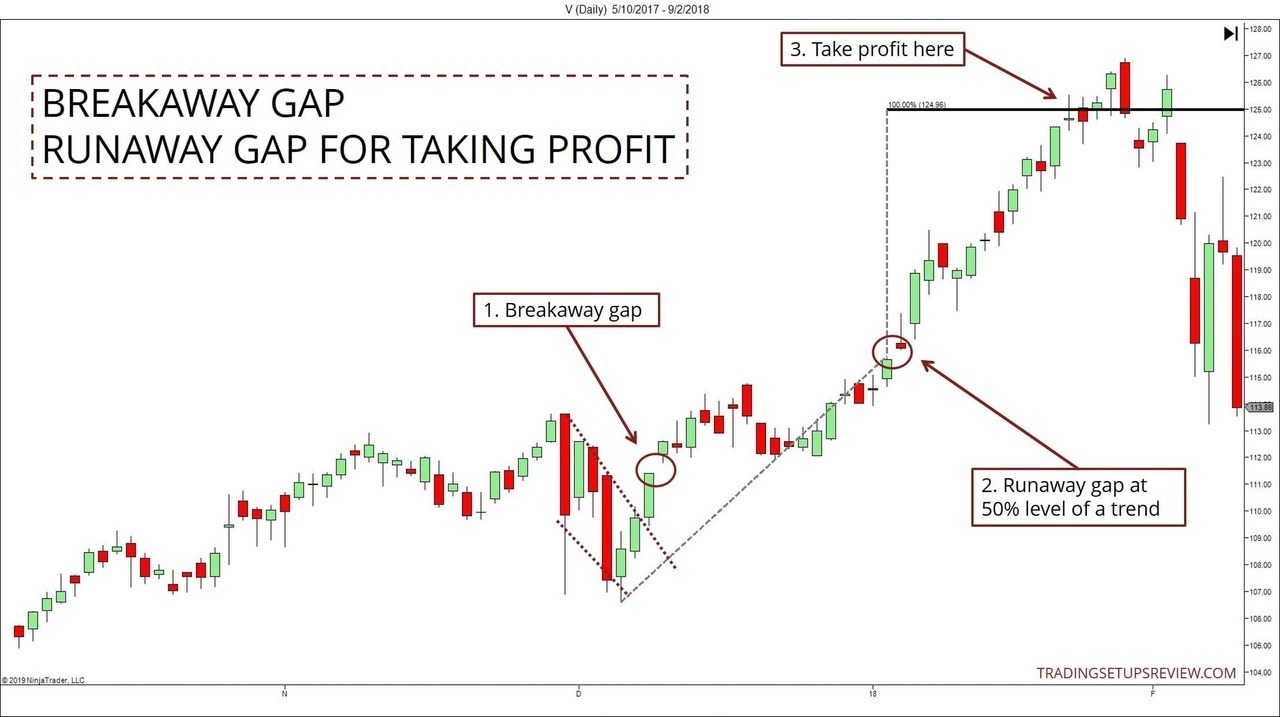
#3: Runaway Gaps
For traders who specialize in gap analysis, they like to use a runaway (or continuation) gap to set their target.
The premise here is that runaway gaps tend to form halfway through a trend. To project a target for a long setup:
- Measure the distance from the bottom of the consolidation pattern to the runaway gap.
- Project that distance from the runaway gap upwards to locate the target.
The main problem with this tactic is that a continuation gap might not form. So you should have a backup plan in place.
Conclusion
Designers talk about how whitespace is as essential as the design elements themselves. I’m not a designer, but I can tell you that this holds for candlestick charts.
The space between the candlesticks is critical; you cannot ignore gaps.
Breakaway gaps are not always dramatic, but they remain significant. Identifying consolidation patterns is a great way to prepare for breakaway gap setups.
Breakaway gaps offer the best reward-to-risk ratio. It takes a lot of experience to pick and trade the right ones, but given their tremendous profit potential, they are worth your time.