The Ultimate Parabolic SAR Trading Guide
By Galen Woods ‐ 9 min read
The Parabolic SAR is a unique and versatile trading indicator that complements price action. Learn to unleash its power to improve your trading strategy.
The Parabolic SAR (Stop And Reverse) is the brainchild of J. Welles Wilder who also invented the RSI indicator. It is a versatile trading indicator with unique properties. In this trading guide, you’ll learn how the Parabolic SAR through several trading strategies.
Guide Overview
- Introduction to Parabolic SAR
- How To Calculate
- The Intuition Behind
- Parabolic SAR Trading Strategies
- Indicator Settings
- Trade Management
- Trading Tips (with Bonus Resources)
Introduction to Parabolic SAR
These are a few basic facts about the Parabolic SAR.
- It is a trend-following indicator.
- It is plotted as a series of dots on the price chart itself and not in a separate panel.
- It trails behind price action.
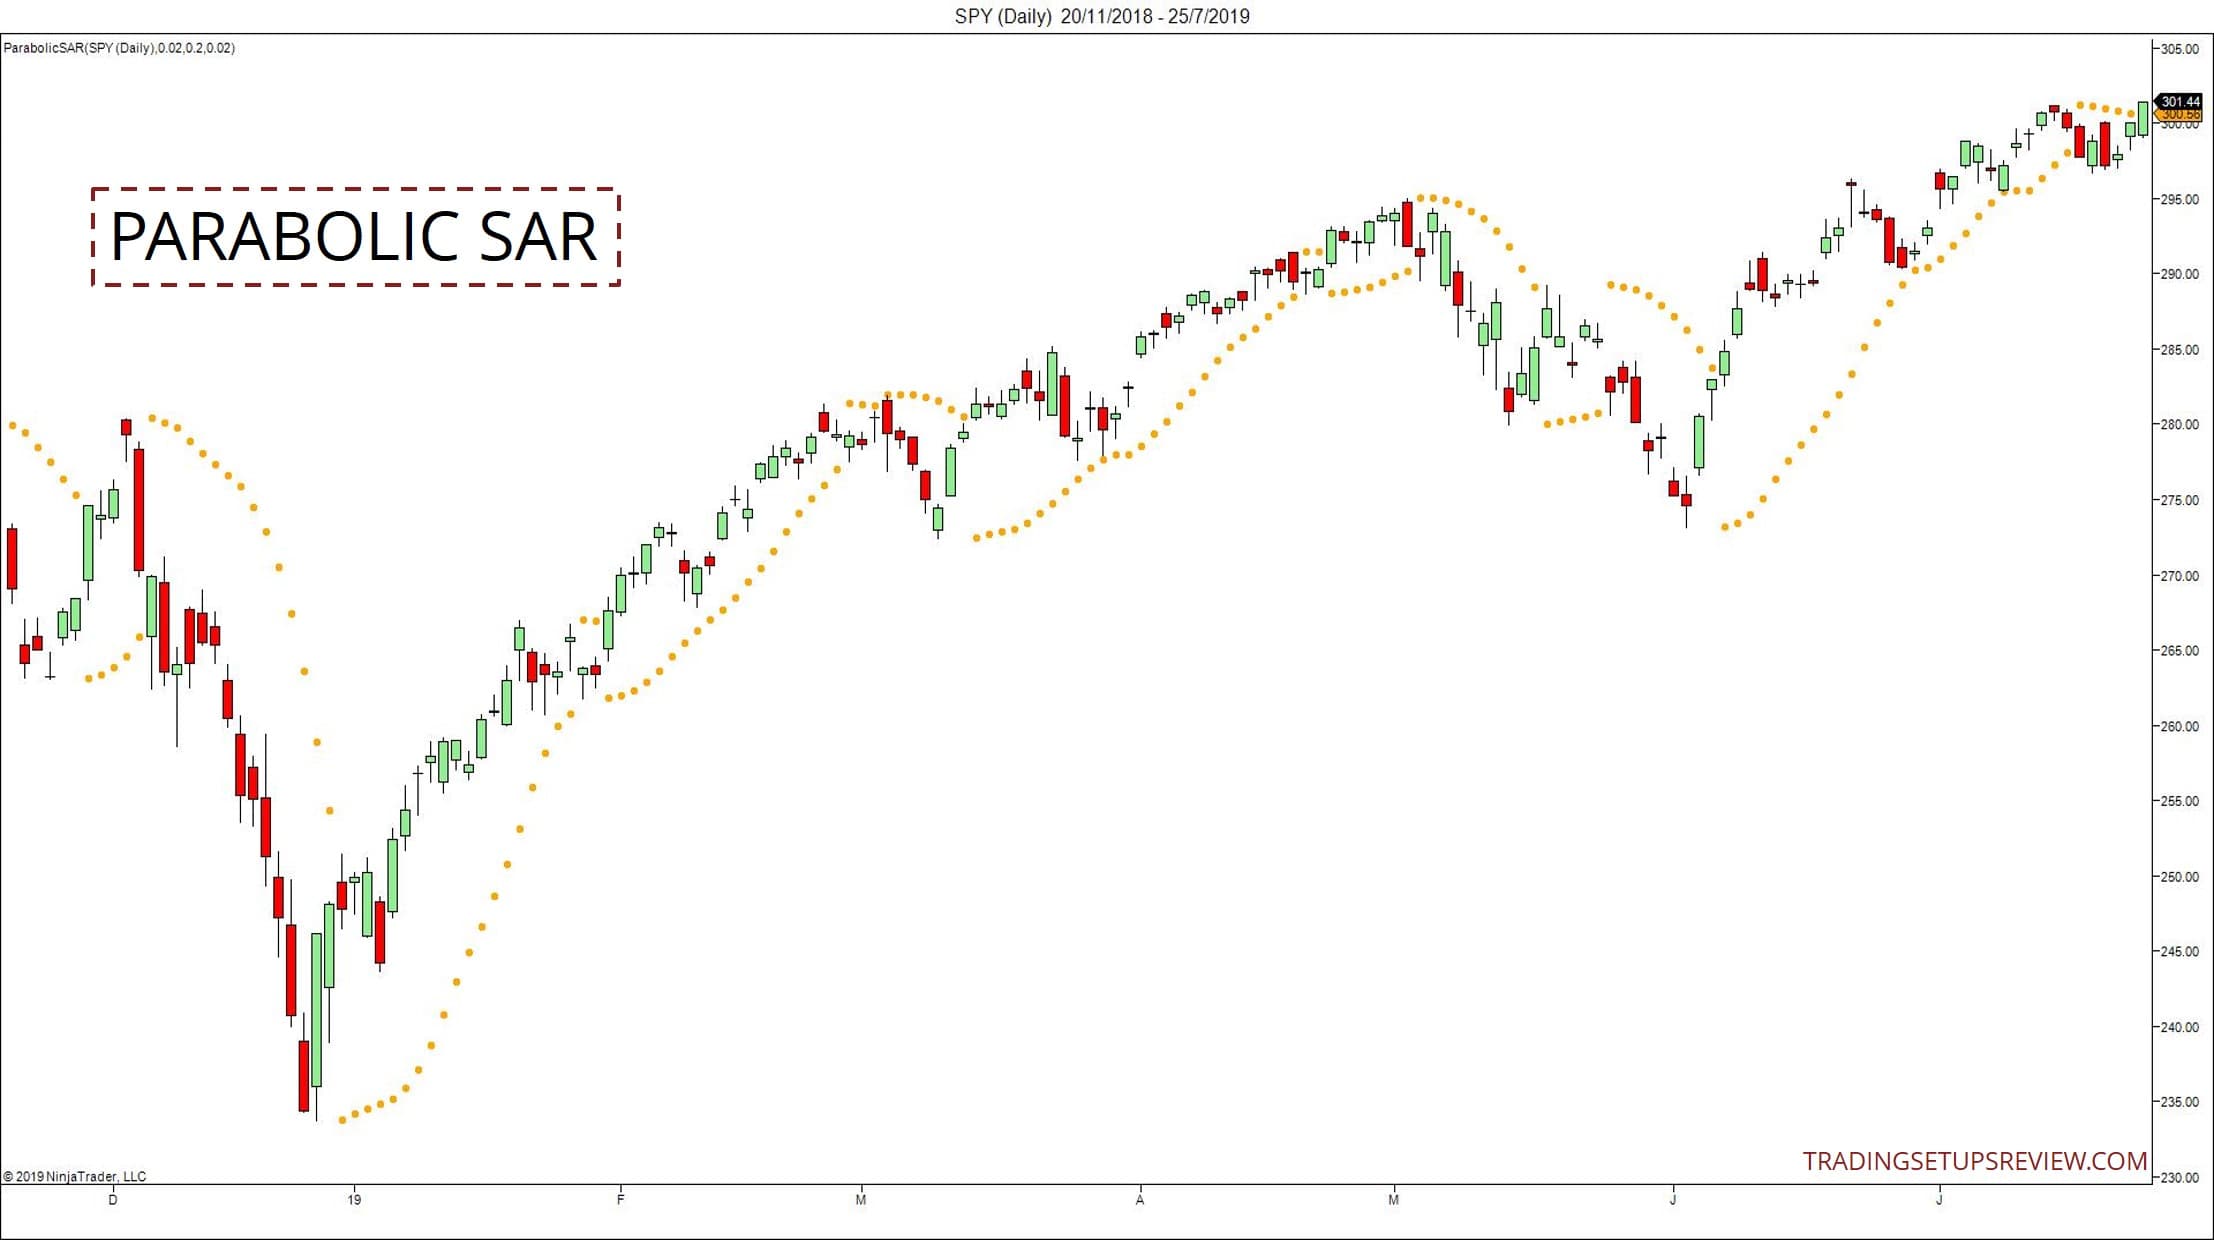
Basic interpretation
- Parabolic SAR below price: bullish trend
- Parabolic SAR above price: bearish trend
How To Calculate Parabolic SAR
(If this section causes giddiness, feel free to skip to the trading strategies
Parabolic SAR’s formula shows that it is different from a typical indicator. Most indicators have a mathematical formula that computes its value.
The Parabolic SAR has a mathematical part, but it also includes a logical part (an if/else loop). Paying attention to the function of the if/else logic will help you understand this indicator.
Some essential terms defined:
- Previous PSAR: The PSAR value in the prior period.
- Extreme Point (EP): The highest price attained in the current uptrend or the lowest price reached in the current downtrend.
- Acceleration Factor (AF): AF increases by a Step Value if the EP pushes to a new extreme. The default for AF is 0.02 and is increased by 0.02 each time the EP pushes to the new extreme.
- Max Acceleration Factor: This factor limits the AF regardless of the length of the trend.
This is the code for plotting Parabolic SAR on your charts.
Uptrend
Current PSAR = Previous PSAR + Previous AF x (Previous EP - Previous PSAR)
Downtrend
Current PSAR = Previous PSAR - Previous AF x (Previous PSAR - Previous EP)
As you can see from the formulae above, the AF is a critical value. It determines how sensitive the Parabolic SAR is to trending markets.
The EP reflects the extent of the trend. Hence, it plays a crucial role in determining the adjustment of the indicator in each period.
When does a trend change occur?
In an uptrend, if the market falls below the last SAR value, a Parabolic SAR downtrend starts. It uses the most recent EP as the first downtrend SAR value.
In a downtrend, if the market falls below the last SAR value, a Parabolic SAR uptrend begins. It uses the most recent EP as the first uptrend SAR value.
The Intuition Behind Parabolic SAR
If you found the calculation above complex, don’t fret. The computation might look intimidating. But the intuition behind the Parabolic SAR is straightforward.
Moreover, it is a surprisingly easy tool to use.
This is what you need to know.
The Parabolic SAR chases after price action.
The Acceleration Factor increases with each new price bar. This means that it chases after the price at an increasing rate.
In other words, it accelerates towards the market.
The implication here is that it places a premium on time. As time passes (as each bar completes), the Parabolic SAR moves ever closer to the price action, and it becomes easier to trigger a trend change.
In a nutshell, the Parabolic SAR is an impatient indicator. This time value aspect makes it unique.
Parabolic SAR Trading Strategies
In this part, you’ll review four trading strategies that use the Parabolic SAR as its primary tool.
- Basic Parabolic SAR Trading Signals
- Parabolic SAR With DM System
- Parabolic SAR With Moving Average
- Double Parabolic SAR Trading Strategy
#1: Basic Parabolic SAR Trading System
This strategy (and the next) comes from Wilder’s 1978 trading book - New Concepts in Technical Trading Systems.
This system has two characteristics:
- Stop and reverse
- All-in, all out
Each entry signal is also the exit signal. You exit your entire position and enter in the reverse direction.
Parabolic SAR Trading Rules
- If the Parabolic SAR is below the price action, trail a sell stop order at the most recent Parabolic SAR level.
- If the Parabolic SAR is above the price action, trail a buy stop order at the most recent Parabolic SAR level.
Parabolic SAR Trading Example
The chart below shows examples of buy and sell orders placed according to the Parabolic SAR.
- Red circles - Triggered sell stop orders
- Green circles - Triggered buy stop orders
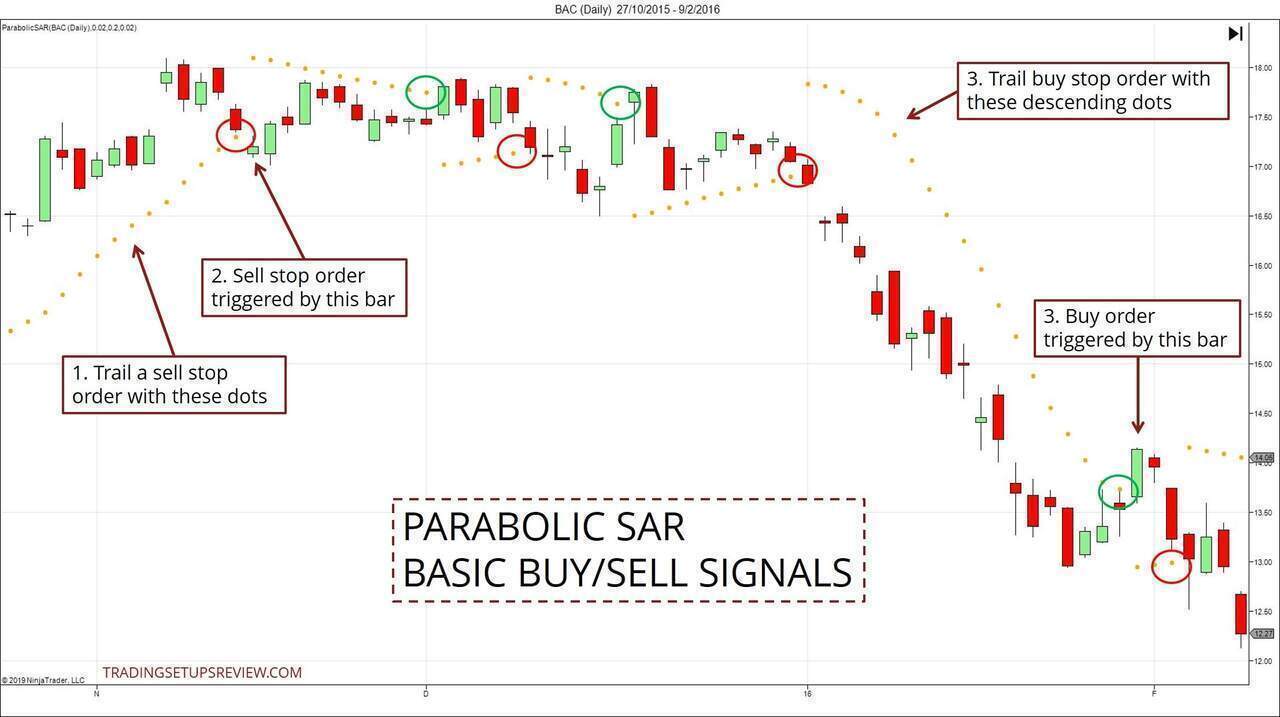
As you observe in this example, the Parabolic SAR does not perform well in a sideways market, as shown in the first part of the chart.
Hence, Wilder recommended the use of the Directional Movement System (DM) to augment it.
#2: Parabolic SAR + Directional Movement System
Wilder focused on designing complete systems that leave no room for ambiguity. This strategy combines the DM with the Parabolic SAR for a holistic trading system.
If you’re not familiar with the DM system, click here to learn more.
Parabolic SAR + DM Trading Rules
For this strategy, the entry rules are the same as Strategy #1, with these added filter rules:
- For all entries, ADX > 25.
- For long entries, DI+ > DI-.
- For short entries DI- > DI+.
Parabolic SAR + DM Trading Example
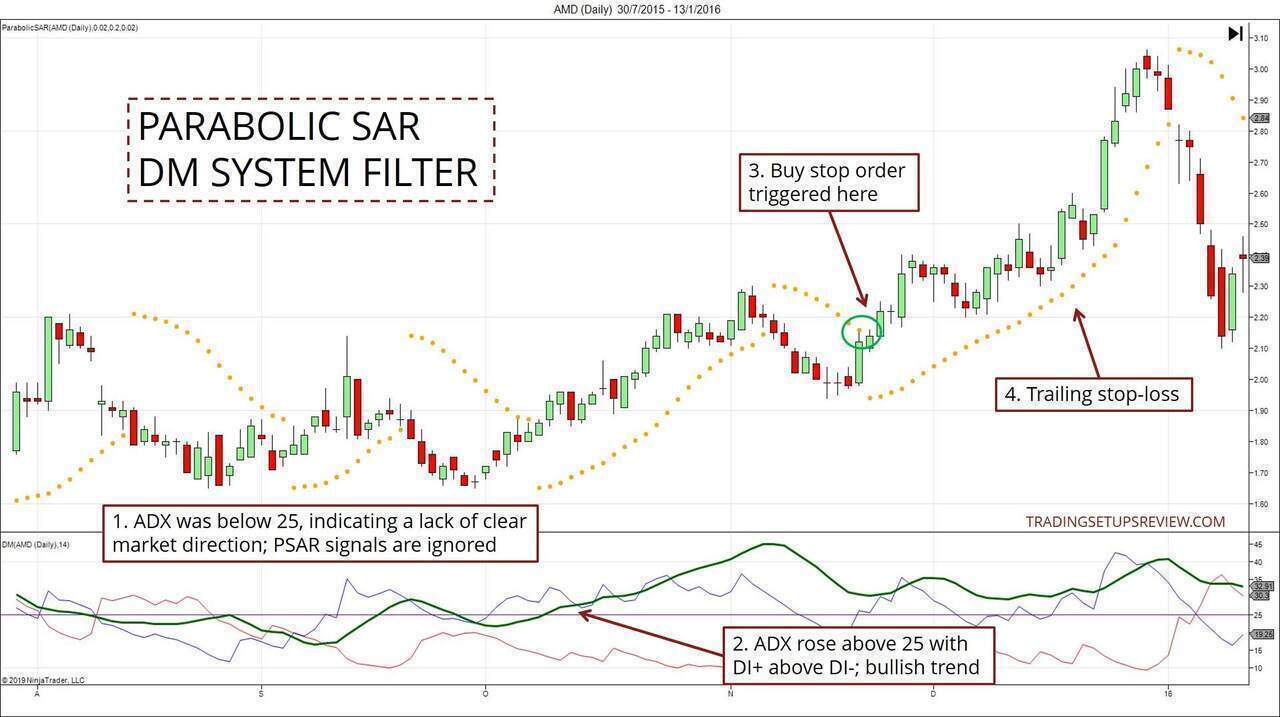
- The ADX was below 25. Ignore all signals.
- Here, the ADX rose above 25 and indicated a bullish market bias. (DI+ > DI-)
- This Parabolic SAR signal was the only one endorsed by the DM System on this chart.
- The DM System prevents a “stop and reverse” approach. Instead, use the Parabolic SAR levels for trailing your stop-loss.
This strategy might not be profitable when traded strictly. But it is an excellent learning example.
It showcases the Parabolic SAR as part of a complete trading system that includes:
- Determining market bias (DM)
- Entry (PSAR)
- Stop-Loss and Profit-Taking (PSAR)
#3: Parabolic SAR with Moving Average
Find the Directional Movement System too complicated?
You might want to opt for a more straightforward trading tool to determine the market bias.
Consider the Exponential Moving Average (EMA).
EMA Filter Trading Rules
- For buy signals, the 50-period EMA must be sloping upwards.
- For sell signals, the 50-period EMA must be sloping downwards.
EMA Filter Trading Example
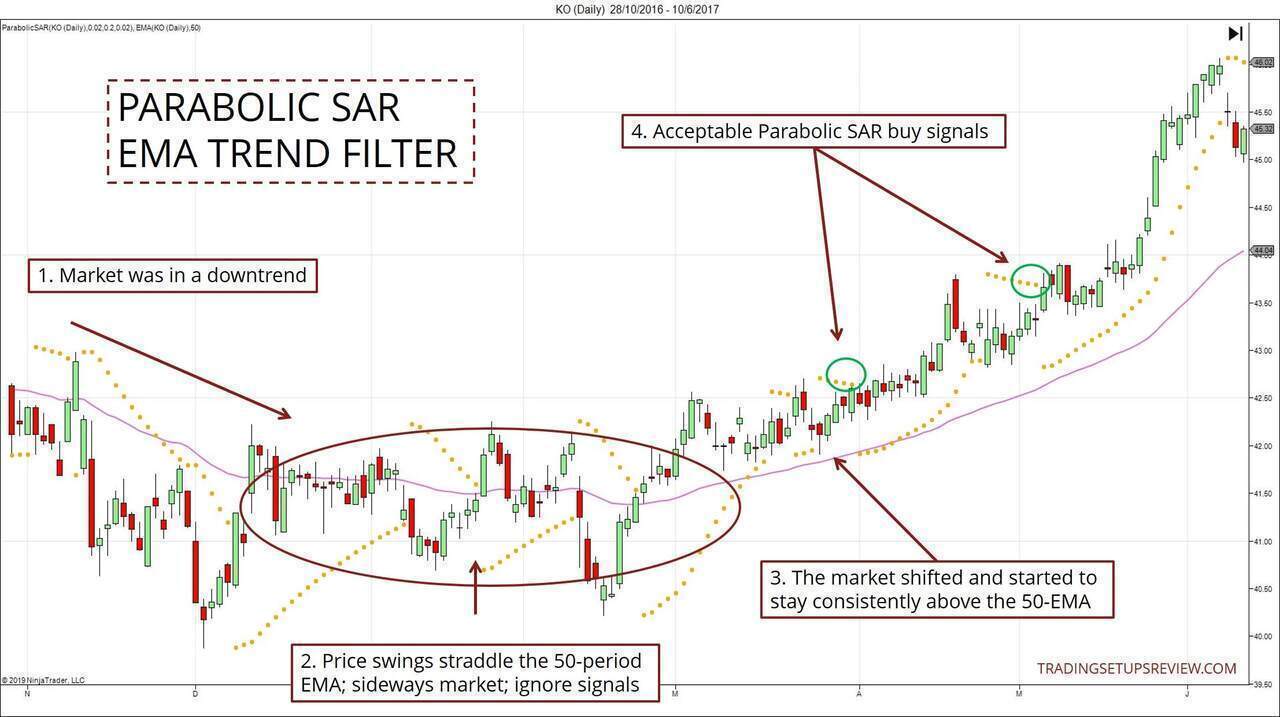
- The market was in a bearish trend.
- Watch out for price swings around a flat EMA. It signals a sideways market in which you should ignore all signals.
- Pay attention to the candlesticks here. You will notice a shift in their behavior. The market managed to stay above the EMA. It’s a hint to look for buy signals.
- According to the EMA trend filter, these two SAR buy signals were acceptable.
You can experiment with different lookback periods for the EMA.
However, assuming that you are using the default Parabolic SAR parameters, I recommend starting with intermediate to slow settings between 50 to 200 for the EMA.
#4: Double Parabolic SAR Trading Strategy
A Double Parabolic SAR strategy uses one Parabolic SAR to gauge the trend and another to time your entries and exits.
There are two standard implementations:
- Dual Timeframe
- Different Sensitivities
Dual Timeframe
First, you apply the indicator on two timeframes. The Parabolic SAR on the higher time frame guides your macro direction. Then, you look for precise signals on the lower time frame.
The chart below shows a weekly Parabolic SAR plotted on a daily candlestick chart.
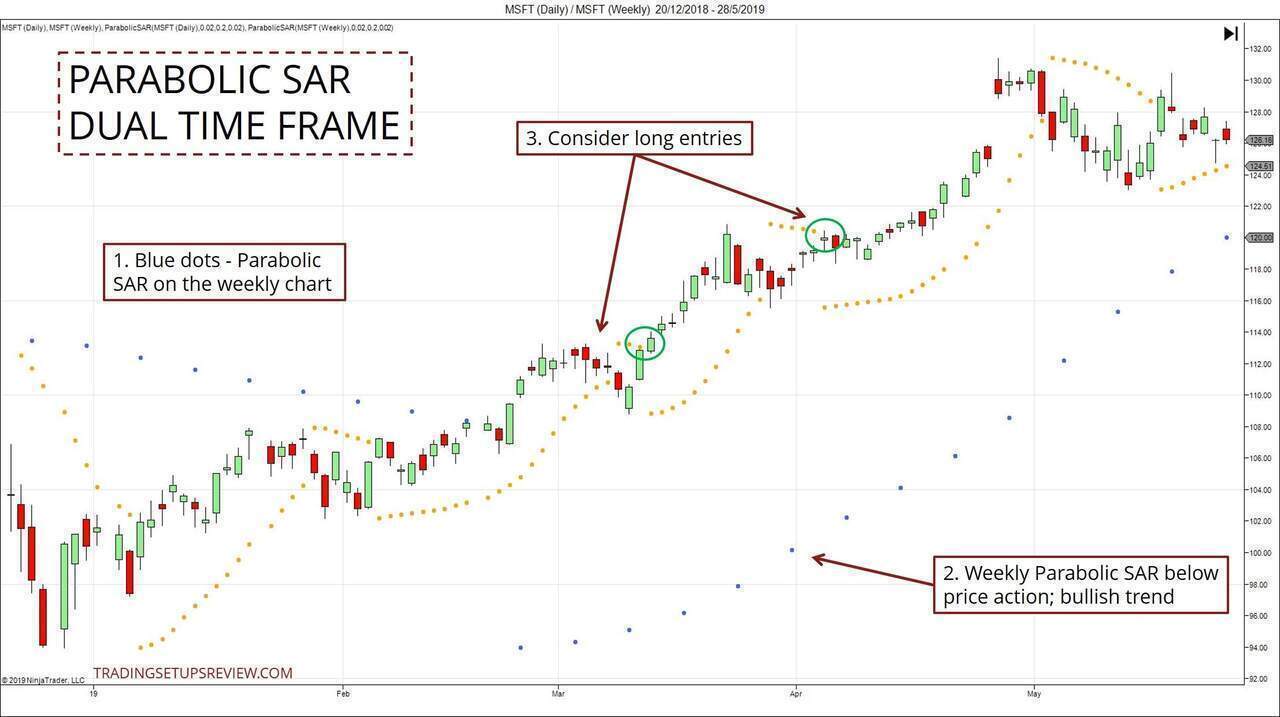
- The blue dots show the weekly Parabolic SAR.
- Here, the weekly plot stayed below the market, indicating a bullish trend.
- Since the market is bullish, consider only long entries.
Different Sensitivity
The other approach to try out is to use two Parabolic SAR plots on the same timeframe but with different sensitivities.
The less sensitive one will act as a trend indicator. The more sensitive one will provide our trade trigger. This approach is similar to a dual moving average trading strategy.
This video from SUCCESS TRADING TV shows an example of this approach.
Parabolic SAR Settings
So far, we have been using the default settings for the Parabolic SAR.
Go ahead and experiment with the settings according to your market and strategy. However, I do not recommend doing so if you’re new to Parabolic SAR.
For best results, finetune the indicator after you get a better sense of how to trade with it.
When adjusting the parameters, consider the following:
- The Step Size is the most critical parameter as it decides the sensitivity of the indicator.
- The Max Step Size also affects its sensitivity. However, its effect kicks in later and is more significant for price swings that last longer.
How To Use Parabolic SAR For Trade Management
Trade management refers to adjusting your trade orders after your entry. The purpose is to limit risk and maximize profit.
The behavior of the Parabolic SAR makes it a natural choice for trailing stop-losses. Moreover, as discussed, it places a premium on time.
It requires the trend to keep up its momentum, or it will force an exit. This attribute is helpful for options buyers who are paying a time premium.
Example - Trailing Stops and Taking Profits
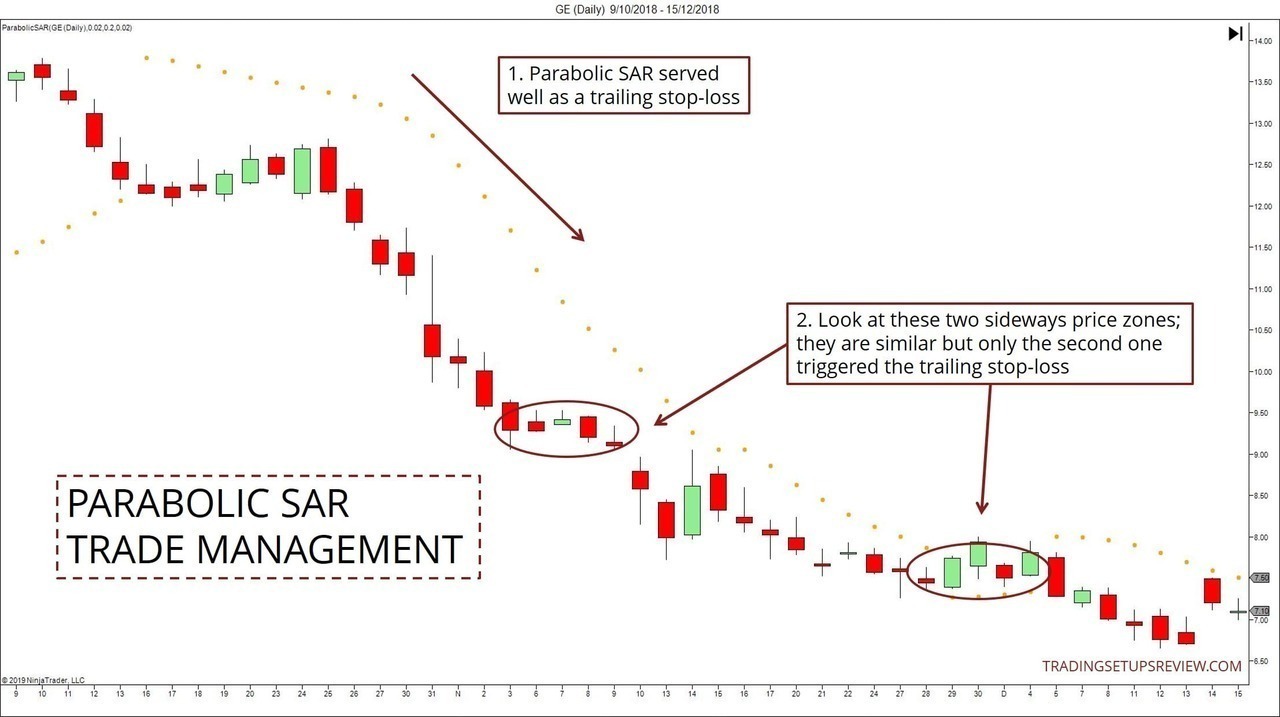
- These SAR dots help trail stop-losses.
- These sideways price zones look similar. However, only the second one triggered the Parabolic SAR. This is because the indicator becomes more sensitive over time.
How To Use Parabolic SAR Effectively?
Let’s conclude this guide with a summary of trading tips for the Parabolic SAR.
Do not use it in isolation. It does not perform well when there is no clear trend. It is critical to use another tool to determine market bias and take signals in its direction.
Wilder designed the Parabolic SAR for an always-in-the-market trading system. But you do not need to adhere strictly to it. Being selective is a better option for active traders.
Finally, when trading with the Parabolic SAR, start by considering how to deal with its inherent whipsaw problem.
Look at the trading strategies we went through above. They are the result of employing different tactics to avoid whipsaws.
Bonus Section: Parabolic SAR Trading Resources
Congratulations on completing this guide!
Now, it’s time for you to load up your charts and explore detailed applications.
Here are some resources to help you do that.
Charting Platforms
Most charting platforms offer the Parabolic SAR indicator.
If your platform does not have it, consider switching up. These are a few platforms you can use to apply the Parabolic SAR to a variety of markets:
- TradingView (works from your browser)
- NinjaTrader (great for futures trading)
- MetaTrader (popular among forex traders)
Books and PDFs
- Technical analysis of Forex by Parabolic SAR [PDF] - Backtest on hourly forex data
- MACD Trend Forex Trading Strategy With Parabolic SAR and ATR [PDF] - Combining Parabolic SAR with MACD for a momentum setup
- COMPARISON OF THREE TECHNICAL TRADING METHODS VS. BUY-AND-HOLD FOR THE S&P 500 MARKET [PDF] - One of the compared methods uses the Parabolic SAR
- New Concepts In Technical Trading Systems by J. Welles Wilder - The source
