Moving Average Fake-Out
By Galen Woods ‐ 4 min read
In "The Logical Trader", Mark Fisher introduces the moving average fake-out trading setup which uses multiple moving average for establishing trading bias.
Mark Fisher introduced the moving average fake-out trading setup in his book, “The Logical Trader”. This trading strategy uses moving averages to find false counter-trend moves (fake-outs).
As Mark Fisher mentioned, you can use this concept to enter a trading position or a trading bias.
The moving averages in this strategy do not use the closing prices. Instead, they take the average of the pivot point (typical price) of each bar.
Pivot Point = (High+Low+Close)/3
Trading Rules - Moving Average Fake-Out
Long Fake-Out
- All three SMAs of pivot point sloping up (14-period, 30-period, 50-period)
- Pullback down to 14-period SMA without crossing below 30-period SMA
- Enter long when prices rise above the lowest earlier high above the 14-period SMA
Short Fake-Out
- All three SMAs of pivot point sloping down (14-period, 30-period, 50-period)
- Pullback up to 14-period SMA without crossing above 30-period SMA
- Enter short when prices fall below the highest prior low below 14-period SMA
Moving Average Fake-Out Trading Examples
Winning Trade - Bullish Setup
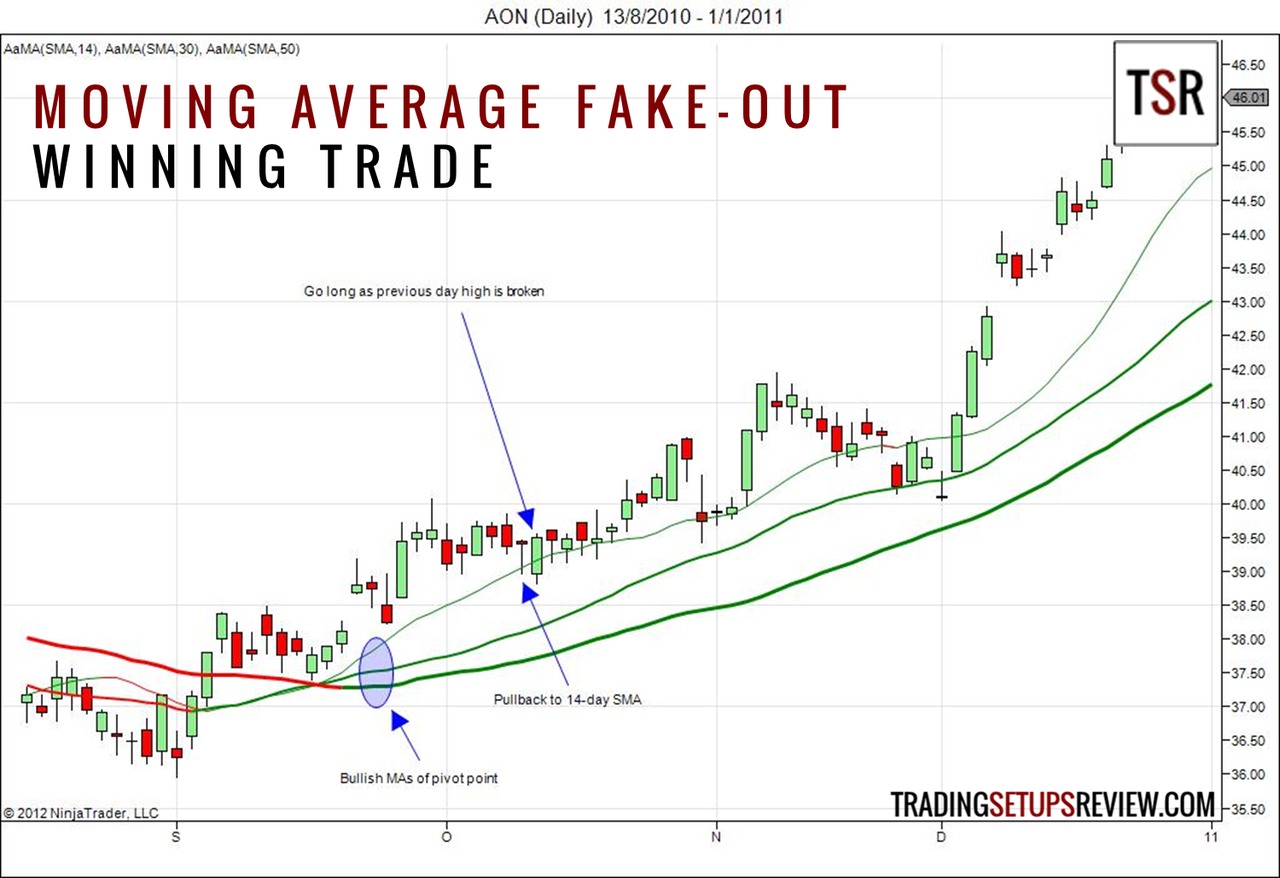
This is a daily chart of AON Corporation listed on NYSE. The colour of the moving averages highlights their direction.
The slope of all three moving averages sloped up, and prices continued to rise above the moving averages. A sideways drift to the 14-period moving average gave us the moving average fake-out setup.
We placed a buy stop order above the high of the first bar that tested the 14-period moving average. AON triggered the order the next day and led us into an extended bull trend.
The trade setup bar that tested the 14-period moving average had a long bottom tail. It was a sign of bullish support after the moving average fake-out. The next day was a bullish outside bar that confirmed the support at the moving average.
Losing Trade - Bullish Setup
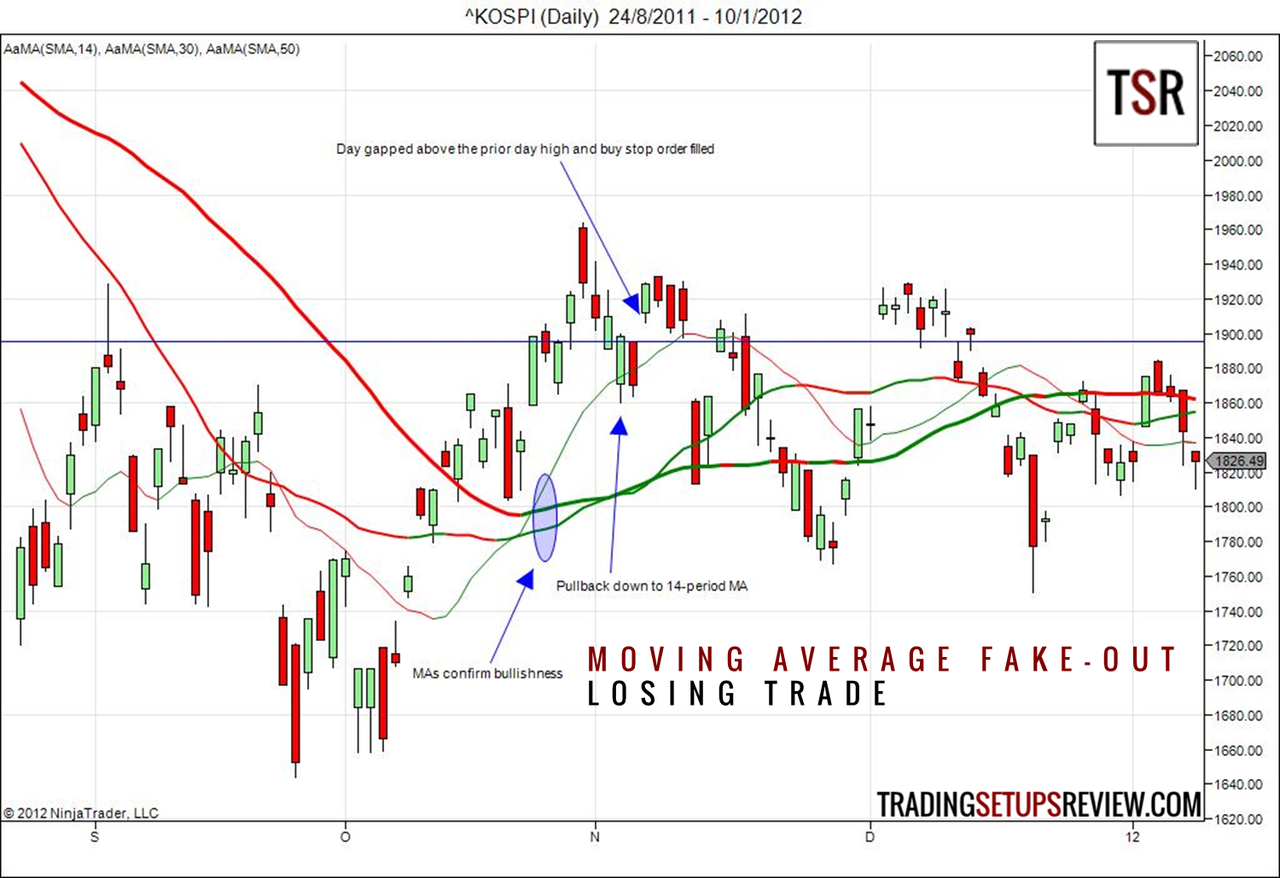
This is a daily chart of the Korea Composite Stock Price Index (KOSPI) which tracks all the stocks listed on the Stock Market Division of the Korea Exchange.
The three moving averages sloped up to confirm the bullish price action. Then, we saw a pullback down to the 14-period moving average. Prices tangled with it for two days before gapping up to trigger the buy order. The blue horizontal line marks out entry price.
The trade moved against us immediately. A few days later, a strong down gap forced us to exit with a loss.
This moving average fake-out setup was reasonable. The first bar that tested the 14-period moving average was a bullish reversal bar. The bearish inside bar after it represented the second unsuccessful attempt to push prices down. These were bullish signs.
However, the climatic upthrust before the pullback was troubling. Climaxes tend to lead to either reversal or sluggish price action. Each of the three bars following our entry gapped up before closing down. These are signs of strong selling pressure which warned the alert trader to get out before the large gap down.
Review - Moving Average Fake-Out Strategy
The moving average fake-out trade setup is a pullback trading strategy. The use of multiple moving averages is usually redundant.
Just One Moving Average: How To Trade With Only The 20-Period Moving Average
The more the merrier does not apply to the number of moving averages on your chart.
Fortunately, this trade setup uses only three moving averages which are the most my brain can process. In addition, the periods 14, 30 and 50 are all intermediate periods that are relatively meaningful.
A short period moving average is a close proxy of price itself and only serves to confuse price action. On the other hand, a long period moving average lags as a trend indicator and is helpless in filtering ranging conditions.
However, by focusing on the slope of these intermediate moving averages, Mark Fisher has created a nice package of multiple moving averages.
Look at the KOSPI chart above. Despite the losing trade, the moving averages managed to keep us out of the later sideways market as the slopes of the moving averages hardly agree for any trade to take place.
A key feature of Mark Fisher’s moving average fake-out setup is the usage of pivot points instead of bar closes for the moving averages. It does not make much difference except for some smoothing of the averages. In fact, the closing price of each day is more significant as it is the price that all players contributed to by the end of each trading session.
However, for intra-day charts, especially for non-time-based charts including tick and volume charts, that have arbitrary bar closes, using pivot points is a good idea.
Mark Fisher suggested the moving average fake-out method as a way to augment other trading strategies in his book.
See: The Logical Trader