A Simple Day Trading Strategy Using Bollinger & MACD
By Galen Woods ‐ 4 min read
Learn a simple day trading strategy using Bollinger Bands and MACD by Markus Heitkoetter. Two indicators and two steps to profit from intraday trends.
This simple day trading strategy was published on TradingMarkets.com by Markus Heitkoetter, a day trading coach from Rockwell Trading. He is also the author of The Simple Strategy - A Powerful Day Trading Strategy For Trading Futures, Stocks, ETFs and Forex.
This day trading setup uses the MACD indicator to identify the trend and the Bollinger Bands as a trade trigger.
The MACD parameters are:
- 12 for the fast moving average
- 26 for the slow moving average
- 9 for the signal line
The Bollinger Bands settings are:
- 12 for the moving average
- 2 standard deviations for the bands
Trading Rules
Rules For Long Day Trade
- MACD above signal line and zero line
- Place buy stop order at the upper band of Bollinger Bands
Rules For Short Day Trade
- MACD below signal line and zero line
- Place sell stop order at the lower band of the Bollinger Bands
Trading Examples - Day Trading with Bollinger & MACD
Winning Trade
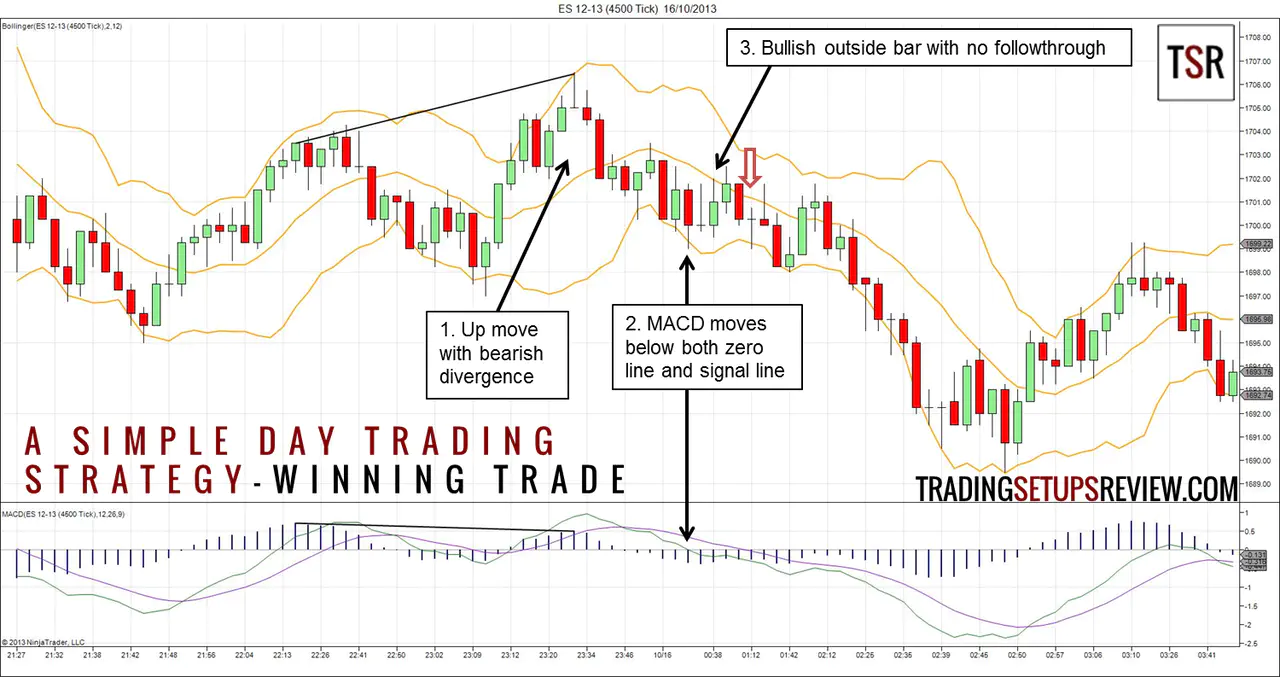
In his article, Markus Heitkoetter used the trading time frame of 4500 ticks for S&P E-mini contract. It means the chart plots a bar every 4500 trades. To keep things simple, we followed the recommended timeframe.
The day started off in congestion before having a nice bear run. This simple day trading strategy managed to catch the beginning of this bear run for a nice profit.
Let’s take a look at this trade in detail.
- We had the most potent bull run of the day here. However, this higher high coincided with a lower high on the MACD histogram. This occurrence is a bearish divergence, a warning sign for reversal. This bearish divergence set an excellent context for short trades.
- Here, prices fell, and MACD moved below both the zero line and its signal line. That was our cue for a downtrend. A sell stop order was placed at the lower Bollinger Band to anticipate a short trade.
- After the MACD had confirmed a downtrend, a bullish outside bar formed but had little follow-through. It was the last bullish attempt before prices broke down further.
Finally, as prices pushed through the lower Bollinger Band, our sell stop order was triggered. And we have a winner.
Losing Trade
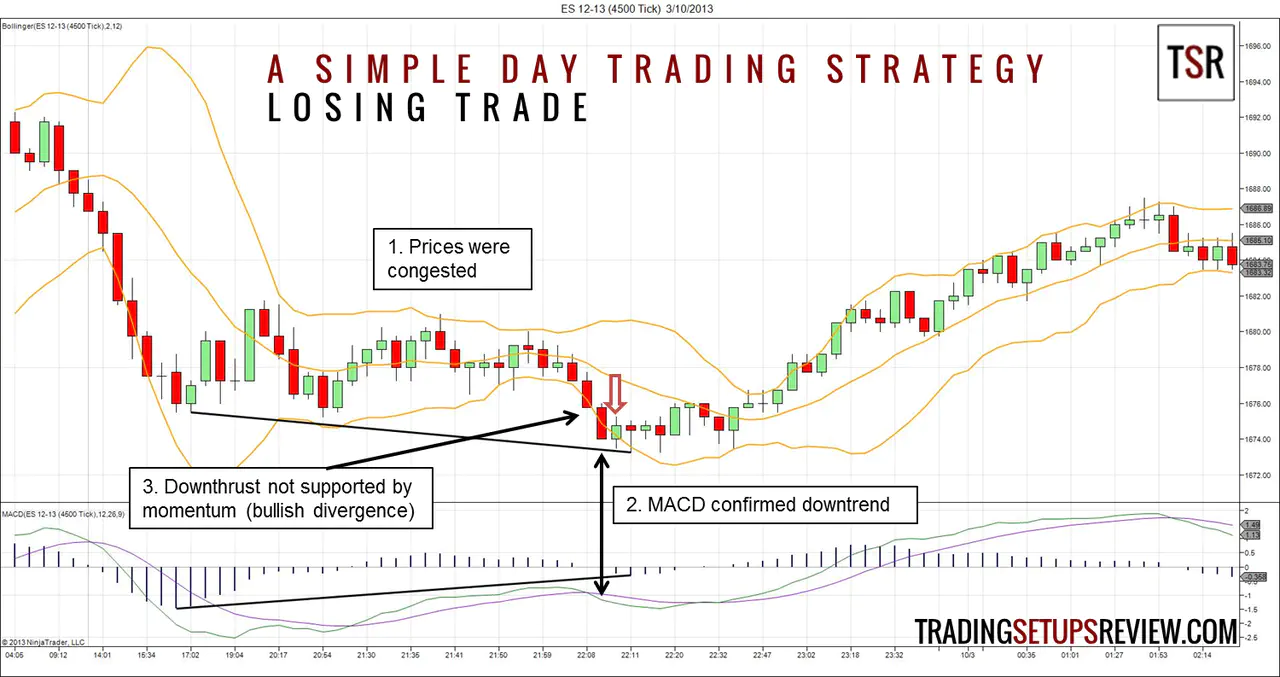
Just like the first chart, this is a 4500 tick chart of the S&P E-mini contract on a full Globex session.
The simple day trading strategy triggered a short trade at the red arrow. It was the worst entry point for us.
Let’s break this down and try to understand what was going on.
- The day started off congested as shown by the increasing tails and smaller bodies on each candlestick. The constricting of the Bollinger Bands was another indicator that volatility was dropping.
- A congestion inevitably leads to a breakout. The three consecutive red bars was the breakout from the congestion. At the same time, MACD confirmed a downtrend for us, and we entered short at the lower Bollinger Band. (red arrow)
- However, the downthrust punched out a lower low that was not supported by the MACD momentum. That was a bullish divergence that warned us against taking this trade.
Ultimately, this breakout downwards turned out to be a morning fake reversal. We entered short at the low of the day.
What could be worse? (Not having a stop could be worse.)
Review - A Simple Day Trading Strategy using Bollinger and MACD
Using only two indicators and two simple steps, this is indeed a simple day trading strategy.
I have tried it on different time frames and found this day trading strategy to be surprisingly robust for catching breakout trends.
By demanding that the MACD rises not only above its signal line but also its zero line, this day trading strategy can locate short-lived intraday trends. This application of MACD is starkly different from Gerald Appel’s original basic MACD trade.
If you want to restrict yourself to only high probability trades, take setups that occur after MACD first crossed the zero line. This rule will keep you in fresh trends and not the maturing ones that are more likely to reverse.
There is a significant caveat about the exit strategy. I did not follow the exit method recommended by Markus Heitkoetter as I wanted to keep things simple.
He used a certain percentage of the average daily range of the past seven trading days to determine his stop and target size. It is a sound approach based on volatility, but it increases the number of parameters involved.
You have to choose how many days to include in your average trading range and the percentages to use for your stop and target sizes. You also have to ensure that these parameters are consistent with your trading time frame. Like what Markus Heitkoetter pointed out, he updates the tick setting for the instruments they regularly trade to account for changes in market volatility.
So, unless you can keep up with adjusting those parameters, you might want to consider a more straightforward way to exit your trade.
Tired of complicated trading strategies? Learn how to profit from the most straightforward two-bar pattern that anyone can spot.