Reliable Support and Resistance Zones with High Volume Signals
By Galen Woods ‐ 8 min read
Learn how to find high volume signals to find reliable support and resistance. Use them to gauge market interest and follow the path of least resistance.
Price never moves in a straight line. Price action bounces up and down between support and resistance levels. When skilled price action traders analyze a chart, they often focus on finding support and resistance zones. In this article, you’ll learn to find reliable S/R zones with high volume bars.
Traders look at significant support and resistance for market bias. We also make use of minor support and resistance for timing purposes.
It is evident that support and resistance is a crucial price action trading concept. Hence, it is not surprising to find a myriad of techniques for projecting support and resistance.
Traders tend to buy in areas of support and sell in areas of resistance. But they do not react to support and resistance for no reason. They do so because they are interested in those price levels.
How do we gauge interest?
The best way to gauge market interest is by observing volume.
When a price zone gets the interest of the market, the market trades. And volume surges.
Hence, by paying attention to volume clues, we can find reliable support and resistance areas. The easiest way to find volume-based S/R is to focus on climatic volume signals.
While they do not occur often, you cannot miss them when they do.
Identifying High Volume Signals
The immediate questions that come to mind:
- What are climatic volume signals?
- How do you identify them?
Here, I will use the benchmark that I applied to identify Anchor Bars and Exhaustion Gaps.
The benchmark is the Upper Bollinger Band applied on volume with a look-back setting of 233 and a displacement of 3 standard deviations.
(There’s nothing magical about the setting of 233, but you should use a long-term parameter so that you get a stable Bollinger Band. Short-term parameters tend to produce erratic bands.)
If a price bar shows volume that exceeds this benchmark, we will zoom in and use it as potential support or resistance area in our price analysis.
The simple steps:
- First, find a high volume price bar.
- Then, project lines horizontally at its high and low prices.
- The area between is the potential support or resistance area.
For consecutive high volume candlesticks, blend them, and mark only the high and low of the blended candlestick.
If you’re still unsure, the chart below will clarify the process.
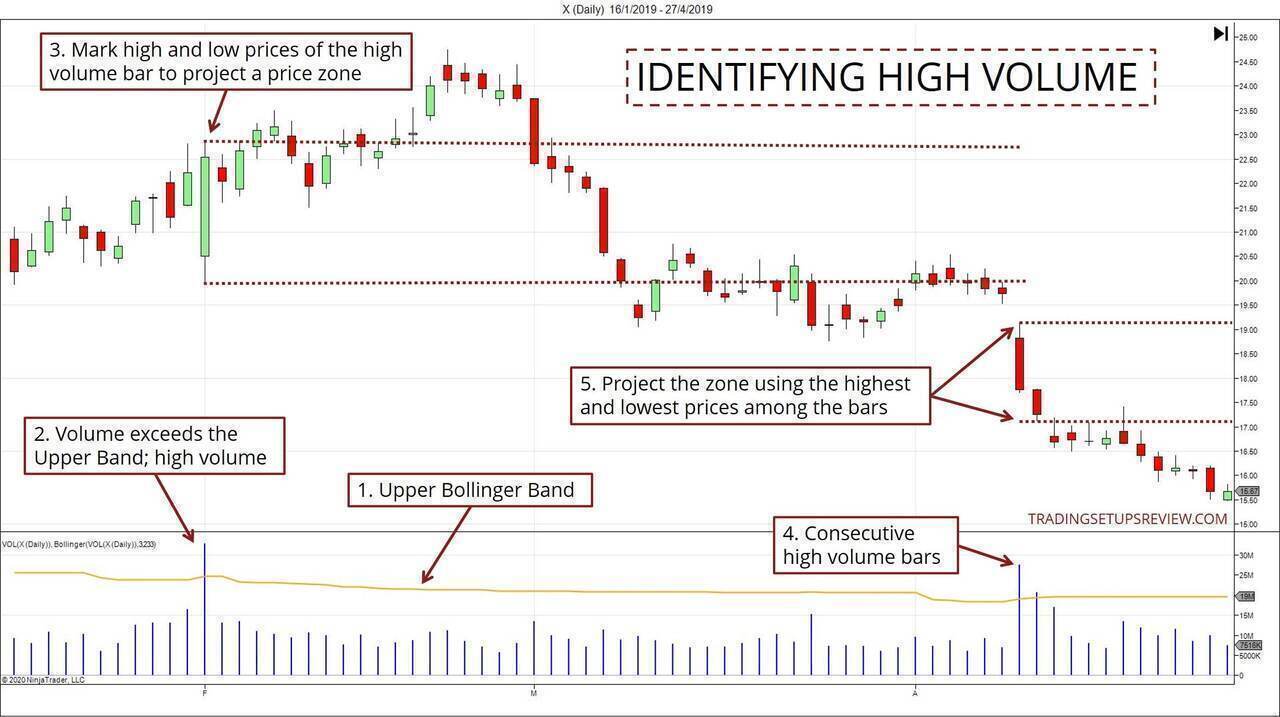
- This orange line in the lower panel is the Upper Bollinger Band applied on volume. (The Mid and Lower bands are hidden.)
- If a price bar shows volume exceeding the orange line, it is deemed a high volume bar.
- Mark the bar’s high and low to establish a price zone (potential S/R).
- Consecutive high volume bars.
- Consider them collectively and project the price zone with the highest and lowest price points.
How To Add The Upper Bollinger Band on Volume
The Bollinger Bands on Volume is not a default feature in most charting platforms. However, it’s easy to configure it with a capable charting platform that allows changing the input series.
Here are the instructions for NinjaTrader and TradingView.
For NinjaTrader
The screenshot below is from NinjaTrader 7, and the setup for NinjaTrader 8 is similar.
With the Volume indicator applied, configure a Bollinger Band with the following settings:
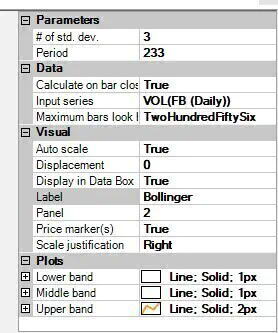
In particular, take of the following fields:
- Input series changed to the VOL indicator and not the default price series.
- Panel number is the same as the Volume indicator.
- Plots are configured to be transparent for the “Lower band” and “Middle band.”
For TradingView
Update: I created a simple indicator on TradingView to highlight volume spikes based on this concept. You can use it to help you spot high volume bars for further study. (It’s free to use.)
In TradingView, with the Volume plot applied, configure the Bollinger Band indicator with the following settings:
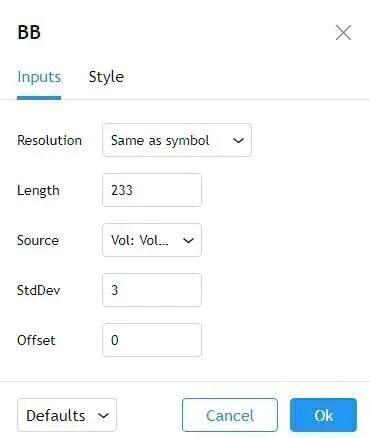
- Source is set to Vol: Volume.
Under the Style tab, you can easily uncheck the “Basis” and “Lower” boxes to show only the Upper Band.
Trading Examples - High Volume S/R
Let’s take a look at the trading examples below.
Example #1: SPY ETF Support Bounce
The top panel shows the daily price bars of SPY. The lower panel shows the volume of each day.
The orange line is the Bollinger Band benchmark, as described above. Look out for instances where the volume rises above the orange line.
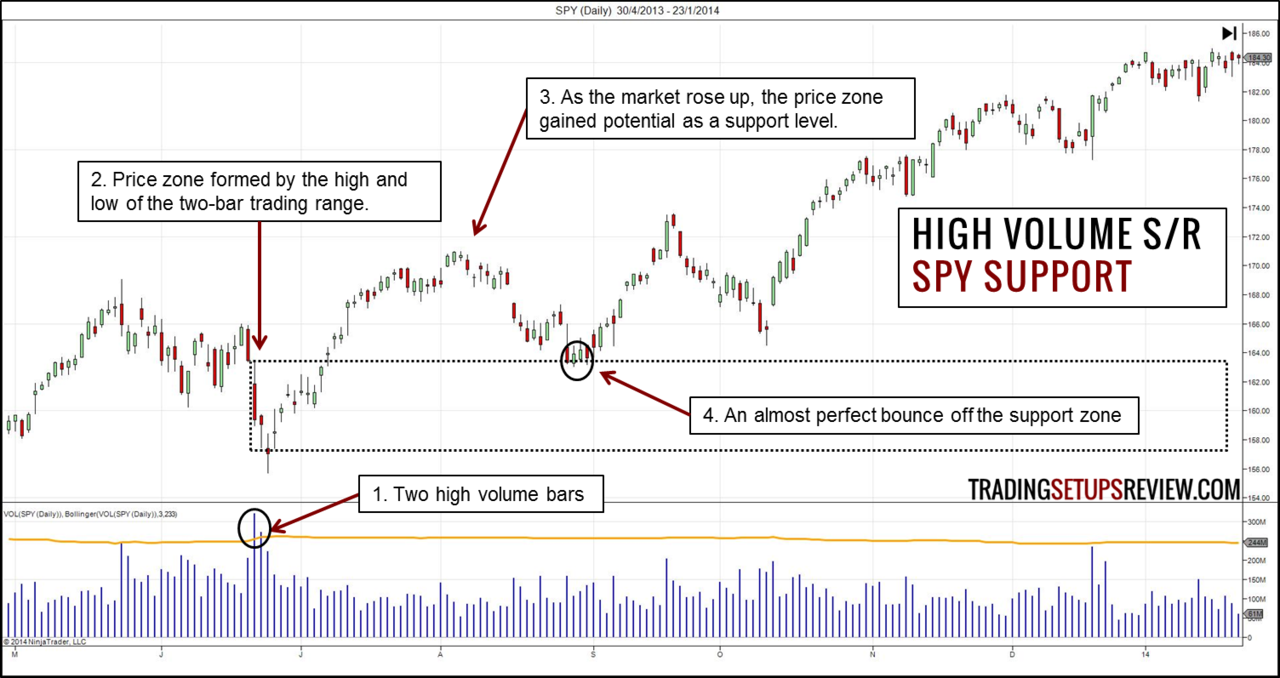
- These two consecutive high volume bars caught our attention.
- Using the highest and lowest traded price of these two days, we drew a price zone.
- As the market rose, the price zone became a potential support zone.
- At the end of the first deep pullback down, the price zone offered concrete support to halt the market descent.
This chart shows a textbook trade example. Buying when the market dipped into the support zone resulted in a great trade with almost no adverse movement.
The next example will show that price action around a support zone is not always as neat.
Example #2: Multiple Tests of Support
This chart shows the daily price bars of Lennar Corporation (LEN on NYSE).
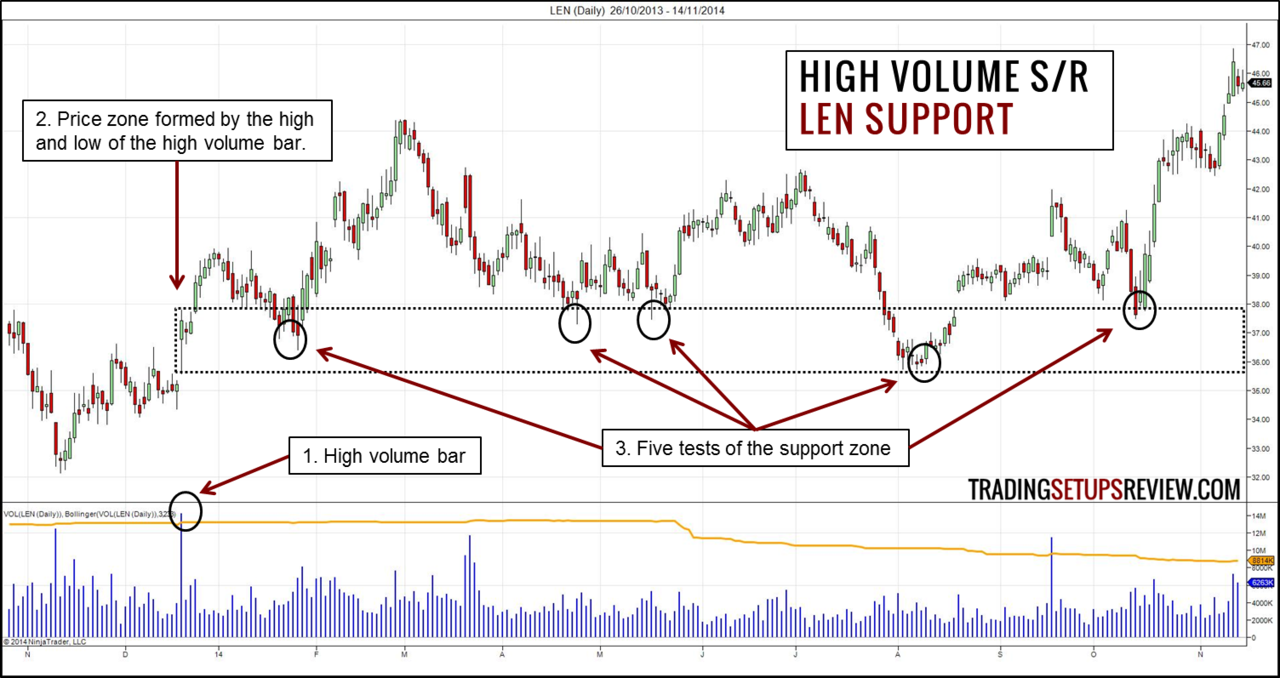
- We spotted this apparent surge in the market interest.
- Using the high and low of the corresponding candlestick, we marked out a potential support/resistance zone.
- After rising above the price zone, the market tested the support zone five times before leaving it alone. The fourth test was the most significant and shook most weak bulls out of their positions. Hence, the fifth test offered an ideal bullish trade.
The tests of the support zone were of varying strengths. Such market movement made it challenging to make use of the support zone for trade entries. Thus, blindly buying a bounce off the support zone was not ideal.
In cases like this one, it helps use more specific trading setups (price patterns) to define our risk and reward.
Example #3: Trading Challenge
Often, you’ll find that the projected support and resistance zones are working. However, it does not mean that it will be a breeze to find viable trades.
This example highlights the challenge of trading profitably even when you have a well-defined support/resistance zone.
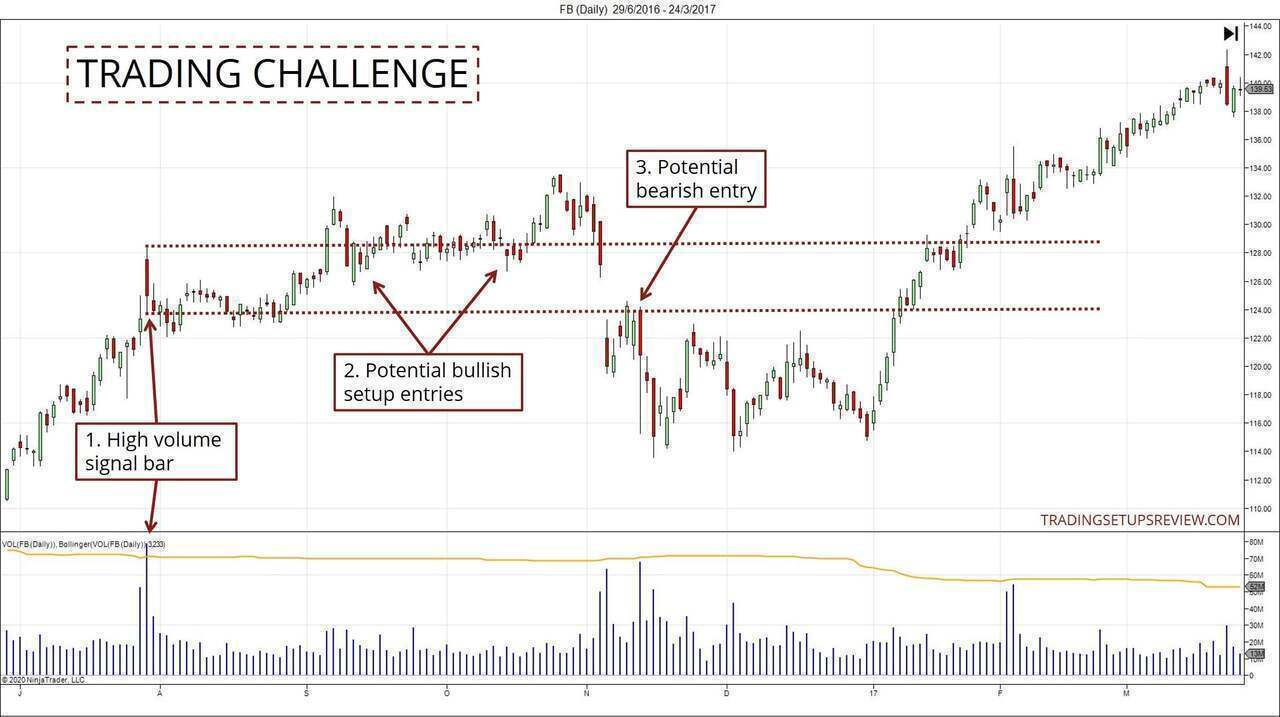
- This volume spike was suitable for projecting a potential S/R zone.
- The zone appeared to hold up the market in these instances.
- After the market gapped down below the price zone, the retest of the area as resistance presented a potential short trade entry.
Here, the bullish bounces did not see the bull trend resuming. Similarly, the bearish entry did not precede a full-fledged bear trend.
Hence, these trades were likely to produce profits only if we had used conservative price targets. The problem was that conservative targets might not have made sense ex-ante, from a reward-to-risk perspective.
Accordingly, there’s no straightforward recipe for securing a winning trade.
Mapping out a support/resistance zone is only one part of the trading puzzle. Getting profits out of the market requires greater consideration.
Example #4: Resisting Complex Pullback
The multiple points of resistance in this example demonstrate the effectiveness of the high volume price zone.
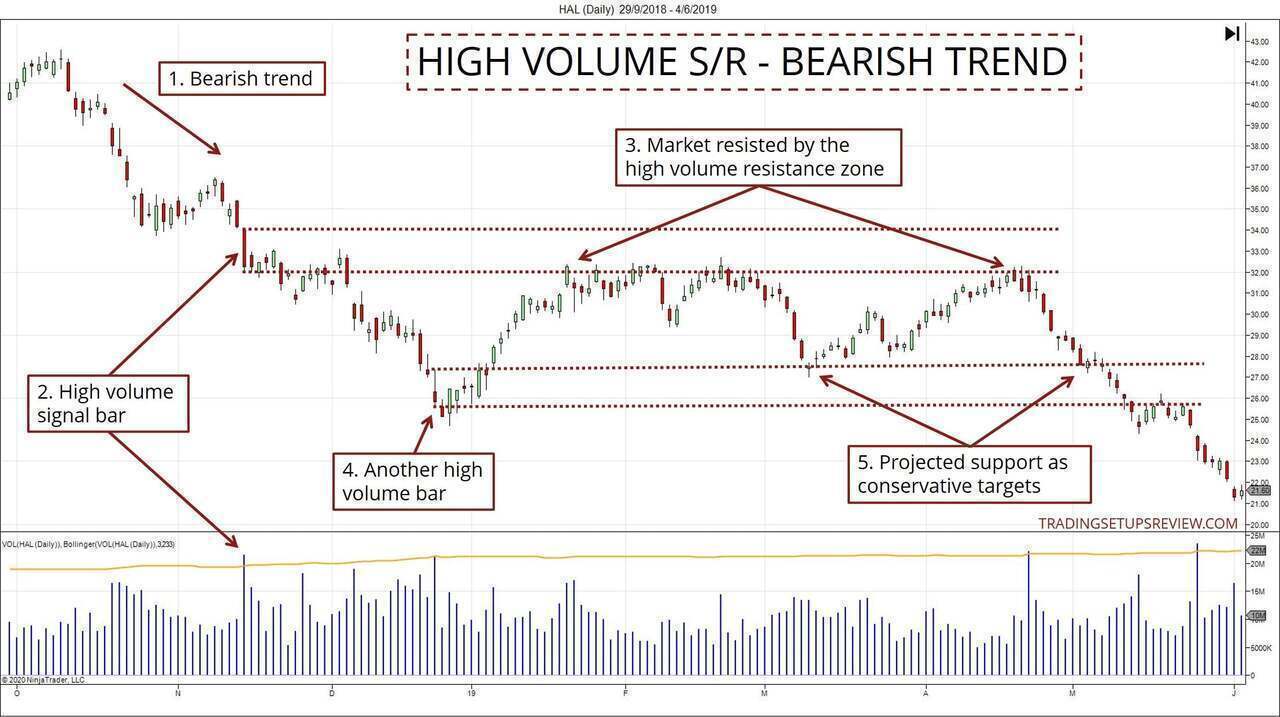
- A bearish trend was established.
- This volume spike defined a key S/R zone.
- Between these two points, there were multiple tests of the resistance zone. Each incursion into the zone was an opportunity for shorting the market.
- This high volume bar provided the basis for a second lower support zone.
- The traders who shorted earlier around the resistance zone could capitalize on the resuming bearish trend to maximize profit. Alternatively, they could also consider the projected support zone for a conservative exit.
Example #5: Concentrated Volume As Support Zone
Although we have been looking at single-bar volume spikes, the concept of high volume S/R zones goes beyond looking at a single bar.
Any price range with a trading volume concentration indicates interest and could act as a support/resistance zone. (A related tool is Volume-By-Price.)
This example shows how the market continued to trade within the marked zone, highlighting the interest level around that price zone.
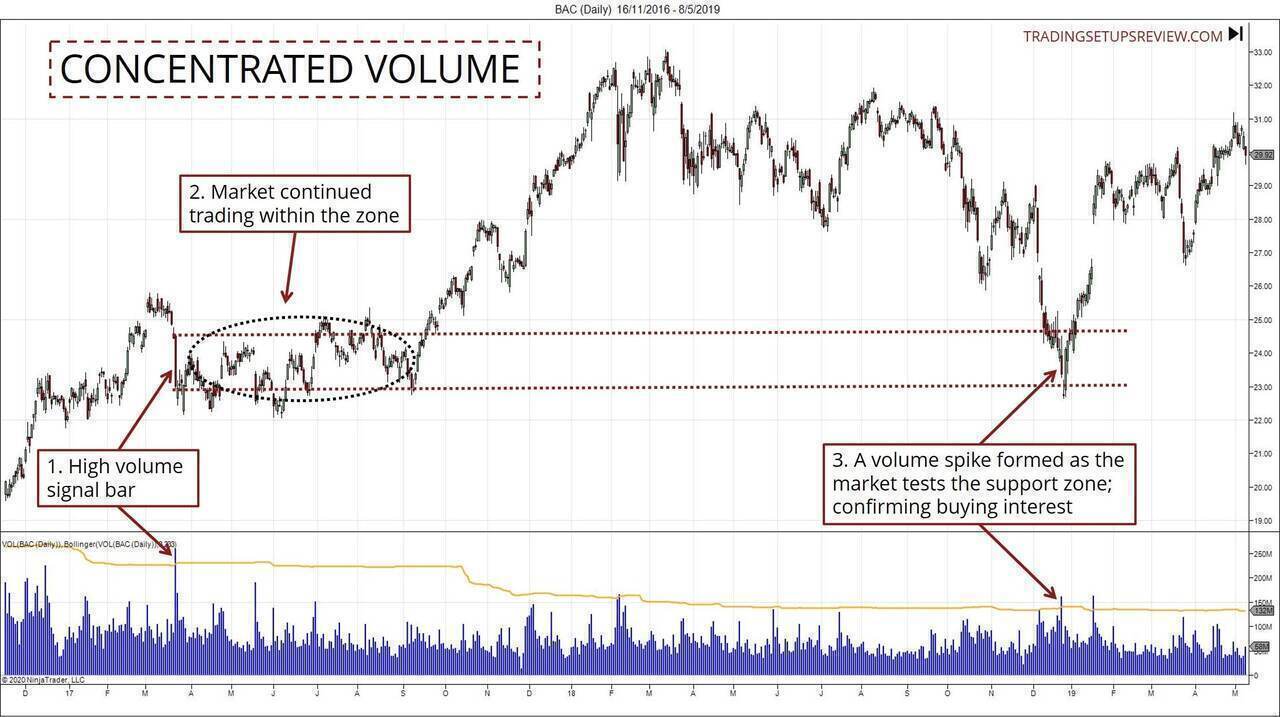
- This volume spike was dramatic and established a potential S/R zone.
- In this case, the surge was followed by a period of market meandering. The price zone became soaked with trading volume, showing a significant price consensus within the price range. Eventually, the market broke out and soared.
- The volume spiked as the market returned to test the projected zone. Given the earlier clustering of transactions within this zone, it was reasonable to interpret this volume increase as a demand surge. Soon after, the market made a sharp bullish recovery.
Trading with High Volume Support and Resistance Zones
High volume price zones are potential support and resistance areas.
Potential is the keyword here. They do not always work. Hence, do not trade them blindly.
While looking out for high volume price zones is excellent for mapping the market structure, it is not a complete trading method. It would help if you considered using other trading setups to time your entry.
Also, when trading with any form of support/resistance, always look out for zones that have failed.
Generally, if the market falls sharply through a support area, it becomes invalid as support. (You can still observe it for flip trades as the support switches into a potential resistance zone.) The same logic applies to a market rising through a resistance area with powerful momentum.
A quick tip for day traders: fine-tune your support and resistance levels with range bars instead of time-based charts. Range bars with volume spikes offer potent intraday S/R levels.
The article was first published on 2 December 2014 and updated on 29 October 2020.