Template for a Simple Day Trading Strategy
By Galen Woods ‐ 8 min read
Create your own simple day trading strategy using this template. With this template, you can personalize the essential components of a day trading strategy.
Many new traders gravitate towards a simple day trading strategy because they want easy solutions to the market puzzle. But as they gain experience, they realize that simple strategies are rarely profitable out-of-the-box. Yet, most traders still look for simple trading strategies. Why?
Why do traders love simple trading strategies?
First, it is easy to get started with a straightforward strategy. Hence, it acts as a helpful launchpad for any day trader, especially if you’re just starting out.
More importantly, the most straightforward day trading strategy is also the most flexible and hence the most powerful in the hands of a seasoned trader.
If you look, it’s easy to find many simple day trading strategies, including the Trend Bar Failure strategy and this simple strategy using Bollinger Bands. These strategies are simple and easy to follow.
However, are they right for you? Do they provide the best foundation for you to build on?
Every trader is different, so we might find it tough to make other traders’ ideas work.
So, why not create your own simple day trading strategy?
In this guide, you’ll pick up a template for creating your own simple day trading strategy.
In particular, this simple day trading strategy template:
- Covers the necessary parts of a robust pullback trading strategy;
- Uses no more than two trading indicators; and
- Allows you to include your favorite tools.
Practical simplicity is the result of sensible limitations.
This is why we limit ourselves to looking for pullback setups and to a maximum of two trading indicators.
Simple Day Trading Template For Trend Pullbacks
This is a basic template for trading intraday trends.
- Find the trend
- Define a retracement
- Establish your entry and exit rules
#1: Find the trend
First, find the trend. Keep it simple and choose only one trend-following tool to help you.
Suggested trend tools:
- Moving average sloping up or price crossing above the moving average
- MACD moving above the zero line
- ADX crossing above 25
- Trend lines (HH, HL, or LH, LL)
- Oscillator indicators with a long look-back period (including stochastics, CCI, RSI)
The chart below shows the 5-minute bars of the ES futures market (S&P E-mini futures on CME).
It demonstrates how to use the simple moving average (SMA) slope to identify the market trend.
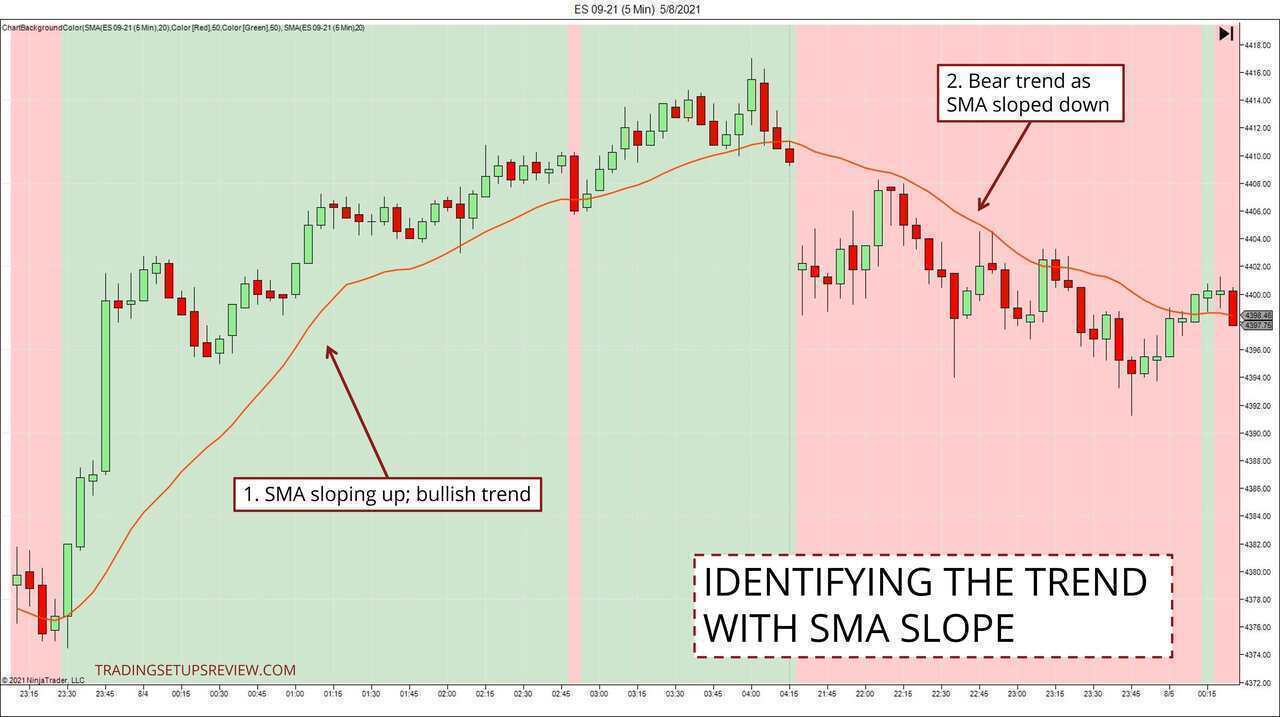
- When the SMA slopes up, it indicates a bull trend. (The green background makes it easier to track the direction visually.)
- The following session gapped down and changed the direction of the SMA.
Having a systematic way to define the trend is essential, but always remember that the market can have no tradeable trends.
Learning to recognize when to step aside is an essential contributor to your trading edge.
#2: Define a retracement
Next, we wait for the trend to slow down and retrace before taking a trade.
Jumping onto a train while it is speeding can get you to your destination. It’s just, well, a little challenging to find ways to do it without getting hurt.
It’s the same for riding trends. We can hop onto the trend while it is blazing away. But we face the obstacle of setting stop-loss orders to protect ourselves.
This difficulty is not a deal-breaker if you are looking to ride a trend for the long run. However, day traders have limited profit potential within the day. Hence, we need precise stop-loss points to support our positive expectancy for our setups.
This is where a retracement is helpful. It helps us pinpoint when the trend is slowing down so that we can hop onto it with controlled risk.
Decide how you identify a retracement within the trend.
For instance, in the Holy Grail trading strategy, a retracement is when prices fall back to the moving average in a bull trend.
Here are a few suggested methods for identifying a pullback:
- Tests of a moving average
- Oscillator indicators (oversold or overbought levels)
- Tests of a trend line
- Test of an earlier swing low (for long trades) or swing high (for short trades)
- Price patterns like the three-bar pullback
For confirming a retracement, very often, price action alone is sufficient. So try to keep it simple.
Let’s zoom into the bull trend we saw in the previous ES intraday chart. It points out the different criteria you can use to filter for pullbacks.
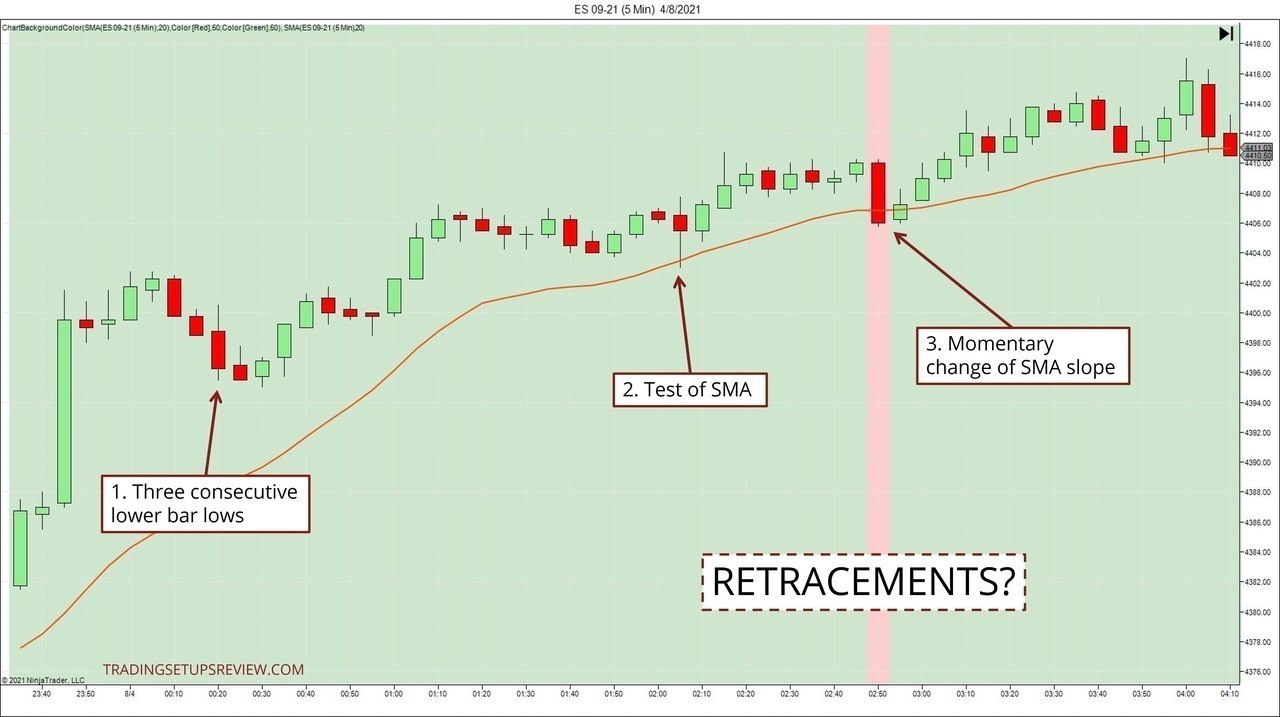
- Three consecutive bar lows mark a pullback.
- This test of the SMA is also a pullback. But in this case, the pullback was shallow and not as desirable for a pullback entry.
- As we are using the SMA slope as our trend basis, a momentary change of the SMA slope could also highlight a pullback.
Although there are many options for this part of the template, remember to keep things simple.
So, choose only one tool to help you with defining the retracement. (Yes, we might miss out on some trades because of how we define pullbacks, but that is a cost we pay for consistency.)
If you can use the same tool you chose in the first step, then congratulations, you are a champion minimalist trader.
#3: Establish entry and exit rules
A day trading strategy is not complete without specific entry and exit rules.
You must know precisely when to enter a position and when to exit so that you can act without hesitation when the opportunity arises—having specific rules also help to define our reward-to-risk ratio for each trade.
To keep things simple, let’s refrain from adding another indicator. Instead, try using the tools you have chosen from the earlier steps to trigger your entry.
Here are a few suggested entry methods (for long setups):
- Bar patterns and candlestick patterns
- Any bull trend bar
- Oscillator turning direction
- A bar close above the moving average
Once you’ve done the heavy lifting by confirming the trend and identifying the pullback, the exact entry is often easier than you expect.
Look at the chart below. It shows the simplest entry for each of the pullbacks we identified earlier.
What is the simplest entry method?
- Place a buy stop order above the first bullish bar that forms after the pullback.
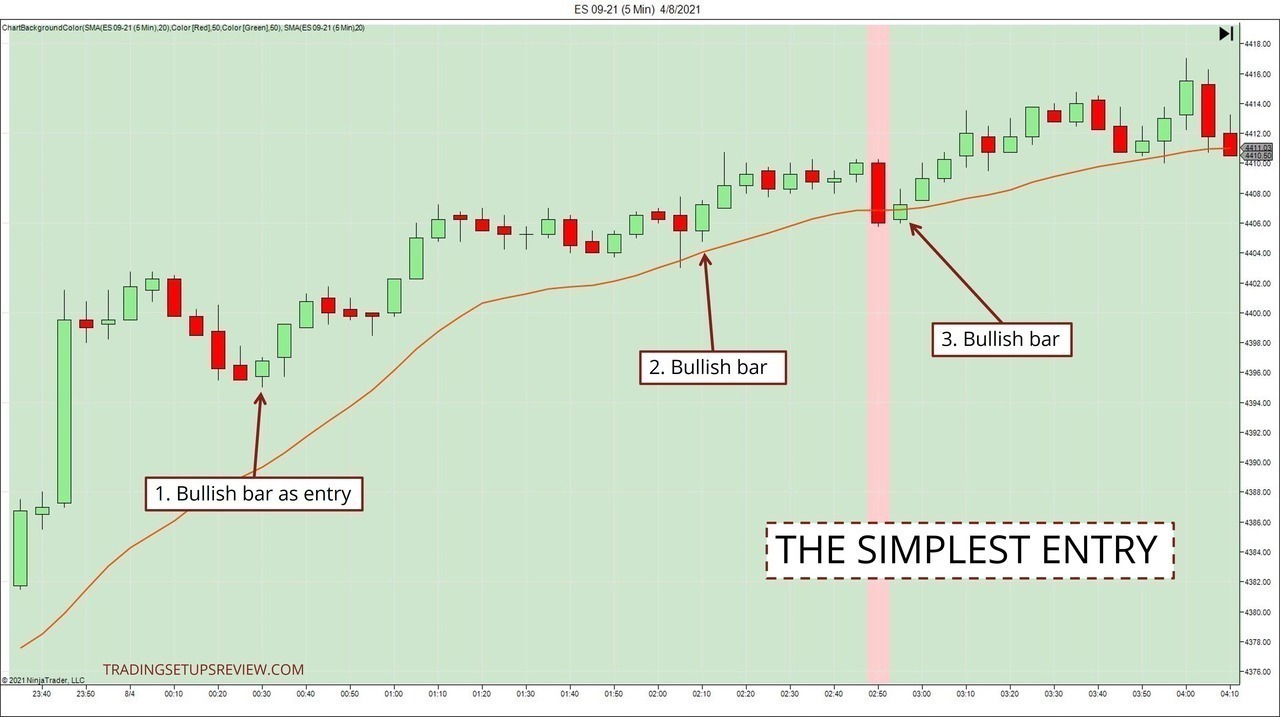
- This is the first bullish bar after the bearish pullback. Place a buy stop order above its high, and the following bar would trigger it.
- Again, the first bullish bar after the pullback, as indicated by the test of the SMA.
- Dead simple. A bullish bar for our entry again.
The primary value of the entry method is the stop-loss it implies. Thus, when we use a bullish bar to enter, its bar low serves as a solid initial stop-loss level.
Beyond the stop-loss, we also need to prepare for taking profits.
Here are a few methods you can consider for profit-taking:
- Bar patterns and candlestick patterns
- The previous extreme of the trend (This is the most conservative option within the context of a trend pullback trade.)
- Oscillator changing direction
- Measured move
For more profit-taking methods, check out this guide.
A Simple Day Trading Strategy Example
Now, let’s put the three parts of the template together in an integrated example - one that works without any trading indicators.
This is a 3-minute chart of CL futures (Crude Oil on NYMEX).
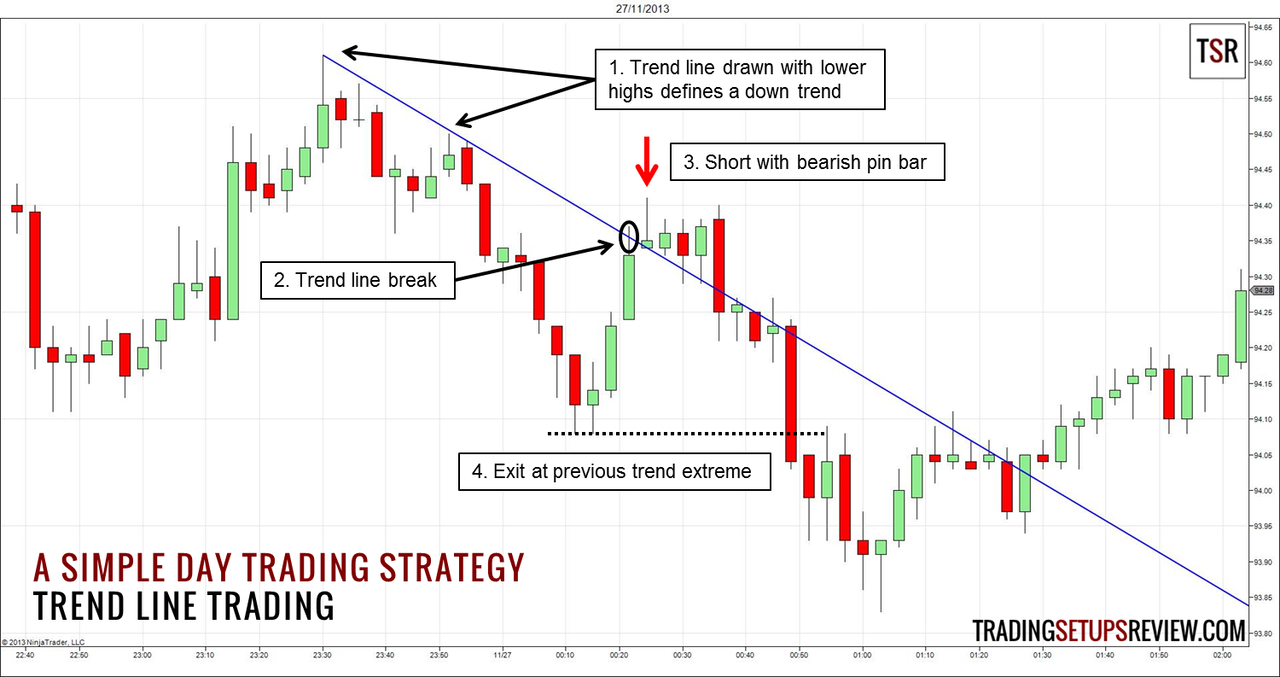
- First, we used a trend line to connect swing pivots to define a bear trend.
- Then, we waited for a test of the trend line before looking for a continuation trade entry. This test confirmed a pullback that we were interested in.
- Paying attention to the price action, we observed a bearish Pin Bar which triggered our entry.
- Finally, as this pullback was relatively deep, the previous extreme low of the trend offered a solid reward-to-risk ratio.
Here, we used only one trading tool: the trend line—no trading indicators.
A simple price pattern for entry and a previous support level for the exit.
That’s it. Trade simply.
A Different Mindset To Building Trading Strategies
Once you understand the power of using a template like the one we went through, you’ll also appreciate a broader lesson that will change how you build your trading strategies.
Common questions running through a trader’s mind as we construct a trading strategy:
- What indicators should I use?
- When should I enter the market?
- How do I know when to sell?
Instead of starting with these questions, begin by examining what you want to achieve.
Move away from a starting point like this:
- I want to use moving averages and trade crossovers. Which lookback period works best? What timeframe should I trade?
Towards one like this:
- I want to identify the trend and find a low-risk entry with a sensible exit that offers positive expectancy. How can I do that?
Instead of focusing on the tools and strategies, start with understanding your goals. What do you want to achieve? Once that is done, you will find it a lot easier to choose the right tools for the job.
This change in mindset is what our template process encourages here.
Finally, don’t use the template by randomly plugging in the parts and start trading.
The key here is to work the template into a consistent trading plan.
For instance, how you determine the market trend is related to how you find pullbacks and entries. Some tools have a natural synergy with one another. Some methods work better for you because of your experience.
The goal is to integrate these factors using the template to create a strategy that is simple and effective for you.
The article was first published on 31 December 2013 and updated on 12 August 2021.