4 Price Action Methods to Define the Intraday Trend: Part I
By Galen Woods ‐ 4 min read
Figuring out the intraday trend is the most profitable task of a day trader. Learn four ways of tracking the intraday path of least resistance.
For all traders, the trend is the big picture. It is the rising tide that lifts all. For day traders, the intraday trend makes the difference between a session of windfall profits and one of major losses. By trading along with the intraday trend, we are following the path of least resistance to day trading profits.
As the trend is the big picture, it seems removed from current price action. Hence, many traders are tempted to leave price action out of the trend equation. They rely on a distant moving average to define the market trend and do not factor in price action. These traders are missing an important confirmation tool.
Using indicators to identify the intraday trend is reasonable. However, if we link them up with price action, we are able to enhance their prowess. Hence, in the first part of this two-part series, we will focus on using indicators with price action to track the intraday trend. In the second part, we will discuss two other methods to find the intraday trend.
1. Moving Average with Price Action
This method uses a 20-period simple moving average (SMA) with price action to clarify the intraday trend. Essentially, we are looking for a shallow pullback followed by a new high (low) to confirm a bull (bear) trend.
To confirm a bullish intraday trend, look out for the following conditions. The rationale for each condition is in brackets.
- Price touches the moving average. (Establishes baseline. Useful for sessions that open with a gap.)
- Price stays above the moving average for at least one bar. (Bullishness)
- Price retraces down towards the moving average without making any bar high below the moving average. (Lack of bearish commitment)
- Bull trend confirmed when price rises above the last extreme high. (Confirmation of bullish market structure)
To confirm a bearish intraday trend, look out for the following.
- Price touches the moving average.
- Price stays below the moving average for at least one bar. (Bearishness)
- Price retraces up towards the moving average without making any bar low above the moving average. (Lack of bullish strength)
- Bear trend confirmed when price falls below the last extreme low. (Confirmation of bearish market structure)
Let’s take a look at an example from the NQ futures market.
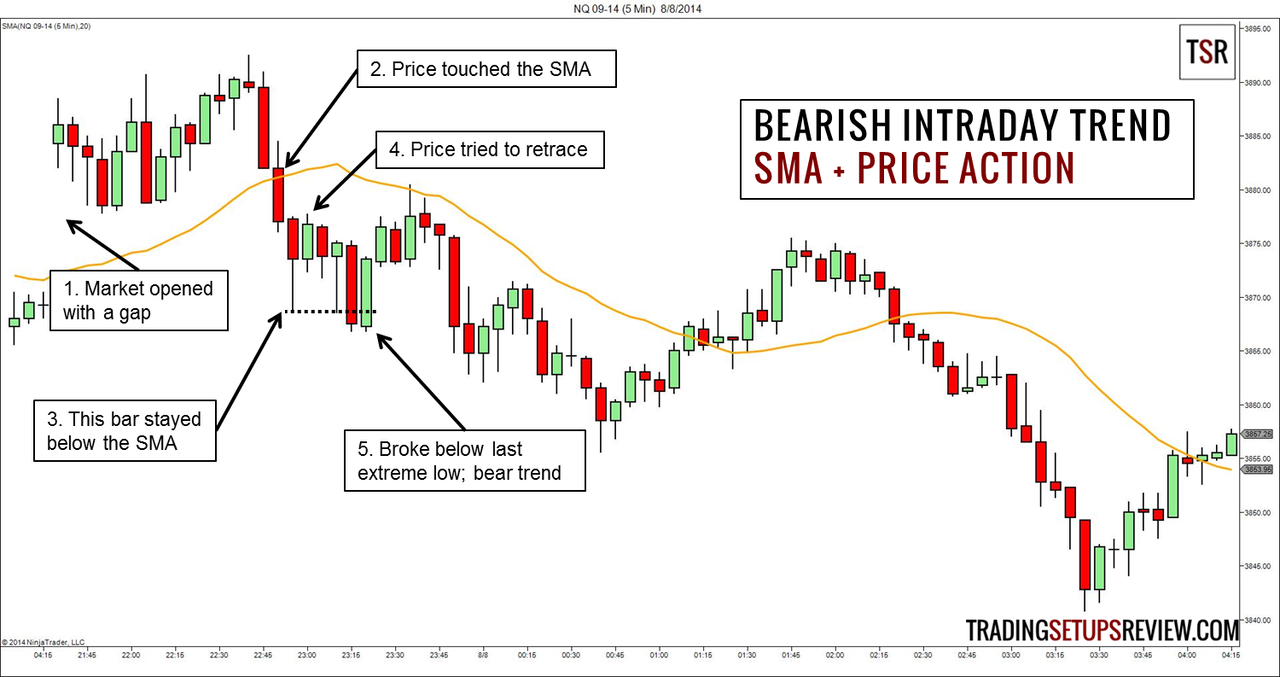
This session opened with a bullish gap.
- Instead of guessing if the gap would start a new bull trend or close the gap, we waited for price to return to our benchmark SMA.
- Price touched the SMA.
- This bar stayed below the SMA, confirming the bearish momentum,
- This bar made a higher bar high but could not even rise to test the SMA.
- As the market fell past the last extreme low below the SMA, we confirmed a bear trend.
This intraday bear trend held up for the rest of the session, despite a 50% pullback in the middle of it.
Trading with just a 20-period moving average is an excellent starting point for any trader.
2. Price Channel with Price Action
In this second technique, instead of using a simple moving average of bar closes, we use two moving averages of bar highs and lows. The resulting lines form a price channel to help us clarify the intraday trend.
Jake Bernstein employed this concept in his Moving Average Channel Day Trade.
Since the indicator in this case is more complex, the interpretation rules are simpler. When two price bars stay completely above the channel, we define a bull trend. When two price bars stay completely below the channel, it’s a bear trend.
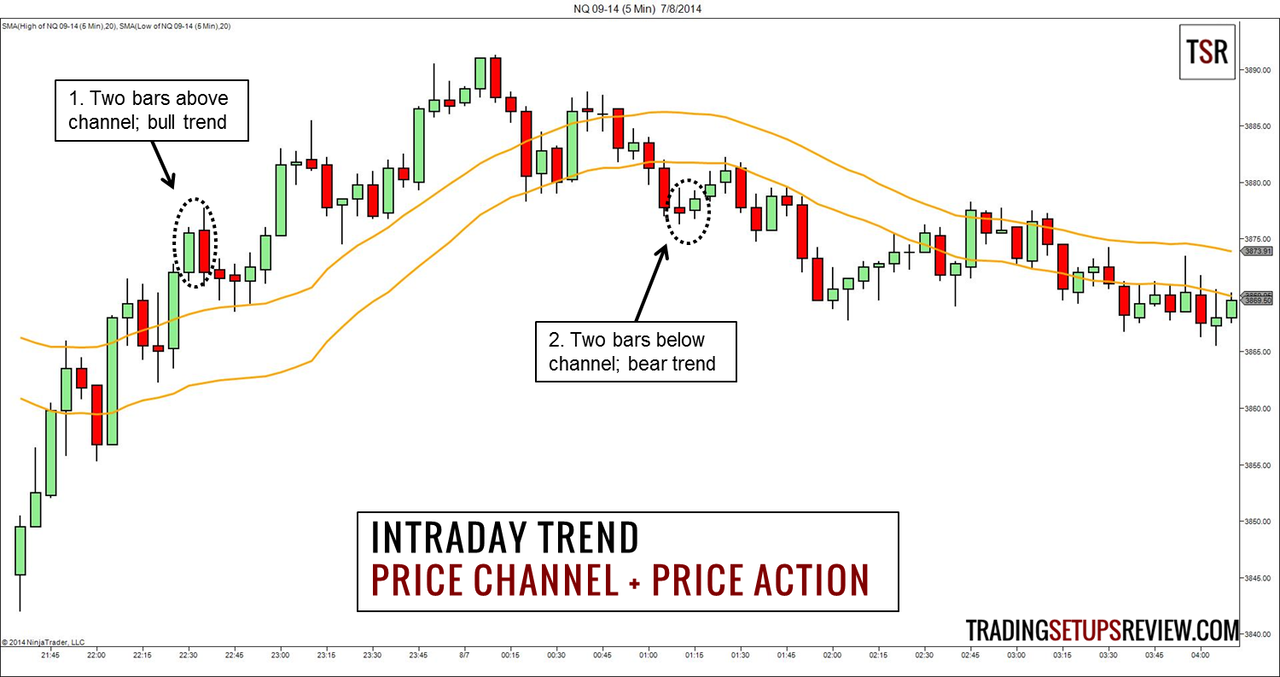
The example above shows how the price channel helped to define a change of intraday trend.
- Although the market has risen sharply since this session opened, according to this method, we could only define a bull trend at this point.
- These two bars changed the intraday trend to bearish.
There are different ways to build a price channel. Other than using moving averages of bar highs and lows, you can also use Keltner Bands and Bollinger Bands. As these price channels are constructed differently, you will need to adapt the rules for defining the intraday trend.
Finding the Intraday Trend - A Comparison
Both the SMA method and price channel described above use indicators to clarify price action, but in different ways.
By comparing them, we are able to understand both methods better. The SMA method focuses on finding lack of momentum on pullback to identify new trends. The price channel method finds powerful moves that lift the market beyond the price envelope to start new trends.
How do these two methods compare with the next two pure price action methods?
Read the next part of this article in which we will discuss two price action methods to determine trends. (No indicators!)