Support And Resistance: A Complete Price Action Trading Guide
By Galen Woods ‐ 13 min read
Support and resistance underlies the most important price action trading concepts. You can become a proficient trader if you master support and resistance.
The concept of support and resistance is a cornerstone of price action trading. A huge part of price action trading pertains to analyzing support and resistance levels of different degrees. The aim is to integrate them to form your market opinion and execute your trades.
In this guide, you’ll learn everything you want to know about support and resistance - from theory and technical rules, to messy considerations.
Defining Support and Resistance
First, what is support and resistance (S/R)?
In a nutshell, they are price levels (or areas) where traders expect that a change in market direction is more likely than random.
This definition is vital to the role S/R plays in creating a trading edge.
If our view of the market is entirely and permanently random, then there is no way to profit from the market. However, once we perceive a tendency for the market to act one way or another, trading opportunities present themselves.
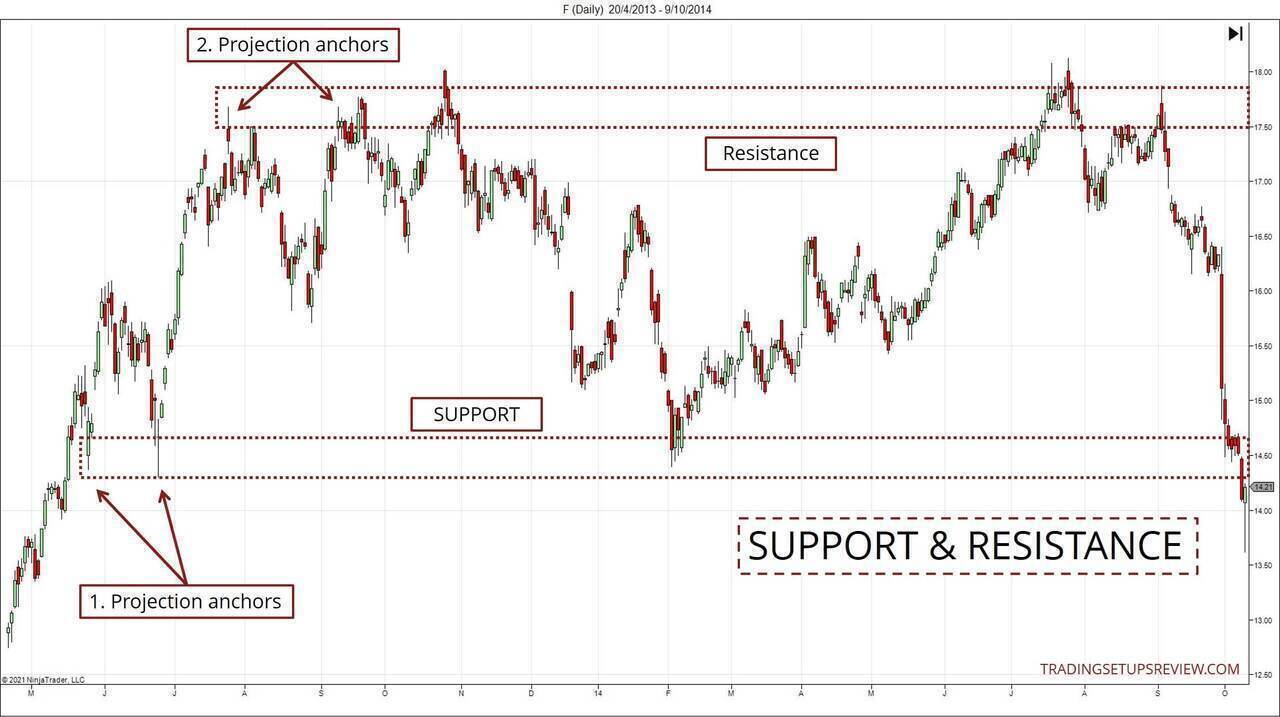
A support level is an obstacle to falling prices.
It acts as a price floor as long as it remains effective. When the market gravitates towards a support level, we expect that the market has a more than random chance of being halted at that level.
A resistance level is a barrier to rising prices.
It acts as a price ceiling while it is effective. When the market rises towards a resistance level, we expect that the market will have a more than random chance of stopping its ascent.
Before we move on, let’s get one point out of the way.
It is crucial to recognize that support and resistance levels are zones. Precision is a luxury in the probabilistic market. Using price ranges (zones) instead of exact price levels reflect this understanding.
(Typically, I draw the support and resistance zones around the shadows of the candlesticks to project a zone.)
Support and Resistance Guide Overview
The rest of this guide discusses support and resistance in four parts:
- How to mark
- How to judge (and analyze)
- How to trade
- How to avoid pitfalls
First, we will discuss how to mark support and resistance on price charts. In this section, you’ll get acquainted with the various ways of drawing S/R.
However, to keep our discussion focused, we will go into detail only for the most basic method: projecting swing pivots.
Second, we will learn how to judge the significance of support and resistance zones. This skill is vital for forming practical trading methods and knowing when to remove the S/Rs from your chart.
Third, we will look at the possible trading approaches using support and resistance as our analytical basis. This section will show you how a detailed S/R structure informs our trading entries and exits.
Finally, we address some of the pitfalls that we might encounter in using support and resistance extensively.
Section #1: How to mark a support or resistance level?
There are dozens of approaches to marking support and resistance zones. Here, we will list them to showcase the fascinating variety.
We can group the methods under the following labels:
- Market Structure Projection
- Projected With Computation
- Price Action Formations
- Volume Formations
- Computed Levels
- Psychological Levels
This section will discuss market structure projection in greater detail and provide a brief overview of the other S/R types.
(Each method deserves a separate guide if discussed in detail. And I hope to create individual guides for them eventually. For now, I’ll list them and link them to relevant resources found on or off our website.)
Type #1: Market Structure Projection
Look at any price chart, and you will see peaks and troughs. Trades call these turning points swing pivots.
The chart below highlights the market swings with the help of a color-coded Hull Moving Average.
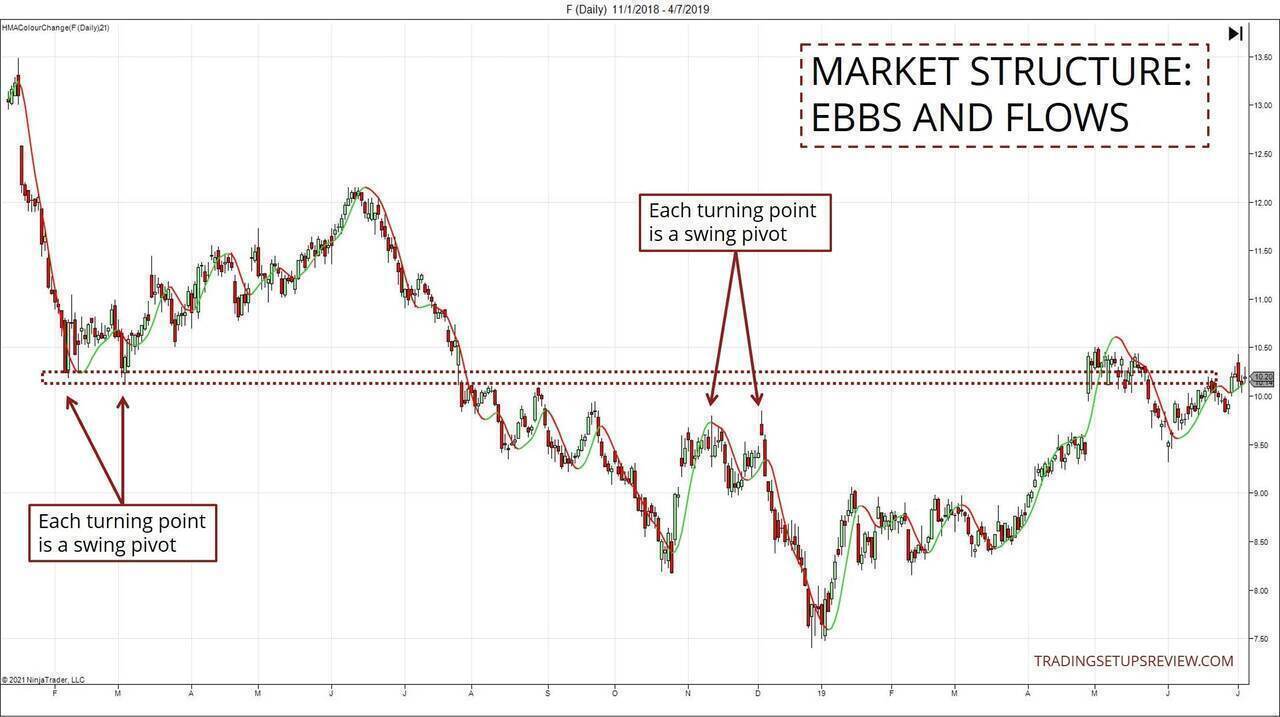
Peaks are swing highs. Troughs are swing lows.
Together, the peaks and troughs form the fundamental market structure.
We can mark support and resistance by connecting and projecting from these swing pivots.
Hence, these S/R levels are extensions of the market structure.
If you are new to price action trading, you should spend your time on market structure type S/Rs. Doing so will help build a solid foundation for understanding price action.
There are three main ways to project support and resistance from the market structure:
- Projecting a horizontal line from one or more swing pivot (Horizontal S/R)
- Connecting two swing highs and casting the resulting line (Trendline or Channel Trendline)
- Connecting two swing lows and casting the resultant line (Trendline or Channel Trendline)
(These lines also form the basis for the entire set of chart patterns like the Bull Flag and the Head & Shoulders.)
As you can see, all the methods involve picking a swing pivot (or turning point) as an anchor and projecting a line to the right of the chart.
The chart below shows examples of the different types of support and resistance you can project from the market structure.
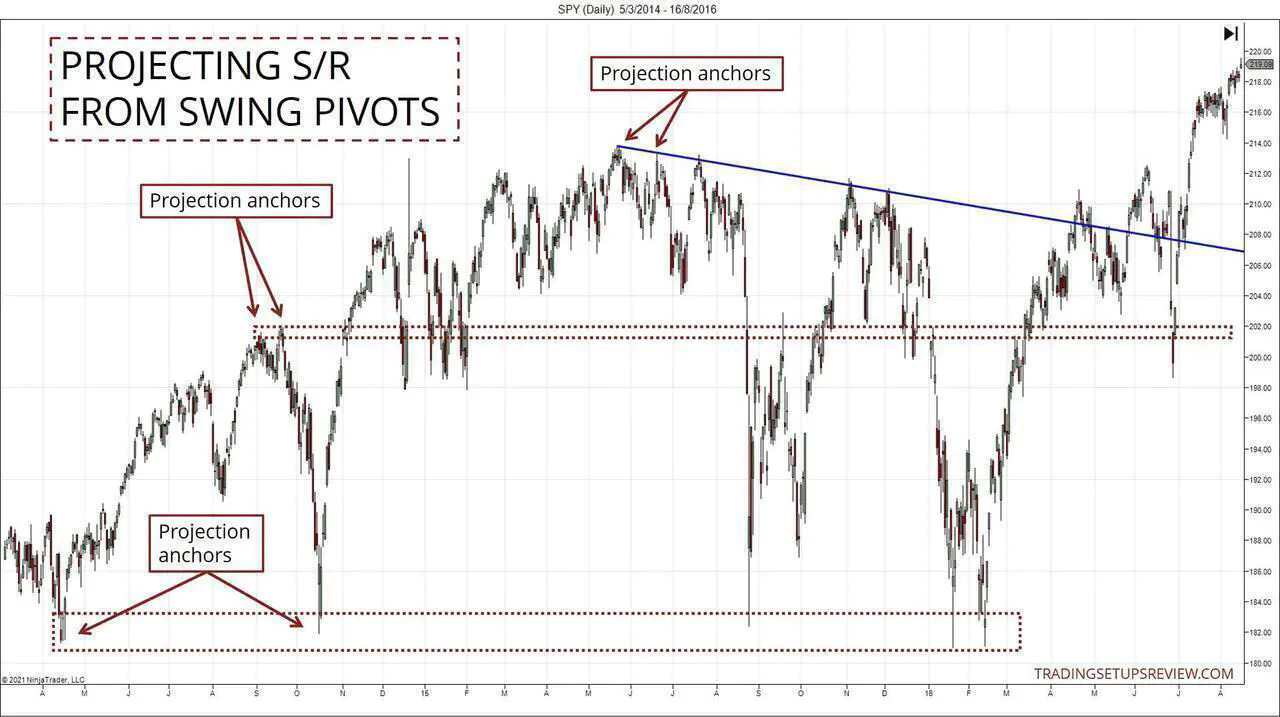
The horizontal levels projected from the swing pivots are the most basic form of S/R.
Hence, they will form the mainstay of our discussions below. They serve well to illustrate the fundamental principles that apply broadly to all types of support and resistance.
Type #2: Projected With Computation
Like the market structure methods covered above, these S/R levels require choosing a price anchor.
But on top of that, they entail some simple computation.
- Fibonacci Retracements and Extensions (The Golden Ratio)
- Andrews’ Pitchfork (A simple 50% ratio)
- Speedlines (Simple fractions)

Type #3: Price Action Formation
Price action formations offer a reliable and no-fuss method to mark S/R zones.
After learning how to project S/R from the market structure, focusing on price action formations is the natural progression.

Type #4: Volume Formations
Volume represents market interest, and this interest manifests as significant S/R levels.
Extreme or concentrated volume are reliable signals.
- Climactic Volume - candlestick chart, range bar chart
- Market Profile
- Price by Volume
- VWAP

Type #5: Computed Levels
You can also use indicators that overlay price action as S/R zones.
There are endless options here, and we are listing a subset.
- Moving averages
- Volatility bands - Bollinger and Keltner
- Calculated pivots - Floor Traders, Camarilla, Woodies
")
Type #6: Psychological Support and Resistance
As market psychology underpins technical analysis, these simple methods can be very effective depending on the market traded.

More theory for those who are interested. Feel free to skip this section if you want to focus on practical usage.
The many types of support and resistance listed above might seem overwhelming at first. But you can organize them in your mind with these three spectra.
Reactive - Predictive
We identify reactive zones by observing where price has traded or where volume has concentrated, or both. The key here is that the S/R zones are marked based on where the market has traded. We are reacting to past market information.
Examples include swing pivots (highs and lows), areas of congestion, price gaps.
For predictive zones, the market has not traded there, at least not recently. Hence, you can say that we predict that the level will serve as an S/R zone.
Examples include Fibonacci Extensions, trend lines, moving averages.
Static - Dynamic
Some forms of support and resistance remain the same once marked and are not updated. These are static zones. An example is a horizontal zone projected from a swing pivot.
There are also pure dynamic zones that are updated constantly with each incoming price tick. Most computed S/R zones (e.g., moving average) fit the bill.
Some S/Rs lie somewhere in between and require periodic (or price-triggered) updating. A trend line updates with new swing pivots. Floor trader pivots used for day trading are revised every trading session.
It’s helpful to know if your S/R zones are dynamic so that you can ensure that they are updated promptly, either manually or automatically.
Projected - Computed
Projected support and resistance rely entirely on price features and geometry. Hence, you can think of them as being closer to the underlying price action.
On the other hand, computed S/R like moving averages are indicators. A price action trader will apply these tools more prudently.
Section #2: How to judge the significance of a support or resistance level?
Analyzing the likelihood of a support or resistance area holding up is the crux to forming a trading strategy.
Try answering the following questions, and you will get a sense of how to perform such analysis.
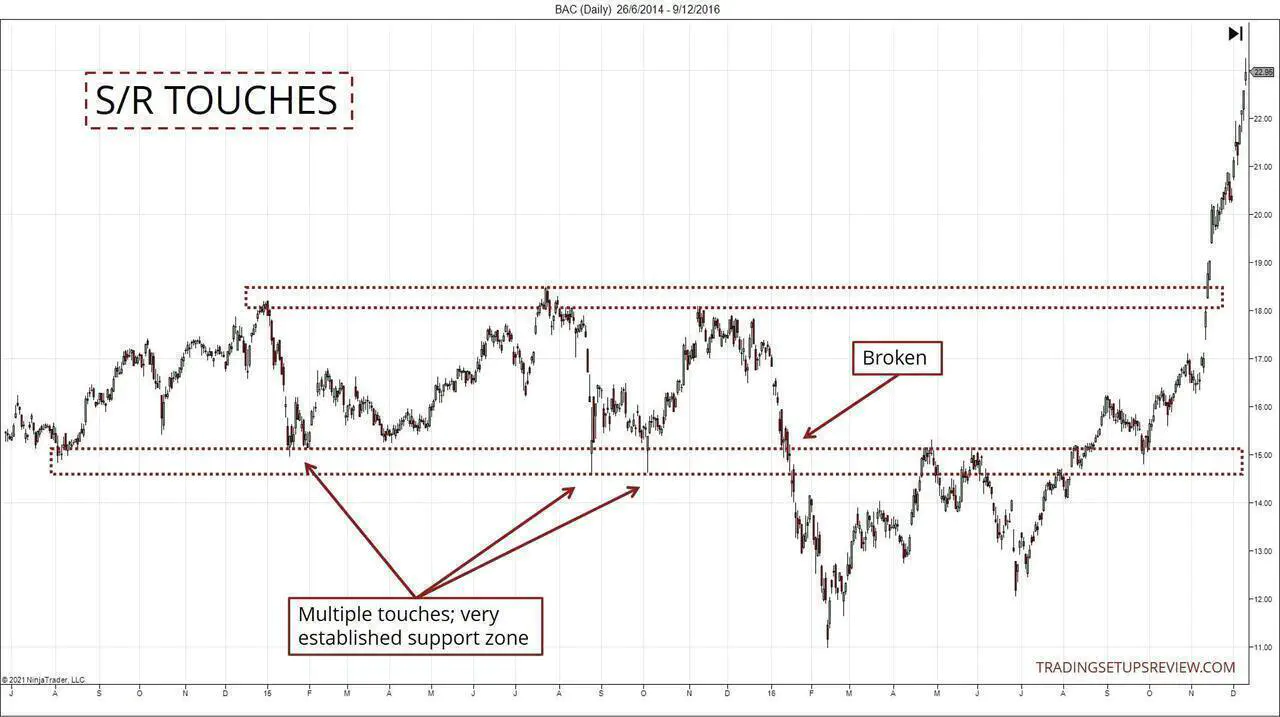
How many times has the market touched the S/R?
There is a crucial trade-off here.
The more times the market tests the S/R, the more established the S/R becomes. If a zone is well-tested, we are more confident that the zone is indeed an S/R.
However, each time the market tests the S/R, it removes some of its potency.
For instance, each time the market touches a support level and bounces up, it removes some eager buyers from that level. Eventually, with more tests, there are no more eager buyers at that level, and that is when the support fails.
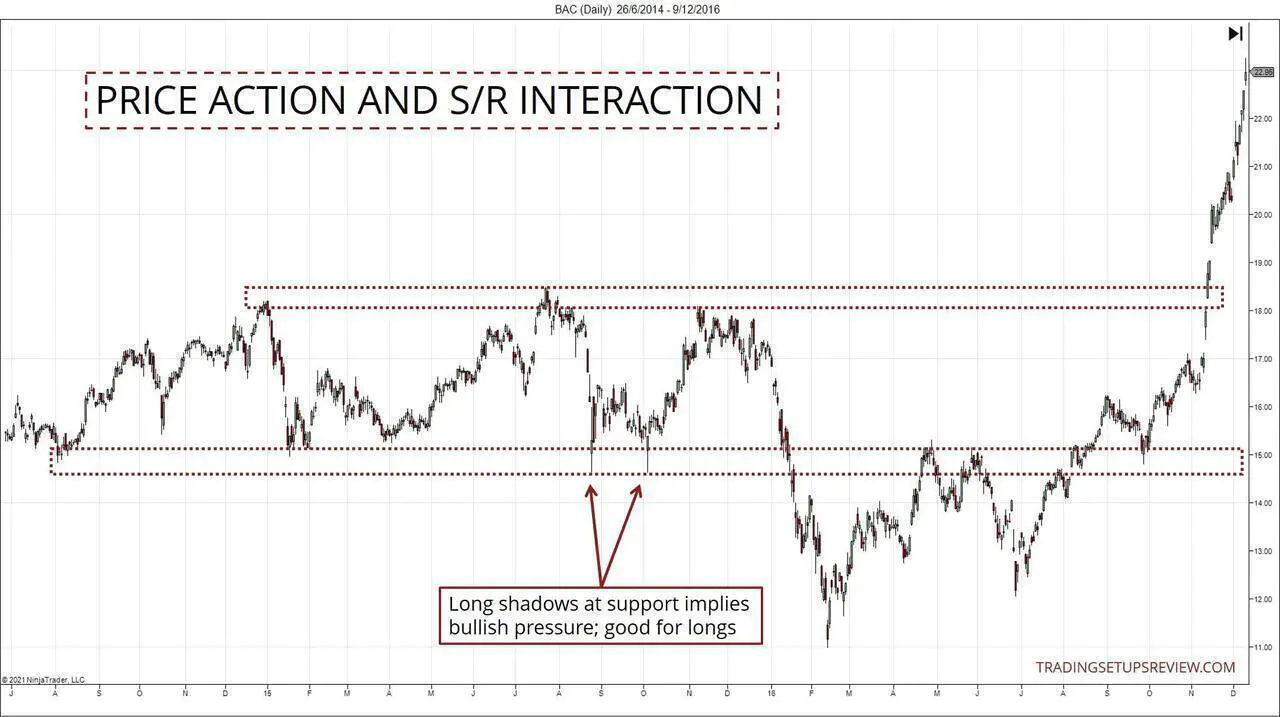
When the market does touch the S/R, how does the price action look like?
Each time the market touches the S/R, examine the price action closely for clues.
For instance, a healthy support zone will produce a vigorous bullish reaction to a test. Hence, if candlesticks with long lower shadows (like a Pin Bar reflecting buying pressure) form at a support zone, it’s a positive signal.
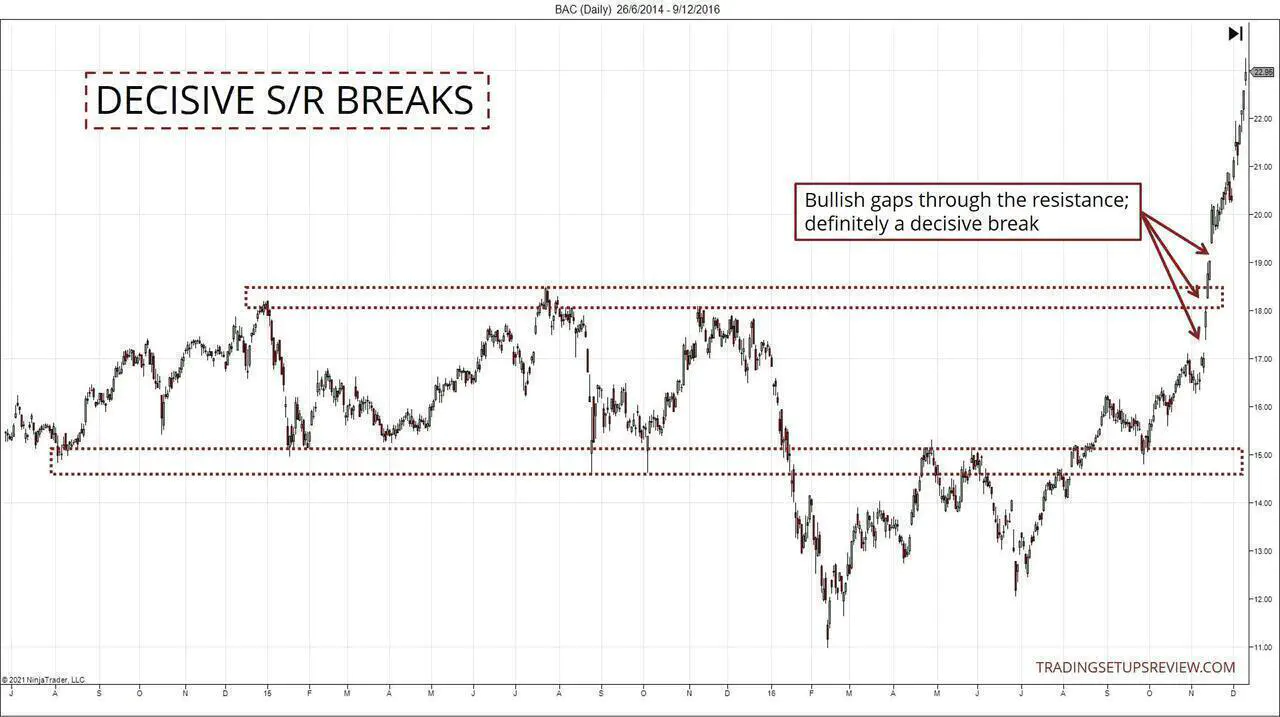
Are there any decisive breaks of the S/R?
A decisive break refers to any price action formation that gives you the impression that the S/R is no longer effective.
Different traders identify decisive breaks differently. Here are some ideas:
- A break beyond a certain ATR multiple (or other volatility measures)
- A bar close beyond the S/R
- A bar high below a support level or a bar low above a resistance level (my preference)
- A swing low above a support level or a swing high below a resistance level
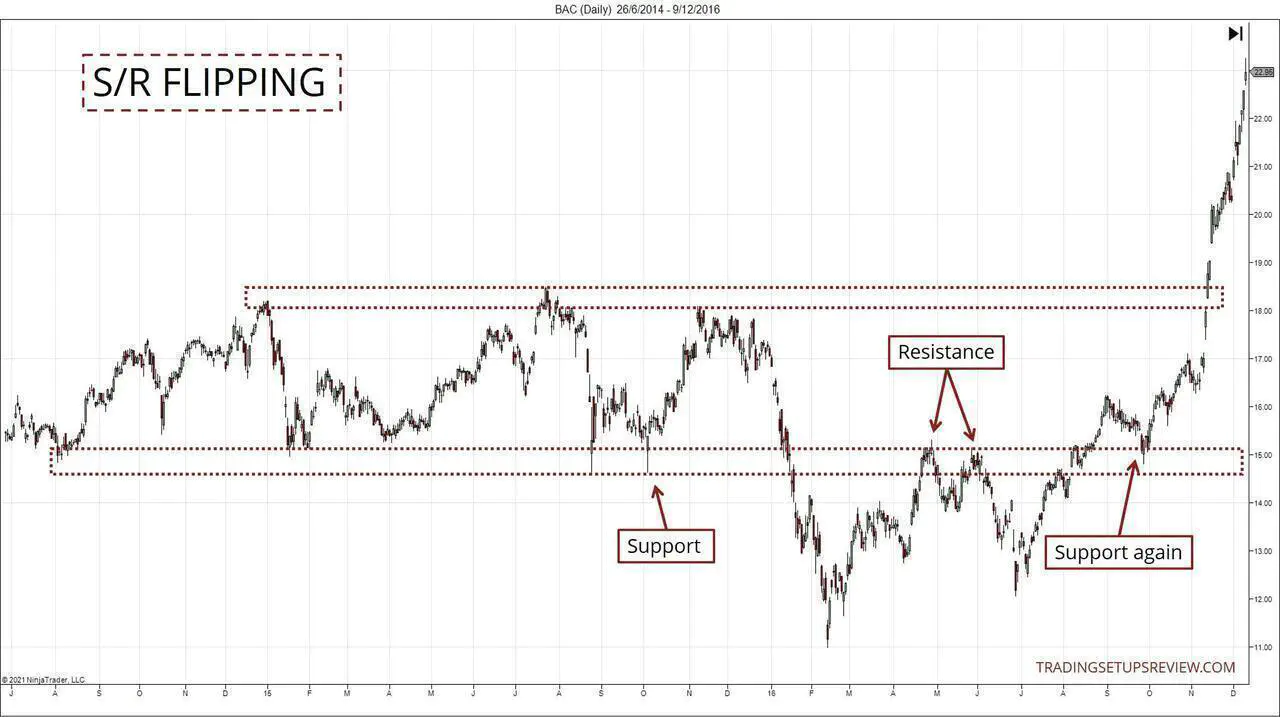
If there are decisive breaks, consider if the zone has flipped?
S/R flipping is a well-known concept.
A failed support becomes a proper resistance; a failed resistance becomes reliable support.
What timeframe did the S/R originate from?
Generally, the long-term support and resistance zones identified from larger timeframes are more significant. This is helpful if you employ multiple timeframes in your trading.
This observation forms the basis of some multiple-timeframe trading strategies.
However, the relevance of the S/R timeframe to your trading horizon is critical as well. And that is the following question to answer.
What is the relevance of the S/R compared to your trading horizon?
Consider that, from the weekly chart, you identified a clear support zone, and you marked it with confidence. However, that zone is hardly relevant to an intraday trader analyzing the 3-minute chart.
The above is an extreme example to make our point.
In practice, you need to understand your trading strategy well and accumulate enough experience to judge which S/Rs are helpful to keep. Typically, consider the S/R’s proximity in time and price to the current market.
This is an essential question because it helps you to keep your charts uncluttered. Once you determine that an S/R is no longer relevant, remove it from your chart.
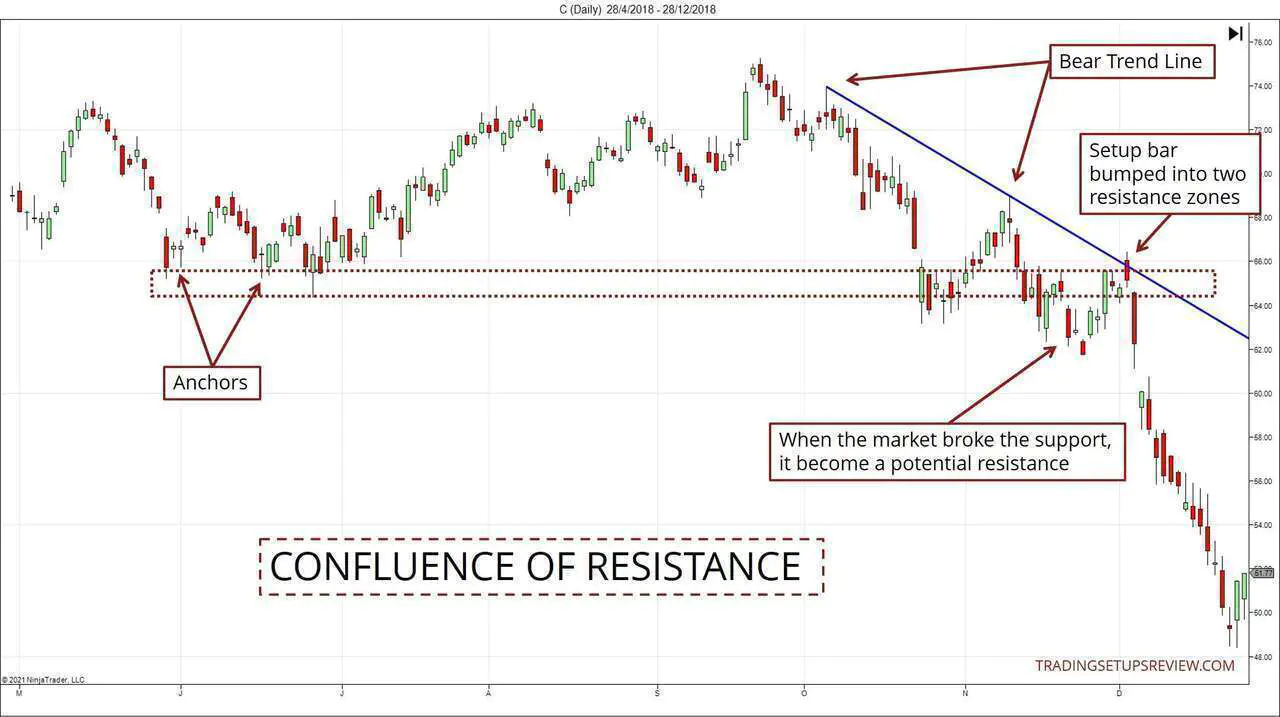
Is there confluence?
Here, confluence refers to different methods producing S/R areas that overlap. If you find convergence, the zone is more likely to be reliable.
For instance, the intersection of a bear trend line and a horizontal resistance enjoys confluence. This is because both of them are potential resistance. The chart below shows this scenario.
Confluence can also be a result of S/Rs found within different timeframes. For instance, a weekly support zone coinciding with a daily support zone.
To recap, this is the list of questions to ask in your analysis of support and resistance:
- How many times has the market touched the S/R?
- When the market does touch the S/R, how does the price action look like?
- Are there any decisive breaks of the S/R?
- If there are decisive breaks, consider if the zone has flipped?
- What timeframe did the S/R originate from?
- What is the relevance of the S/R compared to your trading horizon?
- Is there confluence?
Section #3: How to trade an S/R?
For a technical trader to enter a trade, we need to answer three questions:
- How do you enter?
- How do you exit if you are wrong?
- How do you exit if you are correct?
Analyzing support and resistance can help to answer these questions. Their interplay is the premise of many trading strategies.
The process involves analyzing which S/Rs will hold up and which will break. We have covered the factors to consider in the last section.
For Entries
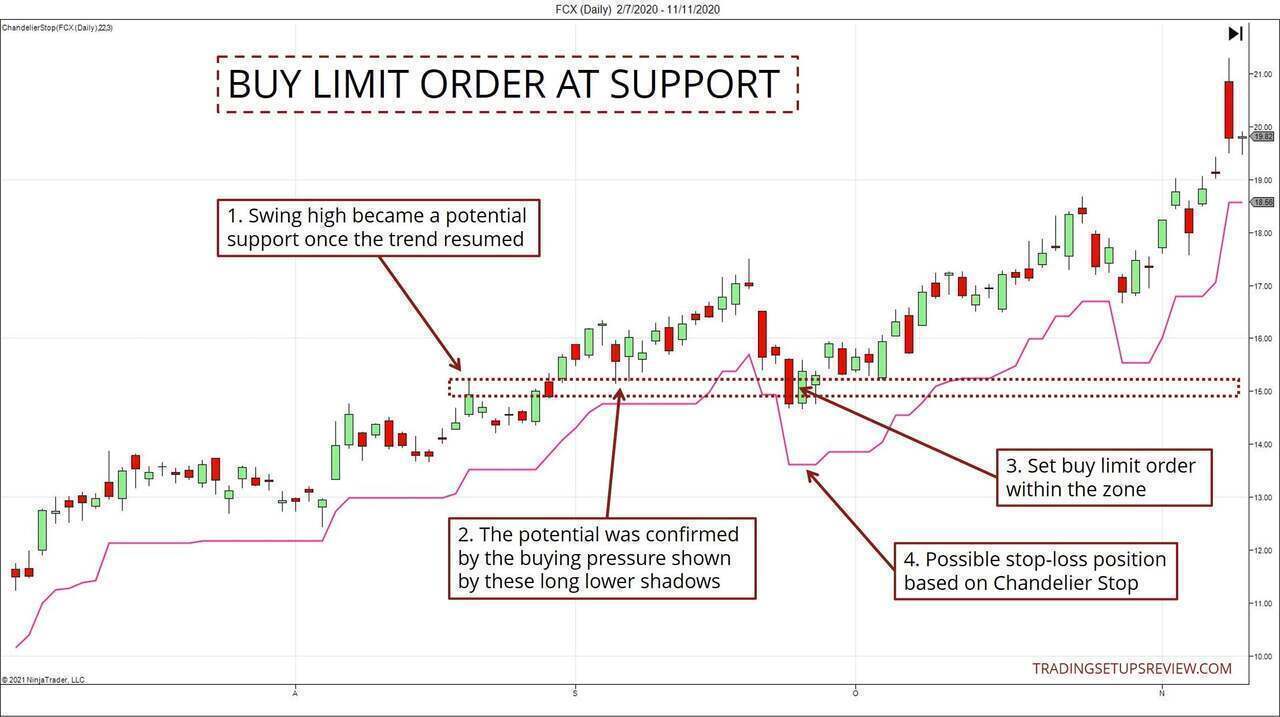
If you are confident of the support or resistance holding up, you can secure an optimal entry price with a limit order.
In this case, limit your risk with a volatility stop like the Chandelier Stops shown below.
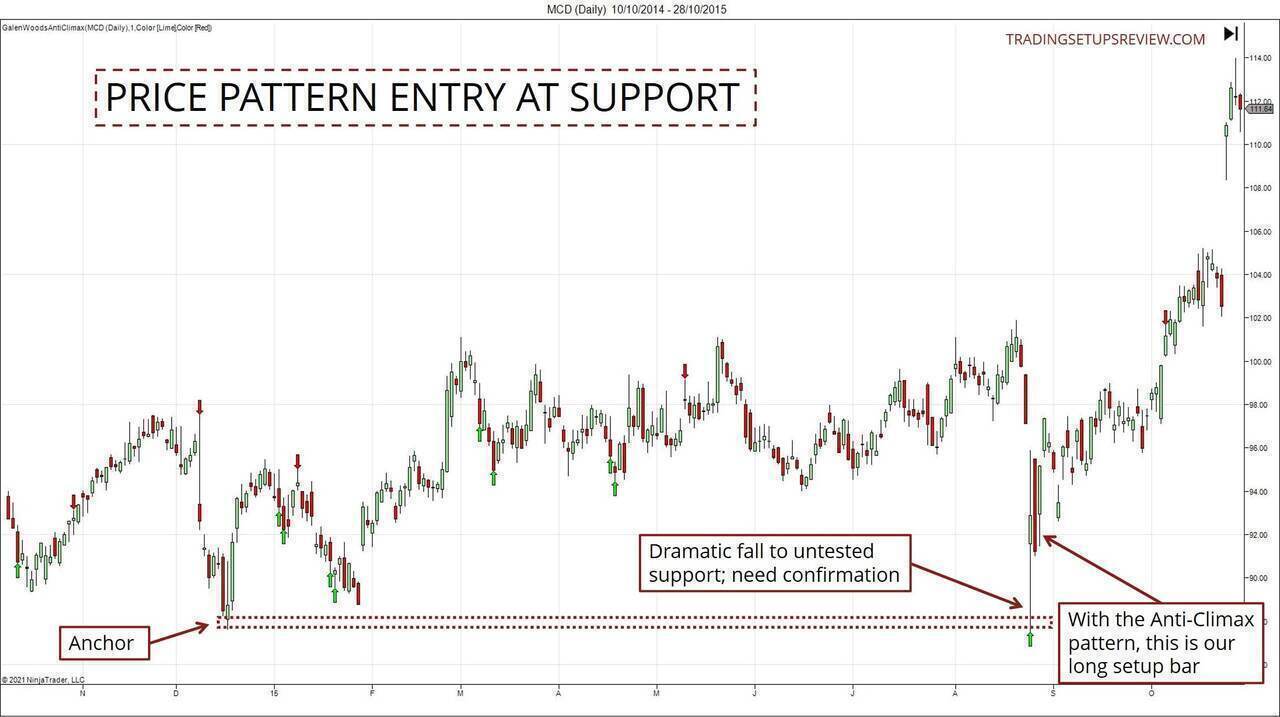
If you need confirmation, look for price patterns at the S/R. In addition, the price patterns also offer pattern stops for controlling your risk.
The chart below shows such a scenario using the Anti-Climax pattern (marked with color arrows) at a support zone.
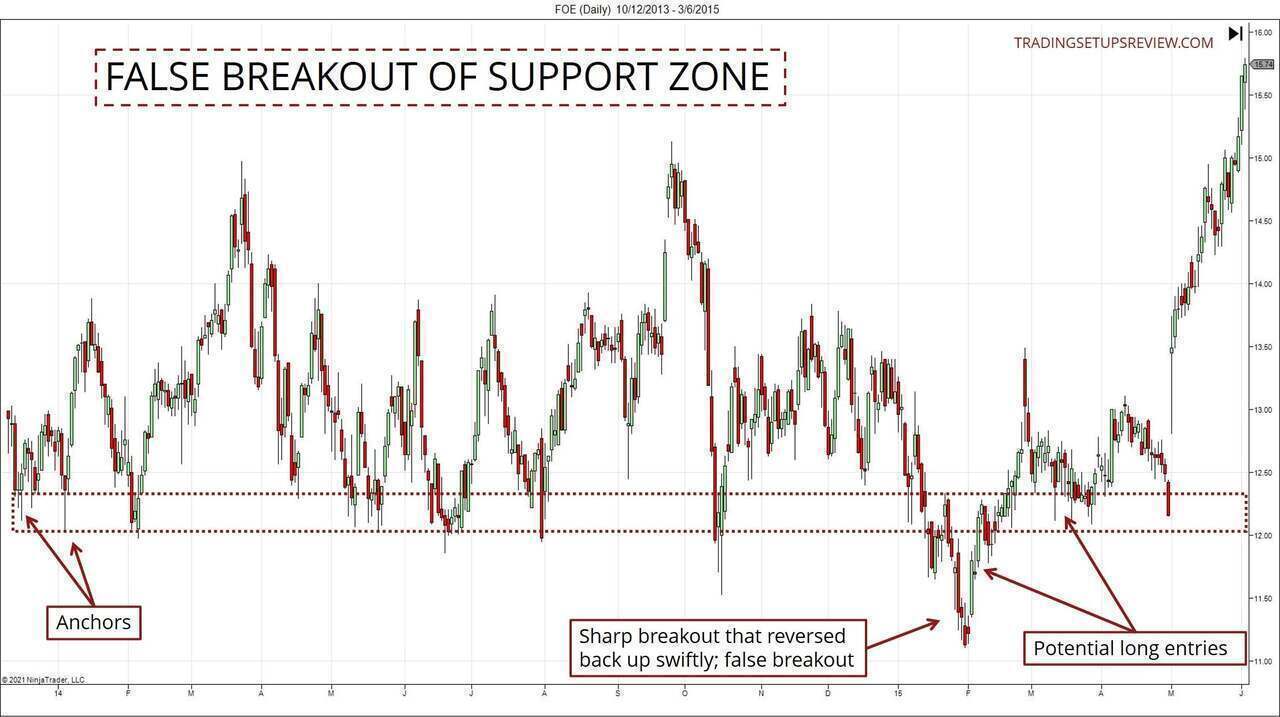
If you anticipate an S/R to hold, consider fading false breakouts. This approach can help you finetune your entry and improve your reward-to-risk ratio. (To learn more, look into Wyckoff Upthrusts and Springs.)
The chart below shows a false breakout of a well-established support zone.
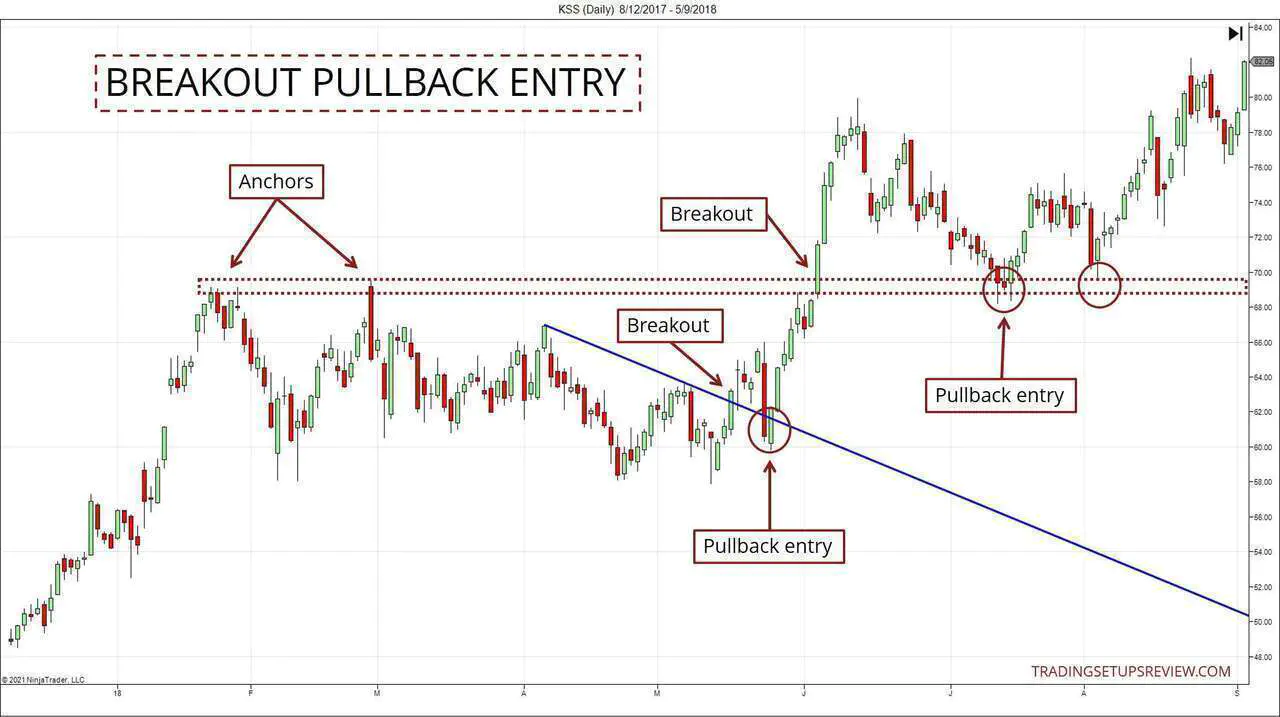
If you anticipate the S/R to fail, consider breakout pullbacks. While you can also trade breakouts directly, waiting for a retracement is more prudent.
The chart below shows two breakout pullbacks: one out of a bear trend line and another above the resistance zone.
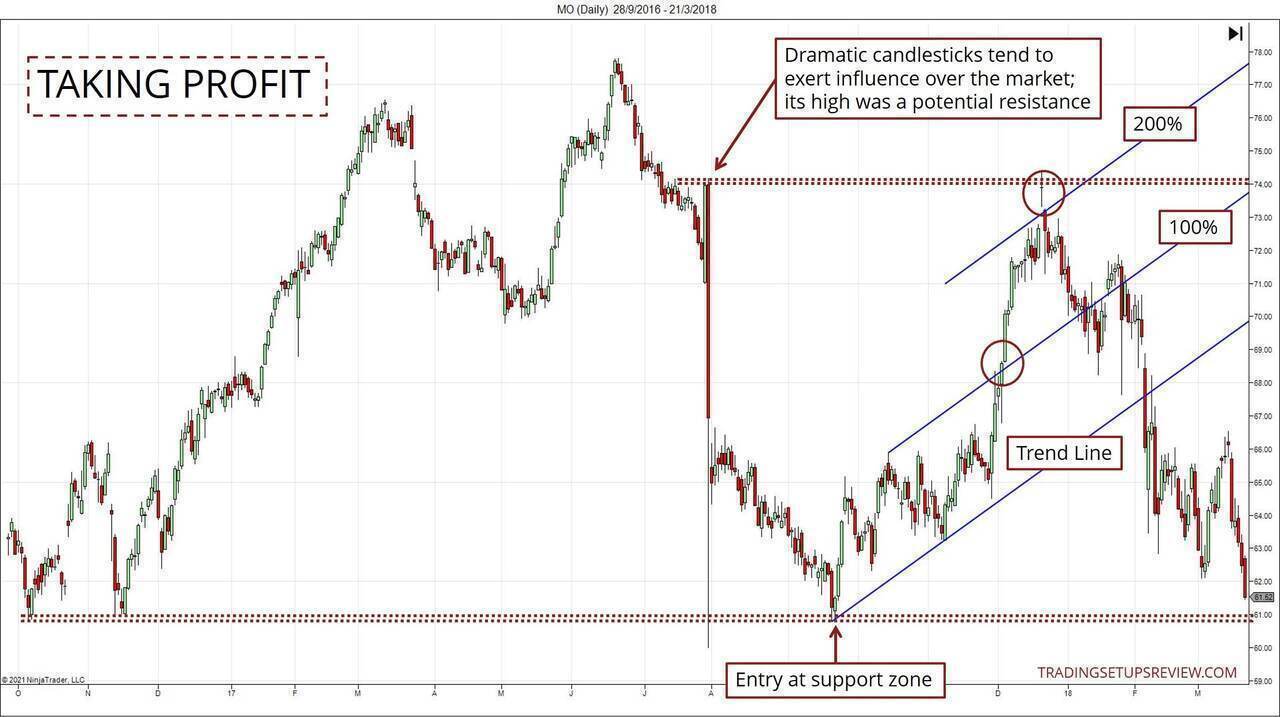
For Taking Profits
You can use any reliable support and resistance to take profit.
As the market might be moving into new territory, you might not have reactive zones marked out. Hence, predictive S/R techniques like Measured Moves, Fibonacci Extensions, Trend Line Channels might be more helpful.
The chart below shows one of my favorite methods for taking profits, with a price channel extending to a 200% line. You can take profit at the 100% or 200% line, depending on your market assessment.
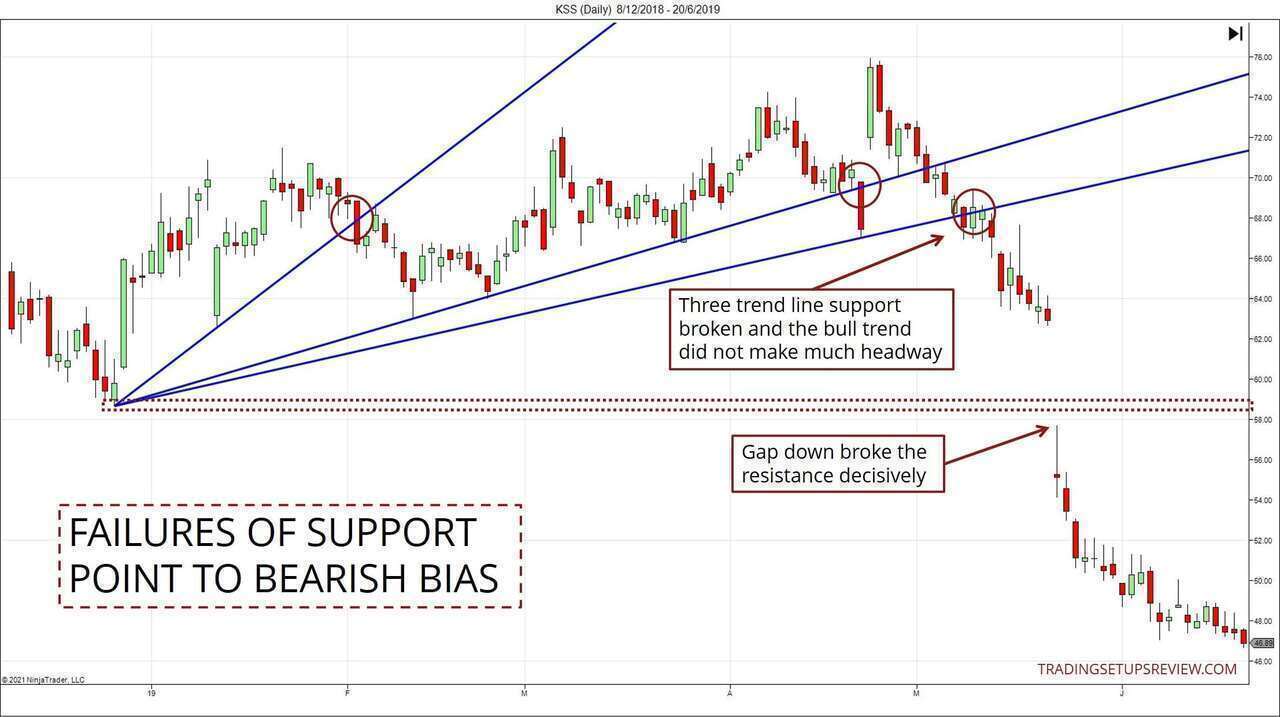
Bonus Tactic
Support and resistance are not only valuable when they hold up. You can also take advantage of their repeated failures to augment your trend analysis.
- Repeated failures of support levels imply a bear trend.
- Repeated failures of resistance levels imply a bull trend.
Section #4: How to avoid potential pitfalls?
I cannot overstate the importance of having a consistent framework for marking support and resistance. Without such a framework, it’s easy to fall victim to hindsight bias.
Adam Grimes did a simple experiment with random S/R levels to demonstrate how desperately our brains want to see patterns, even when they are none.
Building a consistent framework for S/R involves locking onto an objective method to define swing pivots. I use pure price action to do so in my course, but you can also use moving averages to help with that.
Also, keep things simple.
Resist the tendency to draw too many support and resistance levels. Too many zones lead to confusion. Try your best to identify the appropriate zones and remove the rest.
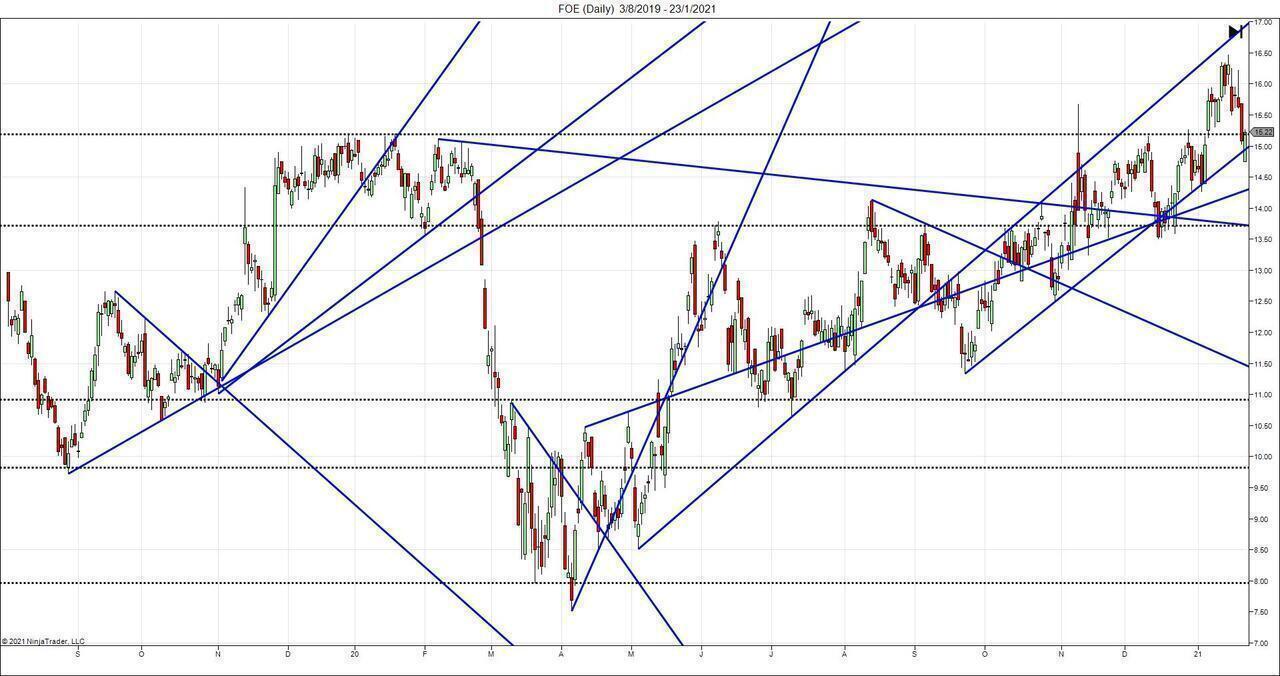
Don’t end up with this clutter.
Finally, trading software is becoming more powerful, and there are many ways to mark support and resistance automatically. This approach is excellent for ensuring consistency, but don’t rely on a black box algorithm to do that for you.
Make sure that you understand how the S/R levels are marked. This is critical for using the tool properly and maintaining the independence of your trading plan.
Conclusion - Support and Resistance
This is a long guide with a lot to digest. So I’ll wrap up with a few points on how to proceed to master support and resistance in your trading.
This is the way I wished I had started when I first learned about support and resistance, instead of hopping around the diverse, confusing options out there.
- Start with market structure projections for marking support and resistance
- Keep things simple - not too many lines
- Keep things consistent - be systematic
- Practice with your charts; take your time
- Note down your observations regarding support and resistance
- Integrate them into your trading strategy