3 Ways To Identify A Trend With A Moving Average
By Galen Woods ‐ 6 min read
Learn how to identify market trends with a moving average. Pick up three robust methods to help you find and trade market trends of different maturity.
Experienced traders can pick up a trend with their honed trading instincts. But for new traders, having an objective method to find and confirm trends is critical. A robust framework offers new traders the ability to learn first and improvise later. For this, the moving average is one the best tools you can use.
Aspiring system traders can use these methods to kick-start for their strategy code. As you progress, you can refine them your market understanding.
Even for experienced traders, an objective method to determine the trend is helpful. Seasoned discretionary traders can judge their subjective evaluation against a fixed framework. This is the only way to check your trading instinct. If your intuition is no better than a rigid trading system, then there’s no reason to use your discretion.
If you want to learn more about trading with moving averages, take a quick look at our moving average guide.
Conventional Method - Moving Average Price Crossover
The bare basic method of using a moving average to determine the trend is the price crossover.
- When price cuts from below the moving average to above it, it implies a bullish trend.
- When price crosses from above the moving average to below it, it suggests a bearish trend.
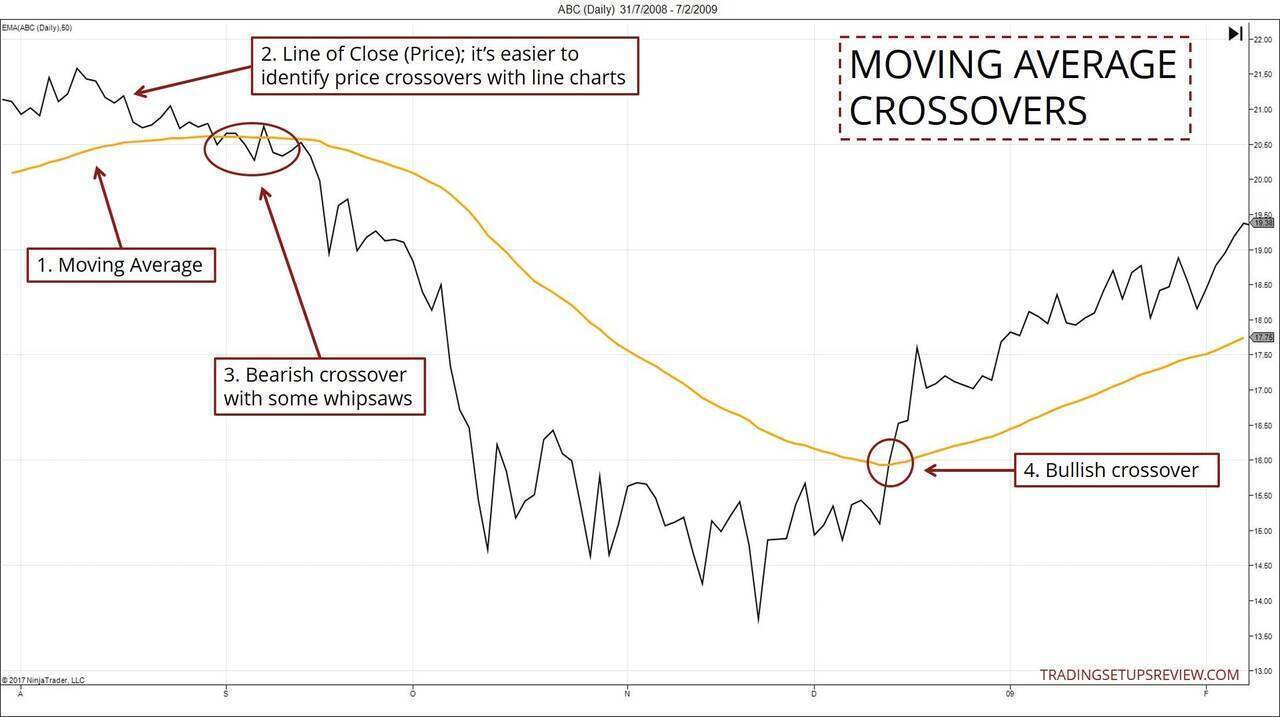
Whipsaws pose a problem with this method. Whipsaws are false signals of trend changes. They happen as the market crosses over the moving average in quick succession. Due to this phenomenon, you might get confused during a sideways market.
Luckily, there are more reliable ways to check if a trend is emerging. Here, you will learn three ways to do so.
#1: Slope of Moving Average
This method is simple but useful. Just focus on the slope of the moving average.
- Sloping upwards - Bull trend
- Sloping downwards - Bear trend
In the chart below, the background color corresponds to the direction of the moving average.
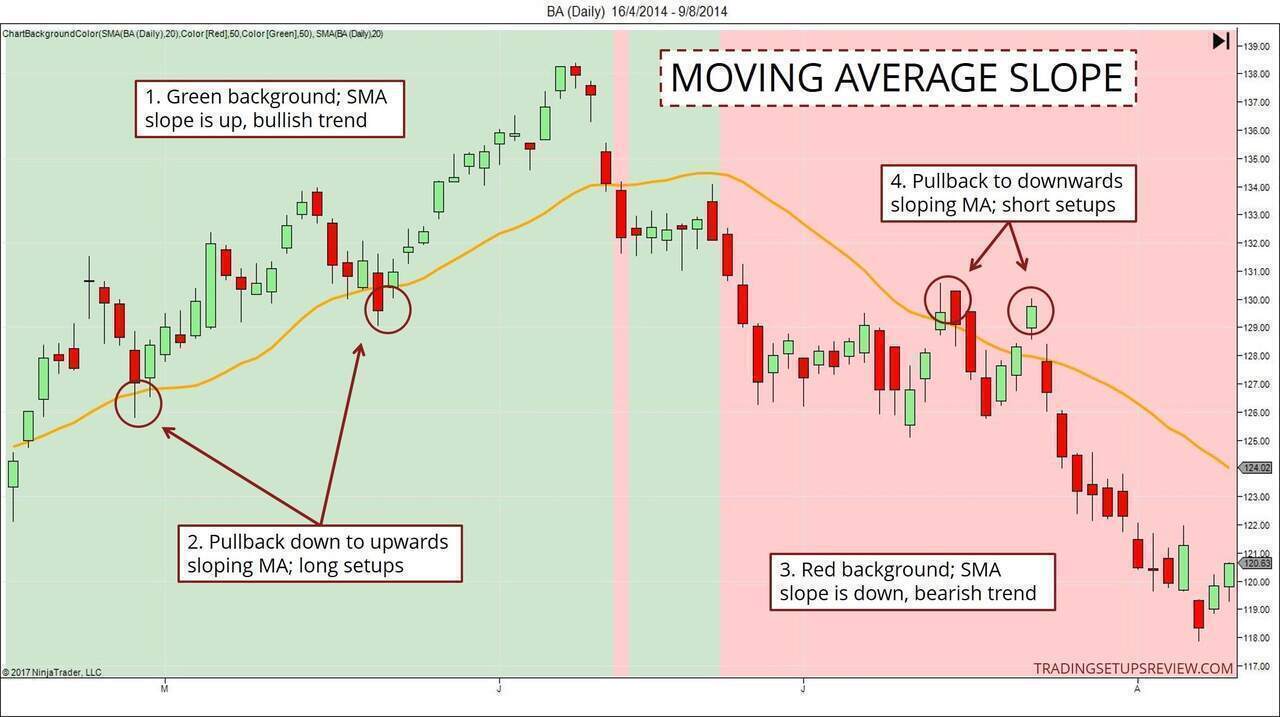
The advantage of this method is its responsiveness and simplicity. However, it relies on the moving average alone. Thus, it’s easy to forget about price action itself.
Trading Tip: When the price falls below the SMA, but the slope stays bullish, consider a long setup.
Conversely, when the price rises above the SMA but the slope remains pointing down, look for a short setup. (Works better with an SMA and not as well with an EMA.)
#2: Swing Pivot Confirmation With Moving Average
Unlike the first approach, this method forces you to pay attention to price action. It helps you to avoid the common pitfall of relying too much on the indicator.
The price swings in the examples below are marked according to the rules taught in Day Trading With Price Action.
Bullish Example - 6J Futures (JPY/USD) 30-Minute
How To Confirm Bullish Trend With Swing Pivots:
- Swing low forms above the moving average
- Price pushes to a new trend high without touching the moving average
Take a look at the example below.
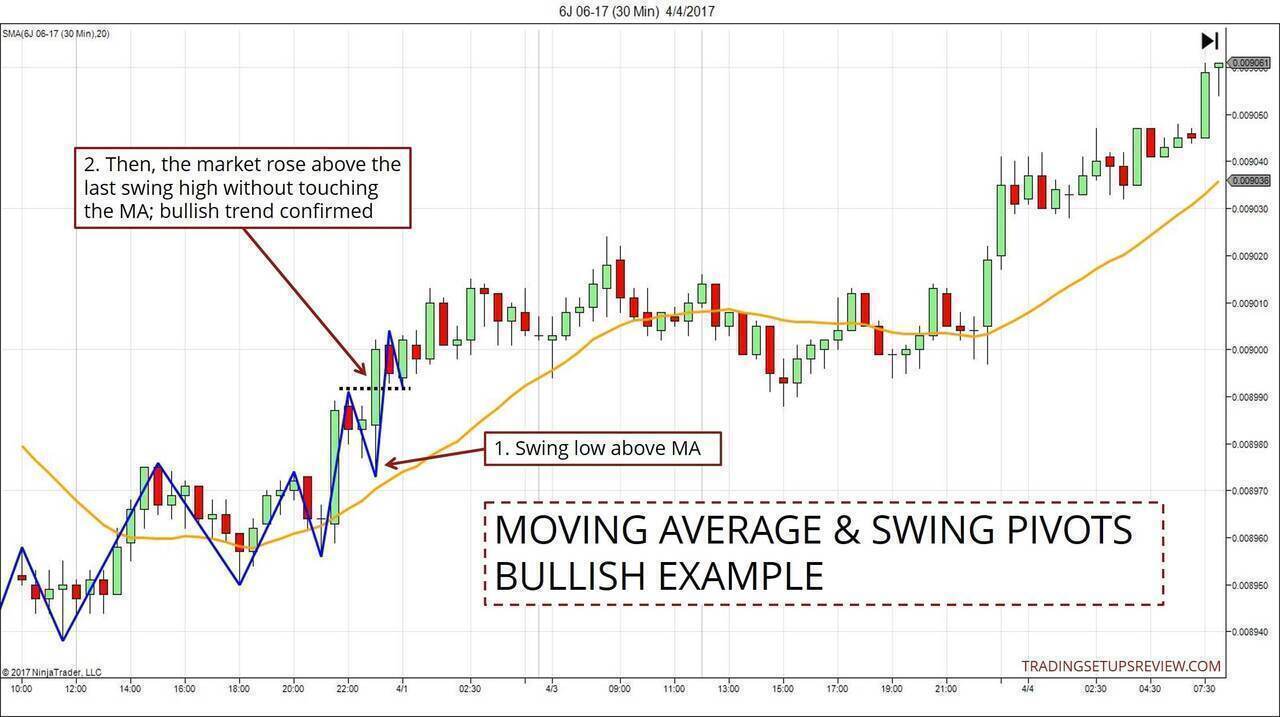
- This swing low formed above the moving average.
- Then, without pulling back to the moving average, the market made a new high. This push confirmed the bullish trend.
Bearish Example - 6E Futures (EUR/USD) 30-Minute
How To Confirm Bearish Trend With Swing Pivots:
- Swing high forms below the moving average
- Price falls to a new trend low without touching the moving average
See the example below.
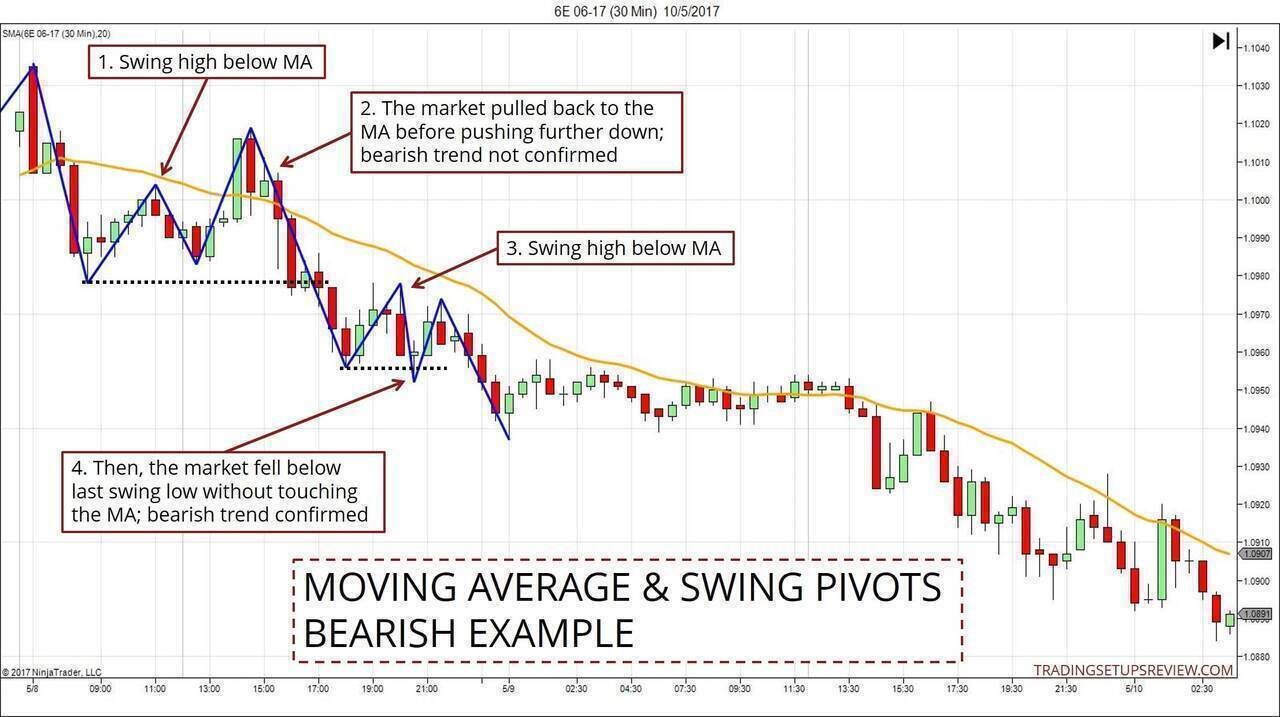
- This swing high formed below the moving average.
- However, the market continued to rise and hit the moving average before pushing to a new low. This development forestalled a bearish trend confirmation at this point.
- Again, we observed a swing low below the moving average.
- Then, without pulling back to the moving average, the market fell to a new low. This fall confirmed a bearish trend.
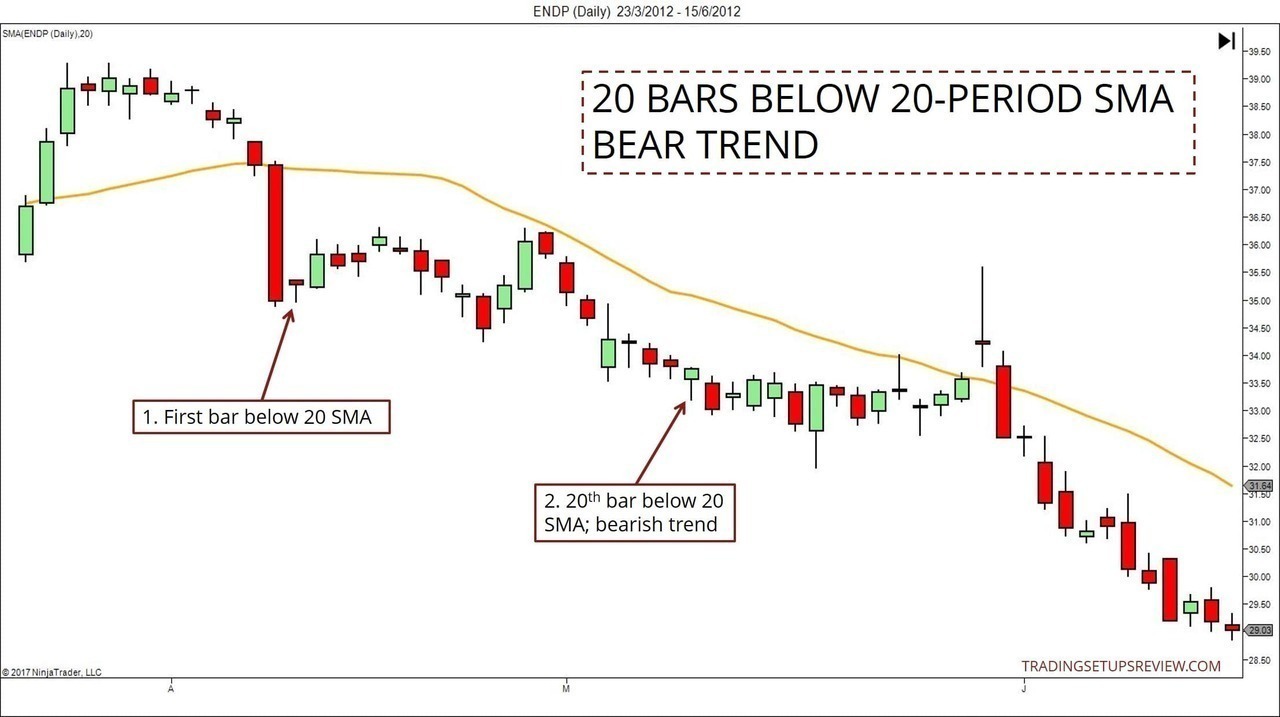
#3: X Bars Above/Below X-Period Moving Average
This method identifies a strong trend. At this stage, the trend is already firmly established.
If you are looking to enter a new trend, this method is not suitable. But if you want to confirm that the most recent trend is a strong trend with momentum, this is the way to do it.
Example: 20 Bars Below The 20 SMA - Bearish
The same logic applies to moving averages with different lookback periods. For instance, 50 bars above the 50 SMA imply a bullish trend. With 50 bars, it indicates a more stable trend than its 20 bar counterpart.
This approach is not the agilest, but it offers an objective formula to find market trends.
Moreover, in the hands of a master trader, this method can become a dominant market guide. Try paying attention to price action shown by the X number of price bars. Often, it yields useful hints for traders.
For instance, you see 20 price bars far above the 20-period moving average. If the 20 bars form a steep rise, the market is likely exhausted. Reversal or consolidation might follow.
On the other hand, you might observe 20 price bars drifting sideways, just slightly above the moving average. In this case, these 20 bars above the moving average are more likely to be subtle bullish hints. A trend play is sensible.
How To Determine The Trend With A Moving Average - Trading Notes
As mentioned earlier, these methods are more reliable than the moving average crossover. But this added reliability comes at a cost. It takes the form of a delay. You can only confirm the trend later.
Such trade-offs of one advantage for another is a constant theme in trading. The key is to find the right trade-offs in the context of your trading plan. Even among the three methods above, you can see differences in reliability and timing.
Bonus method: Use price envelopes to define trends. See how it works in this day trading strategy.
In the three chart examples above, each one used a different method to determine the trend. Try applying the other two approaches to each chart for practice. This exercise will help you appreciate their differences and uncover more insights.
You might be thinking: why do I need to understand these methods in detail? I already know how to interpret them. Must I really get into the nitty-gritty?
You should because these trend determination methods are not trading strategies. You must integrate them into a trading strategy. And to do that effectively, you must learn the underlying price action of each method.
Only then, you can wield the moving average as a powerful weapon.
If you prefer to work without a moving average and focus just on price action, take a look at my price action trading course. It shows you how to judge the market bias with swing pivots and trend lines.