This website or its third-party tools use cookies which are necessary to its functioning and required to improve your experience. By clicking the consent button, you agree to allow the site to use, collect and/or store cookies.
Please click the consent button to view this website.
I accept
Deny cookies Go Back
  • Price Action Trading Course
  • Trading Setups
  • Topics ↓
    • Price Action Trading
    • Day Trading
    • Trader Development
    • Site Map
  • TSR Trading Guides
  • Resources
    • Udemy Trading Course
    • Trading Books
    • Trading Indicators
    • Forex Tester 4
    • NinjaTrader & Kinetick
  • Member Login

Trading Setups Review

Trading Strategies, Guides, and Articles for Active Technical Traders

You are here: Home / Trading Articles / The Secret To Using ADX Indicator

The Secret To Using ADX Indicator

By Galen Woods in Trading Articles on December 16, 2013

You can sum up the secret to using ADX indicator in a single word: SLOPE.

Most traders learn that ADX is a robust system that tells you if the market is trending. The typical interpretation is that if ADX is above 25, the market is trending. If ADX is below 25, the market is meandering without direction. (You can also use ADX as a low-risk day trading trigger with the 2-period ADX.)

While the value of ADX is significant, the slope of ADX is also a valuable tool. After all, for ADX to move above 25, it must first tilt up.

Hence, the ADX slope will be positive even before it crosses 25. This change of slope gives us an early signal to a trending market. Similarly, when ADX slopes down, the market might be entering a trading range.

In a nutshell, paying attention to ADX slope compensates for the lagging nature of the ADX indicator.

Interpreting ADX Slope

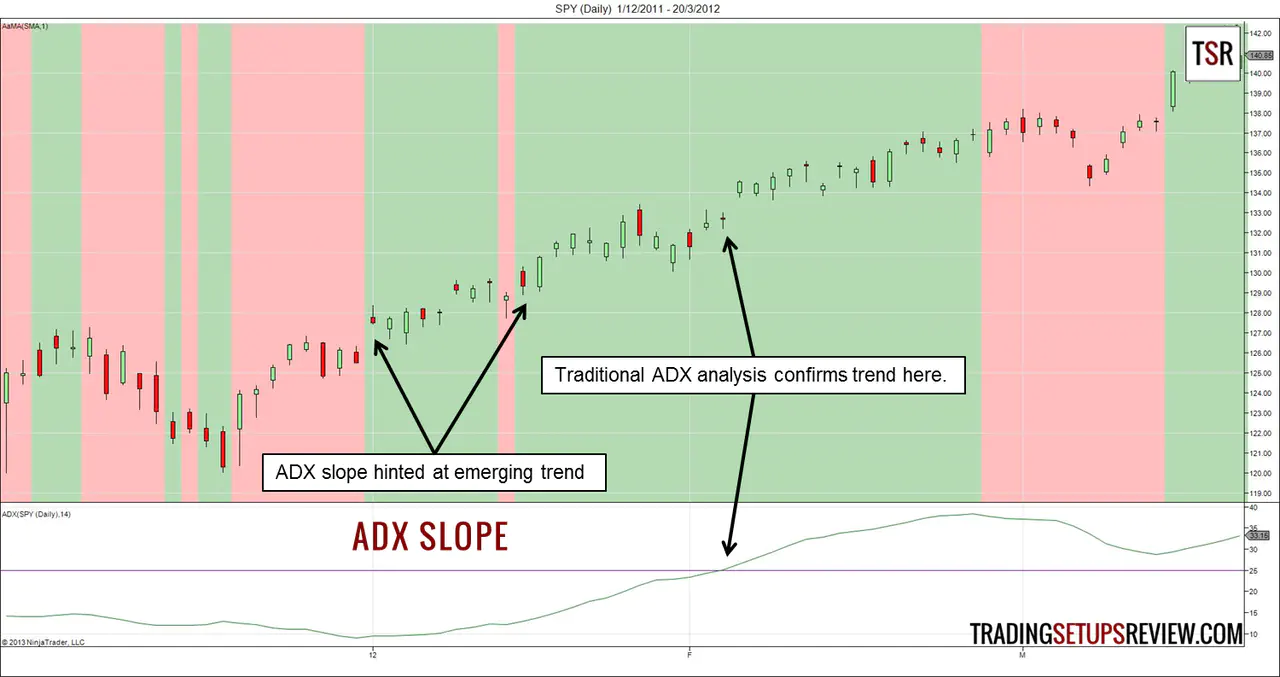
Rising ADX slope means trending market

ADX slope trend
The chart above shows daily price bars of SPY. The lower panel shows the ADX indicator.

The background color of the chart is green when ADX is rising and turns red when ADX is falling. (I used the Chart Background Color Indicator for this.)

Looking at the ADX slope gave earlier signals to a trending market. The ADX slope turned positive at two points that hinted at a trending market.

If we had waited for ADX to rise above 25 to confirm the trend, the signal would come almost a month after the first hint from ADX slope.

Of course, the ADX slope is no Holy Grail. ADX slope changes directions frequently and is more prone to giving false signals. However, if you pay attention to the price action together with the slope of ADX, you can cut false signals reliably.

This is how you do it. When prices are moving in one direction, the slope of ADX should stay positive. Look at the downswing near the left-hand side of the chart. During that downswing, prices are falling, but ADX slope fluctuated up and down. So we ignore those signals.

Compare this to the first hint of the uptrend that we pointed out. Prices have risen before the change in ADX slope. Prices continued to increase with ADX sloping up for consecutive bars. This is a more reliable sign that a trend is in place.

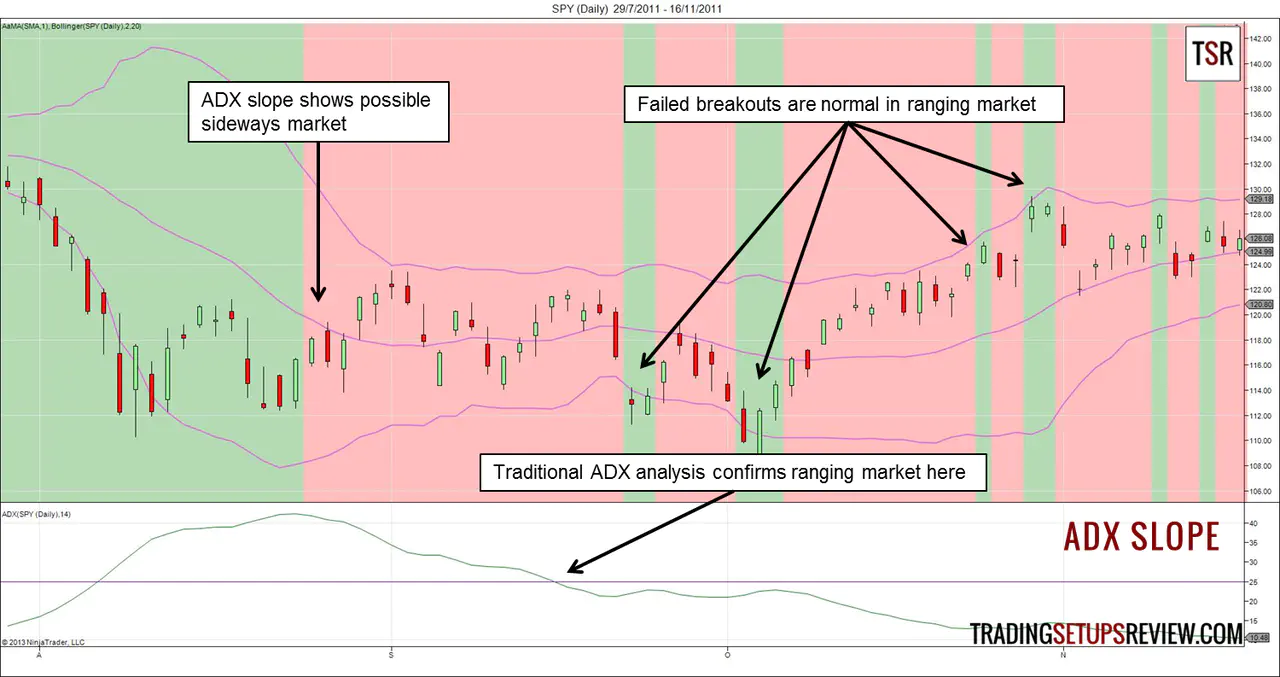
Falling ADX points to Ranging Market

ADX slope range
Again, the ADX slope gave a signal of a ranging market almost three weeks earlier than traditional ADX analysis.

Once we confirm that the market is ranging, be doubtful of positive ADX slope signals as failed breakouts are common. Unless the positive ADX slope comes with a definite breakout from the trading range, assume that the breakout will fail.

Bollinger Bands are useful for estimating the support and resistance levels within the range. The Gimmee bar trading strategy uses Bollinger Bands to trade ranging markets. Employing the ADX slope to scan for sideways market before looking for Gimmee bars is a good idea for swing traders looking for trade opportunities.

ADX Slope is not a well-kept secret

Okay, I must confess. Using ADX slope is not that much of a mystery. (In fact, please be doubtful of any trading secrets, especially those that cost you $3,000 each.)

Several advanced users of ADX has discussed using the ADX slope for trading in forums and trading books. I shall redeem myself by listing them here for you.

  • Why ADX > 20 is a Lie discussion on Traderslaboratory
  • Direction is the Key to Using ADX Correctly
  • ADXcellence: Power Trend Strategies

Keep practicing and make the most out of this fantastic indicator.
Read more about ADX, Trading Range, Trading Trend

Serious Traders Only!

Day Trading With Price Action – A complete course that teaches you the art of price action trading.

Perfectly structured with step-by-step guides to help you understand the principles of price action analysis.

Click here for the course syllabus

More From Trading Setups Review

Looking Inside the Inside Bar for Day Trading

Bollinger Squeeze on TSN Daily

10 Resources For Learning Price Action Trading

Trading Course Banner

Comments

  1. paul says

    February 26, 2016 at 3:59 AM

    Hi,

    Just read your very interesting article on correct use of ADX indicator. Would you please advice if the chart background coloring (based on ADX increase / decrease) indicator is available for public use. If so, is that something you would be prepared to issue to my email?

    Thanks in anticipation. Thanks also for a very enlightening article.

    Kind regards,

    Reply
    • Galen Woods says

      February 26, 2016 at 1:11 PM

      Thanks for the comment. Glad to help. Check your email!

      Reply
  2. Eddie says

    April 30, 2016 at 11:38 PM

    Nice interpretation. Kindly email for further appreciation.

    Thanks.

    Reply
    • Galen Woods says

      May 3, 2016 at 3:57 PM

      Thanks for the comment Eddie. Check your email!

      Reply
  3. Nil's says

    May 30, 2016 at 12:16 PM

    Hey Galen Woods, a nice strategy. Can you provide me details on chart background coloring (based on ADX increase / decrease) indicator?

    Sometime I had seen that when ADX reached to 100 it drastically fall down to its middle range at least with the market price as well. Can you enlighten this ?

    Reply
    • Galen Woods says

      June 1, 2016 at 10:27 AM

      Thanks for the comment! What charting platform do you use?

      With typical settings, it’s unlikely that ADX will hit 100. What ADX settings are you using?

      Reply
  4. Sunil says

    July 4, 2016 at 7:54 AM

    How to use adx in India

    Reply
    • Galen Woods says

      July 5, 2016 at 12:05 PM

      I’m not familiar with the Indian market, but the same approach of paying attention to the ADX slope applies.

      Reply
  5. reginald hunter says

    July 6, 2016 at 11:06 AM

    Just found this article on color changing adx indicator could you please email it to me? thanks in advance.

    Reply
    • Galen Woods says

      July 8, 2016 at 12:55 PM

      Thanks for the comment. Glad to help. Check your email!

      Reply
  6. Dave says

    September 8, 2016 at 11:54 AM

    Hi i was just wanting to know what to set my ADX period up to its default is 14 should i keep it at that ?

    Reply
    • Galen Woods says

      September 12, 2016 at 7:37 AM

      Hi, for a start, you can keep it at the default 14.

      Reply
  7. Jørgen says

    September 28, 2016 at 6:53 PM

    Hello Galen Woods. I am new in day trading and would like to work with the ADX slope indicator. Do I have to buy this indicator or can I download it from a website?
    Best regards
    Jørgen.

    Reply
    • Galen Woods says

      September 29, 2016 at 1:08 AM

      Hello! I’ll be adding the indicator soon. I’ll let you know once it’s up.

      Reply
      • Jørgen says

        September 29, 2016 at 2:09 AM

        Hello Galan. Thank you very much. How much do I need to pay?

        Reply
        • Galen Woods says

          September 30, 2016 at 3:58 PM

          Pay what you want! Learn more here.

          Reply
        • Galen Woods says

          December 8, 2016 at 11:44 AM

          It’s done! Click here to get the background color indicator. Follow the instructions for Example 1 to get the ADX slope colour.

          Reply
  8. Robert C A Alleyne says

    October 19, 2016 at 2:30 AM

    Hello Galan,

    Great article on the ADX system and using it in a very positive way. I am a firm believer in the value of the ADX indicator. I know we cannot see into the future and all indicators are basically reactive and as such lag. But using the ADX Slope indicator is the next best thing than seeing the future in my opinion. I would greatly appreciate it if you can send me the indicator along with the changing chart background. Very very useful tool.

    Many thanks

    Robert

    Reply
    • Galen Woods says

      October 24, 2016 at 10:24 AM

      Hi Robert, thank for the sensible comments there. We can’t see into the future. Check your email for the indicator!

      Reply
  9. RAVINDRA says

    November 13, 2016 at 12:39 PM

    SIR
    CAN U POST THE INDICATOR SET UP OF ADX TO MY EMAIL?

    REGARDS
    RAVI

    Reply
    • Galen Woods says

      November 20, 2016 at 8:50 AM

      Hi, I’ll be adding the indicator soon. I’ll let you know once it’s up.

      Reply
  10. Nitin says

    November 22, 2016 at 12:05 PM

    Nice article. How to implement colour change in price chart for falling / rising ADD? Please email to my address. I am using investing.com for charts.

    Reply
    • Galen Woods says

      December 8, 2016 at 11:48 AM

      Thanks! I don’t think the charts on Investing.com has the option to colour the background according to indicator value changes. But NinjaTrader has that option. You can find out how to implement that with NinjaTrader. Click here to get the background color indicator. Follow the instructions for Example 1 to get the ADX slope colour.

      Reply
  11. Ian Morrison says

    November 24, 2016 at 11:44 PM

    Hello Galen;

    Great article. I too have been trading while trying to keep a close eye on the ADX slope. However it is often hard to detect with the naked eye. Your indicator would be exactly the visual that I have been looking for. I am looking for a version for metatrader4. Do you know if any such indicator exists? I can’t find anything myself.
    Appreciate any help.
    Thanks and regards,
    Ian

    Reply
    • Galen Woods says

      November 29, 2016 at 2:41 PM

      Thanks Ian. I’m not familiar with MT4. I tried combing through some forums for you, but the search turned up empty too. I’ll let you know if I find anything.

      Reply
  12. shiraz says

    December 5, 2016 at 10:43 AM

    Just read your very interesting article on correct use of ADX indicator. Would you please advice if the chart background coloring (based on ADX increase / decrease) indicator is available. What a concept!

    Reply
    • Galen Woods says

      December 8, 2016 at 11:45 AM

      Right now I only have the indicator for NinjaTrader 7. Click here to get the background color indicator. Follow the instructions for Example 1 to get the ADX slope colour.

      Reply
  13. Jimmy Vitale says

    June 14, 2017 at 3:02 AM

    Hi Mr. Woods
    Good article on the ADX. Thank you. We are developing an ADX strategy to be used with major index 3x ETFs; currently using an ADX 10; DI+ DI- 10 setting. Might you have a suggestion for a more optimal ADX DI setting?

    Many thanks
    Jimmy

    Reply
    • Galen Woods says

      June 15, 2017 at 12:26 AM

      Hi Jimmy, your settings sound like a good starting point. But much depends on how you intend to use the indicator and your time frame as well. I wish you all the best with its development.

      Reply
  14. Moe Caron says

    October 9, 2017 at 2:27 AM

    Hi Galen
    Very interesting article on ADX background color. I trade NQ futures with NT8 platform, Could you provide the ADX slope chart backgound coloring for NT 8. Much appreciated Thanks

    Reply
    • Galen Woods says

      October 12, 2017 at 10:07 AM

      Hi Moe, great to hear from you. Right now, I only have the background indicator for NT7, which you can find here. I’ll work on an NT8 version soon and update you once it’s done.

      Update: The indicators for NT8 is now available. Click the link above to learn more.

      Reply
  15. Gytis says

    March 16, 2018 at 4:50 PM

    Just found this article on colour changing adx indicator could you please email it to me? thanks in advance.

    Reply
    • Galen Woods says

      March 17, 2018 at 8:37 AM

      Hi Gytis, what’s your charting platform?

      Reply
  16. M SIVA says

    April 13, 2018 at 9:01 PM

    Dear Sir,

    Greetings
    Please can u send me the indicator for mt4.
    Back ground colour change while sloping

    Thanks and regards
    M.Siva

    Reply
    • Galen Woods says

      April 17, 2018 at 12:54 AM

      Hi Siva, right now we only have the indicator for NT7. I’ll update this page once there’s a version for MT4.

      Reply
  17. Connor says

    May 9, 2018 at 2:25 PM

    Just read your great article on correct use of ADX indicator. Is the chart background coloring (based on ADX increase / decrease) indicator available for public use. If so, is that something you would be prepared to issue to my email? I use TC2000.
    Thanks in anticipation.

    Reply
    • Galen Woods says

      May 11, 2018 at 1:12 PM

      Hi Connor, I only have the indicator for NT7 right now. I’ll let you know if I can find something that works for TC2000. You can also try looking for an SMA indicator that changes its color according to its slope, and if TC2000 allows, nest the ADX indicator within this SMA indicator.

      Reply
  18. Kumar says

    September 9, 2018 at 9:31 AM

    Hi Galen,
    Is this ADX indicator with background changing colors available in C# for Protrader platform? I am a swing trader who trades stocks, futures and options, currencies and commodities.

    Reply
    • Galen Woods says

      September 10, 2018 at 11:23 AM

      Hi Kumar, I don’t have the indicator for the Protrader platform. Only for NinjaTrader 7 and 8 at the moment.

      Reply

Leave a Reply Cancel reply

Your email address will not be published. Required fields are marked *


Search Trading Setups Review

Get a Free Course Chapter from Galen Woods' Day Trading With Price Action Course [PDF]

Plus, our latest trading guides and tips in right your inbox.

Recommended For You

3 Key Principles of Technical Analysis

Trading: Your Passion or Addiction? How To Cultivate A Healthy Trading Passion

3 Holy Grail Trades

The Ultimate Guide to Volatility Stop-Losses

Capture High Profits with Low Volume Pullback Trading Strategy

How to Trade with Price Action

10 Chart Patterns For Price Action Trading

Trading Course Banner

Trading Setups Review

  • About Us
  • Contact Us
  • Advertise With Us
  • Privacy Policy
  • Affiliate Disclaimer
  • Full Risk Disclosure

Learn More

  • Day Trading With Price Action Course
  • TSR Trading Guides
  • Trading Setups
  • Trading Articles
  • Trading Books
  • Site Map

Futures and forex trading contains substantial risk and is not for every investor. An investor could potentially lose all or more than the initial investment. Risk capital is money that can be lost without jeopardizing ones financial security or life style. Only risk capital should be used for trading and only those with sufficient risk capital should consider trading. Past performance is not necessarily indicative of future results.


The website contents are only for educational purposes. All trades are random examples selected to present the trading setups and are not real trades. All trademarks belong to their respective owners. We are not registered with any regulating body that allows us to give financial and investment advice.


Trading Setups Review © 2012–2021