CCI Indicator For Day Trading Forex
By Galen Woods ‐ 9 min read
Are you using CCI indicator the right way? Learn a reliable day trading strategy based on Donald Lambert's original article on CCI indicator.
Donald Lambert introduced the Commodity Channel Index (CCI) in the Stocks & Commodities magazine back in 1980. Now, you can find the CCI as a standard indicator in most charting packages. Clearly, it has stood up to the test of time.
In this article, we’ll use Lambert’s original article on the Commodity Channel Index as a starting point. By considering his trading tips, we will create a day trading strategy and apply it to forex markets.
Specifically, let’s explore it within the context of intraday forex trading.
What Is The CCI Indicator?
I’ll not go into the math here. If you’re interested in the exact calculation of the CCI, ChartSchool has a fantastic explanation complete with a spreadsheet for you to tinker with.
What I’ll do here is to explain the intuition behind this elegant indicator.
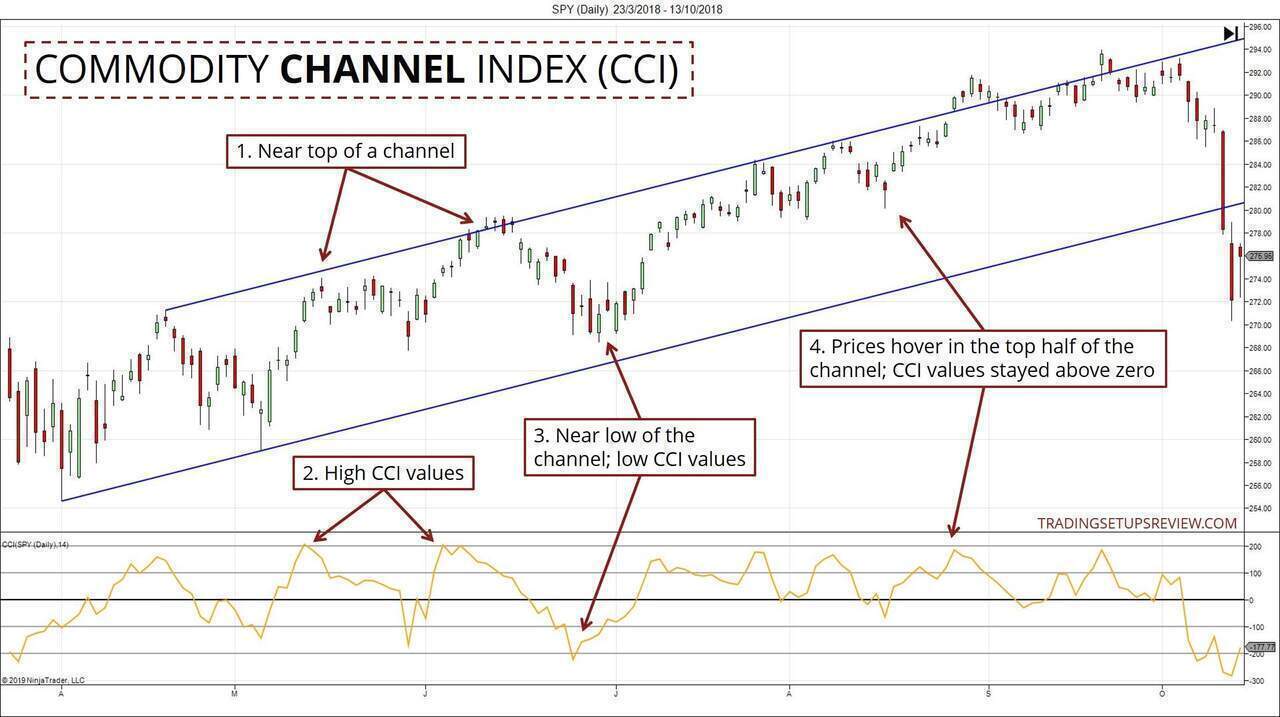
Think of a channel surrounding price action.
What are we interested in examining? Prices relative to the channel. So we ask questions like:
- Is price action near the top of the channel?
- Is it beyond the channel?
- Or is it near the bottom of the channel?
Price action traders would answer these questions by drawing a channel and observing the price action.
But the CCI indicator offers a quantitative response to these questions.
- High values - Price action is near the top of the channel.
- Low values - Price action is near the bottom of the channel.
- Lambert designed the CCI values to fall within -100 to +100 most of the time.
(This design of the CCI is similar to the %B indicator.)
Note: The channel above illustrates the intuition behind the CCI indicator design. The actual channel that the CCI constructs is not the channel you see in the chart above.
Trading indicators are not magical. They do not produce a number out of thin air. Instead, they are designed to capture and highlight specific price action behaviors.
Hence, with any indicator, I encourage you to understand the price action concepts at work. Think about what price action pattern or behavior is the indicator targetting?
Formulating our CCI Day Trading Strategy
CCI Trading Signals
The CCI falls under the umbrella of trading oscillators like the Lane’s Stochastic and Wilder’s RSI. The typical approach of finding trade signals with oscillators is to focus on oversold and overbought levels.
Hence, unsurprisingly, some traders employ the CCI indicator with this approach:
- Buy when it is below -100 (oversold)
- Sell when it is above +100 (overbought)
However, if you refer to Donald Lambert’s original article, he did the exact opposite.
If the CCI goes above the + 100 line, that’s a signal to establish a long position. When the CCI drops below the + 100 line, the long position is closed out. The same techniques apply to short positions at the -100 line.
Taking our cue from him, we will look for:
- Long setups when the CCI indicator moves above +100
- Short setups when the CCI indicator falls below -100
CCI Period
When you employ a tool, you always need to decide on its settings. And in particular, its lookback period is the most critical parameter.
For its lookback period, Lambert stated that:
… data base (look-back period) should be less than one third of the cycle length to produce a reasonable level of theoretical efficiency.
Instead of performing complex cycle analysis, let’s assume that there are daily cycles in forex markets. Hence, the cycle length is 24 hours.
- In this article, we are analyzing 30-minute price bars.
- In a day (or 24 hours), we have 48 bars.
- One-third of the cycle length is 16 bars.
Hence, let’s keep things simple and stick to the default CCI setting of 14-period.
CCI Drawbacks
Donald Lambert also cautioned that:
Too short a data base will produce whipsaws as the index interprets daily price fluctuations as being cycle tops or bottoms.
To mitigate this drawback, we need to design a way to avoid whipsaws.
For this, we will rely on price action analysis.
Our guidelines are:
- Do not enter immediately after a CCI signal.
- Wait for a retracement.
- Use a trend bar in the direction of your intended setup as your setup bar.
To minimize whipsaws, you should perform detailed price action analysis during the retracement.
In the examples below, you will see how the best setups involve reliable price patterns and S/R zones.
Trading Rules - Day Trading with CCI
Based on the above considerations, these are our day trading rules for this indicator.
Long Trading Setup
- 14-period CCI moves above +100
- At least one bar closes down (retracement)
- Place a buy stop order one tick above any bull trend bar
However, if the CCI falls below -100 at any point, the trading setup is void. Cancel all orders, and wait for another opportunity.
Short Trading Setup
- 14-period CCI moves below -100
- At least one bar closes up (retracement)
- Place a sell stop order one tick below any bear trend bar
If CCI rises above +100 at any point, the trading setup is invalid. Cancel your sell stop order, and wait for the next setup.
CCI Trading Examples
In the two of the examples below, I applied the Congestion Zone indicator from my trading course to highlight potential support areas.
Example #1: Bullish Setup
This 30-minute chart comes from the EUR/USD forex pair.
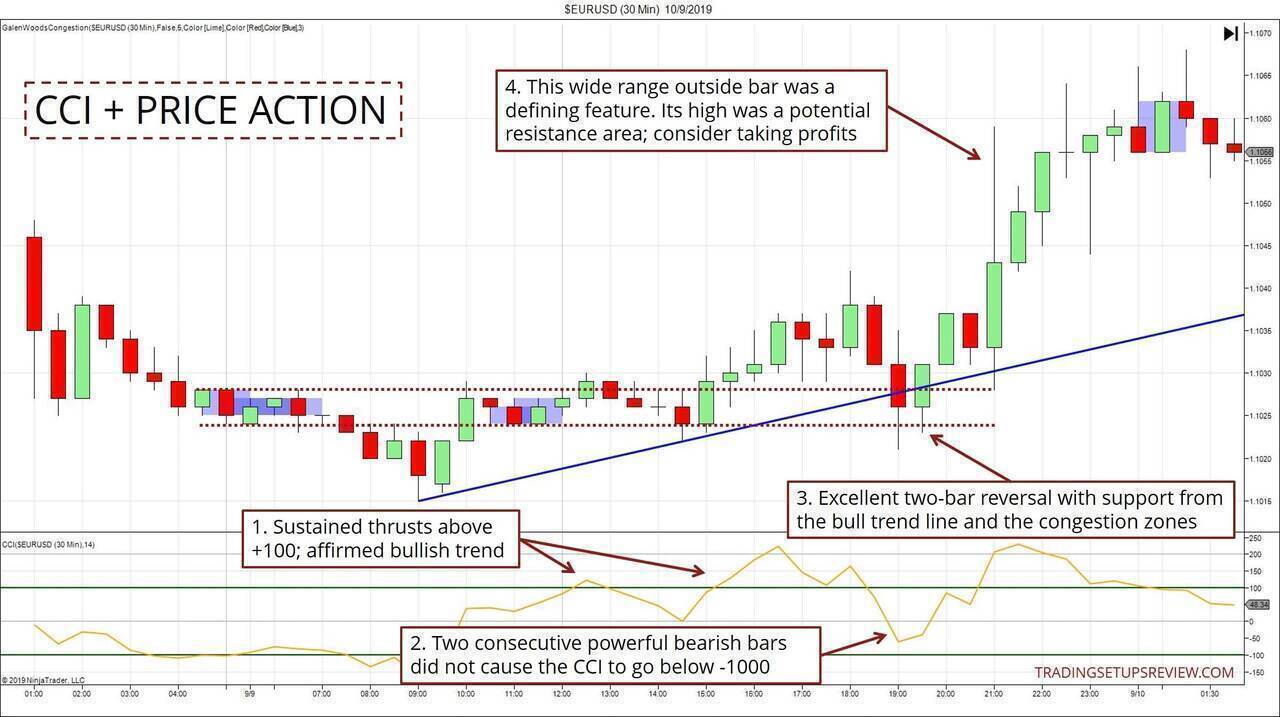
- Look at these two instances of the CCI breaking out above the +100 level. These sustained thrusts hinted at an impending bull trend.
- Moreover, the strongest pullback at that point did not cause the CCI to fall below -100. It was another sign that the bulls were holding up.
- This bullish trend bar was our setup bar. It was excellent as it coincided with the bull trend line and a congestion zone. The confluence of support at this point was fantastic.
- This wide range outside bar was a defining feature, signaling a bullish climax. You could consider taking profits at its highest point.
Example #2: Bearish Setup
This 30-minute chart example comes from the 6E futures market. Its underlying asset is the EUR/USD currency pair.
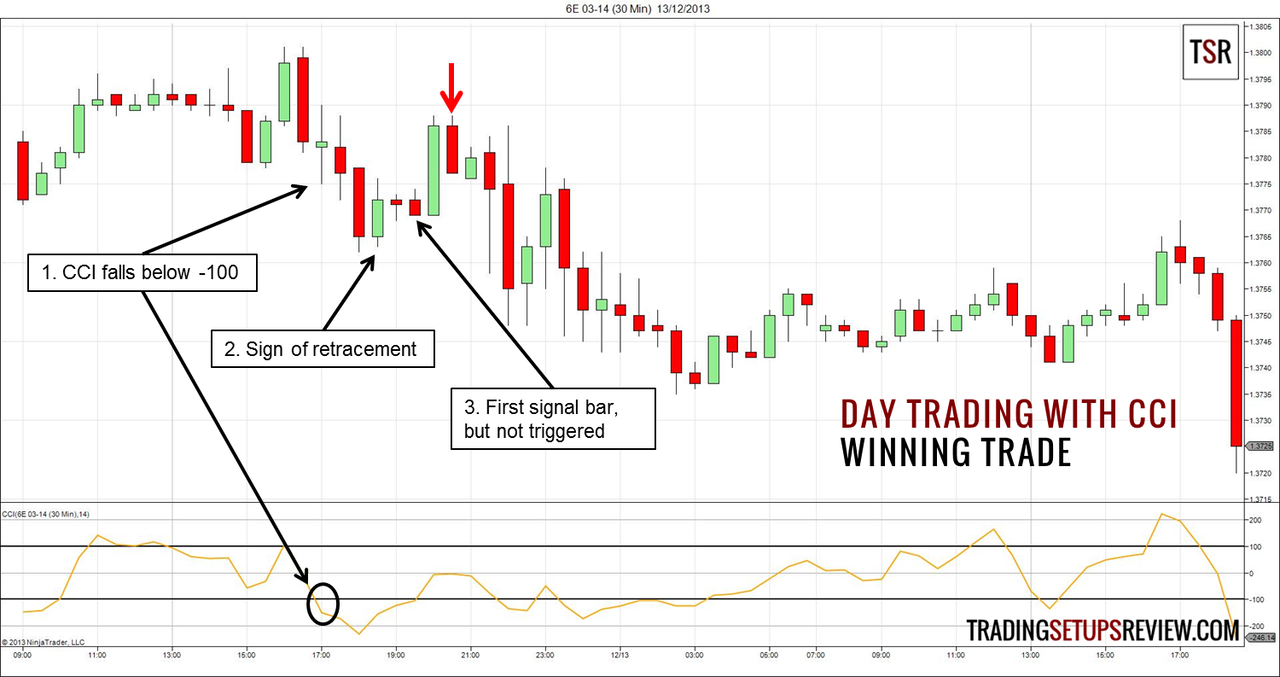
- The CCI fell below the -100 line, setting up the stage for short trades.
- This bar closed up and was the first sign of a retracement. At this point, we started looking out for a bear trend bar to trigger a short trade.
- This small bearish bar was a potential trade trigger. But the market did not go below it to trigger our sell stop order. Instead, we went short at the bearish inside bar (red arrow).
The inside bar and its preceding bar formed a distinctive two-bar reversal pattern. Reversal patterns work best when they jut out of preceding price action, and that was the case here.
Example #3: CCI For Profit-Taking
This example comes from the GDP/USD currency pair.
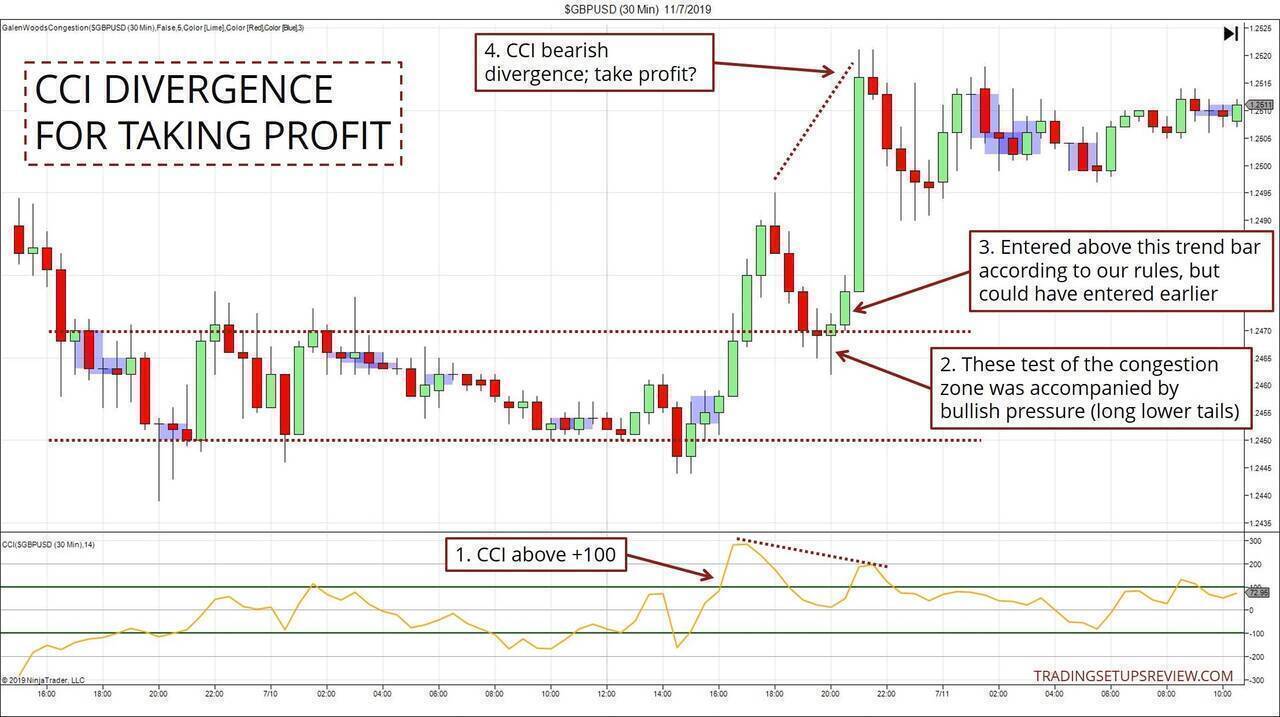
- The CCI rose above +100 at this point and continued to rise above the +200 level. Pushing above the sideways range with such strong momentum was a bullish signal.
- This pullback down to the congestion area ended with buying pressure. Look at the long lower tails (shadows).
- According to our rules, we entered a tick above this bullish trend bar. However, the preceding Pin Bar presented a reasonable entry as well.
- A CCI bearish divergence formed as the market shot up to new heights. As the market rose higher, the CCI made a lower high instead of a higher high. This divergence offered a window for profit-taking.
Indeed, the market started congesting after the CCI divergence.
(If you check your charts, the market continued rising after moving sideways for a bit. Nonetheless, the CCI divergence was a useful signal of a stall in momentum.)
Example #4: Losing Trade
Our final example shows a setup that suffered from a whipsaw.
Depending on your stop-loss placement, this trade could work. However, with a standard stop-loss below the setup bar, the market whipsawed us out of our position.
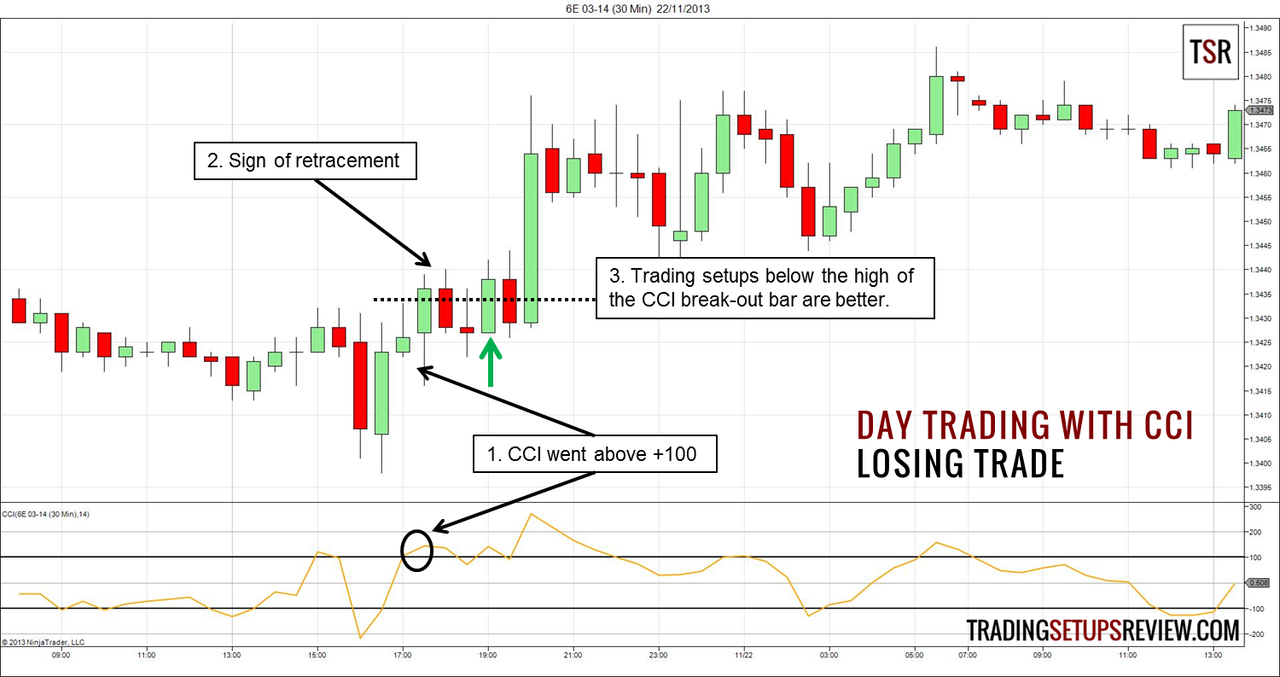
- The CCI indicator rose above +100. It turned down and fell below the +100 level for one bar. Then, it bounced up again to above +100.
- Prices retraced down for two bars before giving us a bull trend bar for entry. However, right after we entered into a long position, an outside bar stopped us out by one tick. (We are assuming the pattern stop a tick below the setup bar.)
- Long trading setups that allow us to enter below the high of the CCI break-out bar tend to offer a better reward-to-risk ratio. Hence, this setup was not optimal.
However, the CCI alerted us to the start of a bull run.
Take a close look at the CCI panel. Immediately before this setup, the CCI pushed to extreme levels twice. The first time to above the +100 level, and the second time to below the -100 level.
Each time, the CCI reversed sharply without any struggle. Hence, it was not surprising that these breakouts did not lead to dominant trends. (Compare these two instances to our observations in Point #1.)
Conclusion - Letting The CCI Lead The Way
The CCI indicator points us to a break-out in the form of a price thrust. It identifies market momentum that is likely to persist.
From there, we can wait for a retracement and perform price action analysis to finetune our entry.
If you revisit the first three examples, you will realize one critical function of the CCI. It helps us to analyze breakouts from a sideways price range. It gives us more information to decide if the thrust will fail or if it would lead to a new trend.
A real breakout from a trading range requires momentum, and that is what the CCI indicator highlights.
In a nutshell, this simple trading strategy uses the CCI for an initial evaluation of the market bias. Then, we wait for a retracement before entering the trade to reduce whipsaws.
Add your own trade management rules to trail stops or set price targets, and you have a robust trading approach to work with.
Remember, observing the price action after the break-out is the key to finding quality trades.
For more ideas on applying trading oscillators to intraday trading, check out:
Source: Donald Lambert’s original article in “Stocks & Commodities V. 1:5 (120-122): Commodity Channel Index: Tool for Trading Cyclic Trends”
This article was first published on 26 December 2013 and updated on 6 November 2019.