Trading Charts Without Time: Range, Tick, Volume
By Galen Woods ‐ 5 min read
Learn about charts without time. Using constant range, volume, and tick to display price data will help day traders see the market and find better entries.
Traditional price charts plot using fixed units of time. Is this the only sensible way to chart? Should we consider charts that ignore the passage of time?
In this article, we will look at the merits of using time charts and the value of alternative charting methods that exclude time.
Why Time Charts?
The first reason is the lack of technology in the past. Exchanges simply did not have the means to make real-time data accessible for market participants. Yes, we had the ticker tape, but it was not available to everyone. Even if it was, there was no software to produce charts on the fly.
Chartists had to draw charts by hand. The clearly feasible method was to do draw daily charts as end-of-day market data was more readily available. And traders back then could wait for the market to close, and update their charts leisurely for analysis.
The second reason stems from logical thinking and not technological limits. Every trading day represents a complete cycle from market opening when traders react to overnight news, to midday sluggishness, to market closing when large funds might adjust their positions.
This is why it makes sense to compare trading days to each other. And since daily charts use fixed units of time. The idea of plotting time charts became the convention.
Charts without Time
However, as technology advances and markets trade round the clock with higher volatility, traders have experimented with a variety of charting methods. These alternative methods usually exclude time. (Gann is turning in his grave right now.)
Let’s take a look at these alternative charting methods and study their pros and cons.
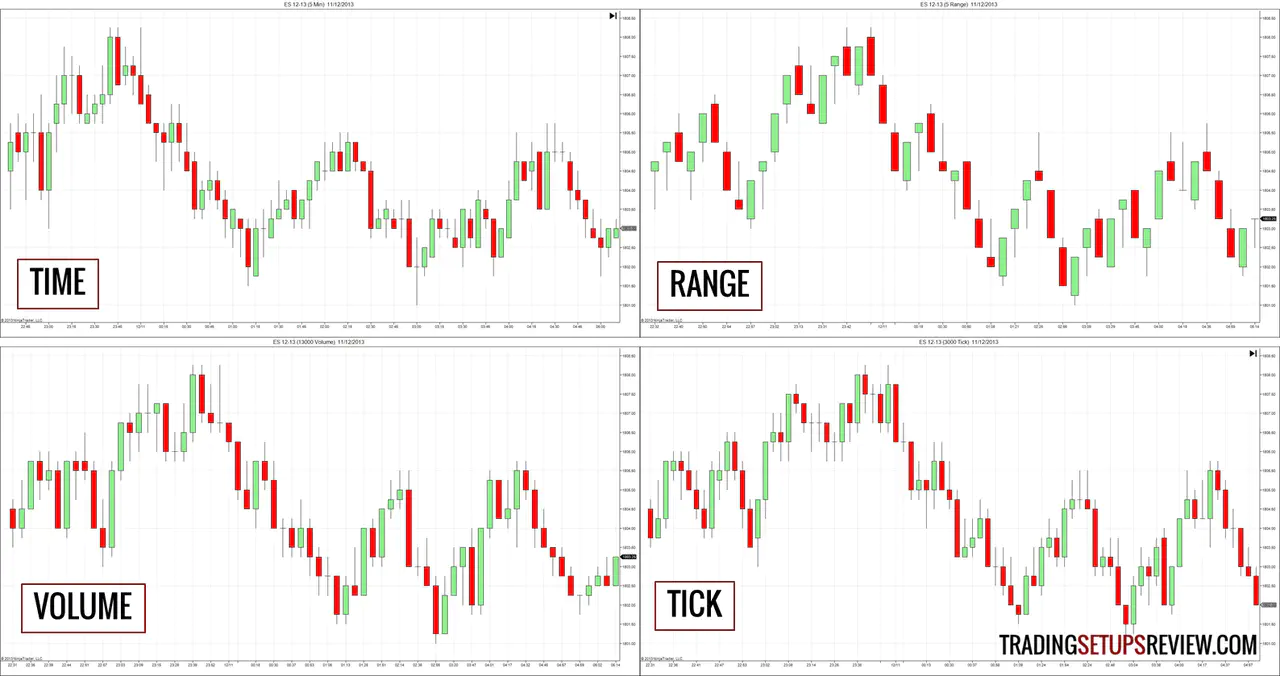
Range Charts
A Brazilian trader, Vincent Nicolellis, came up with range charts in 1995. Basically, range charts plot bars based on units of price movement, and not time. Instead of choosing a time-frame like 5-minute, we choose a range like 5-tick. The chart prints a new bar for every 5-tick movement in the market.
Range charts takes time out of the equation and focus on only one variable: price action. If price does not move, the chart does not move. Hence, some traders claim that range charts help to filter out non-trending markets and avoid whipsaws.
While this sounds like a price action trader’s dream, you have to take note that range bars are not useful for OHLC analysis. We force each range bar to break once it exceeds the specified range, so the bars always close at the extreme top or bottom. Because of this artificial close, most bar patterns and candlestick patterns are ineffective on range charts.
Volume Charts
Volume analysis is a major focus for technical analysts. It is not surprising that we have charts based on units of volume. The example chart above prints a new bar for each 13,000 volume transacted.
Volume is the fuel of market movements. Having fixed volume charts, we can watch what the market does for the same amount of ‘fuel’. Hence, constant volume charts make sense to many traders.
Moreover, unlike range charts, we are able to apply bar pattern analysis on constant volume charts.
Tick Charts
Tick charts are similar to volume charts. However, instead of using a volume base, it uses a tick base. One tick refers to a transaction, regardless of the transacted volume.
Many scalping trading strategies use tick charts. Jjrvat mentioned that his price-based approach works best with tick charts. In Mastering the Trade, Second Edition: Proven Techniques for Profiting from Intraday and Swing Trading Setups, John Carter also recommended tick charts for his Scalper trading setup.
Are Charts Without Time the Holy Grail?
No. These charts without time are just like another way of displaying price information.
Learning them is like learning how to use a new indicator. There is no perfect indicator, and no perfect chart type. They work differently and you must learn to use them well.
Be very careful when trying out charts without a time base. It changes the very foundation of how you build your charts. Hence, it has wider implications than adding any one indicator.
The first step is to figure out what setting to use. One way to start exploring is to take the long-term average range/volume of the time-frame you usually trade, and use that as the setting for your charts. For instance, if you trade the 5-minute time-frame, and the 200-period average range of a 5-minute bar is 4 ticks. You can plot a range chart using 4-tick as the constant range.
You must also bear in mind that most trading methods use time charts. I’m not saying that all trading tools will fail without a time base. Some methods might even work better due to less noise. The only way to find out is to test before using a trading strategy on a non time-based chart.
I do see great value in these alternative charts for intraday trading. As mentioned above, daily charts makes sense because each bar contains an entire trading cycle of a single day. However, for intraday charts, this logic does not apply. A 5-minute bar at market opening is vastly different from a 5-minute bar after market hours. Hence, non time-based charts seem like a better option for intraday trading.
If you want to learn more about charts without time, there are two more popular types of non time-based charts: