Best Settings For Trading Indicators
By Galen Woods ‐ 4 min read
What are the best settings for trading indicators? Join us on our quest to find the best indicator settings. There are dozens of trading indicators.
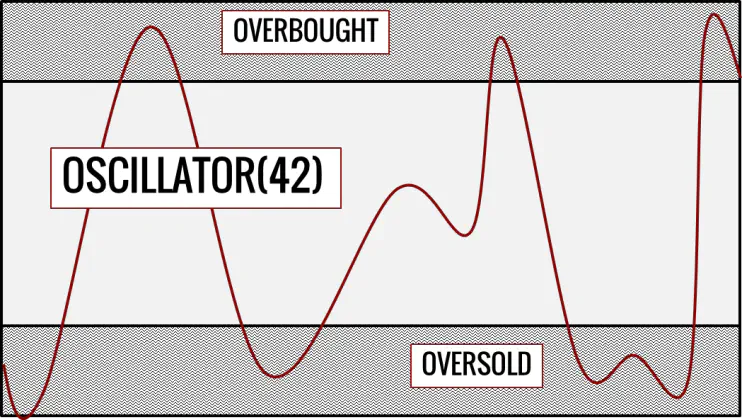
42 is the answer to everything, but still not the best setting for trading indicators.
Before we discuss what are the best settings for trading indicators, we need to recap on an important principle of trading indicators.
Trading Indicators - An Important Principle
Smaller settings lead to more sensitive trading indicators that produces more signals. However, smaller settings makes the trading indicator less reliable.
Larger settings give us more reliable but less frequent signals. And indicators with larger settings lag.
It seems that there is a spectrum of settings for indicators. On one end, sensitive but unreliable. On the other end, reliable but lagging. So, is the perfect indicator setting somewhere between them?
Yes. But the perfect setting is not available in real-time. It is only available in back-testing.
Fortunately, we don’t need perfection for trading success.
How to Choose the Best Settings for Trading Indicators?
Start with the default indicator settings
Always start with the default setting for the trading indicators. This is very important when you are trying to learn a new indicator.
The default settings are what the inventor of the indicator used. The default settings are also the most common among traders. Hence, most of the learning resources including trade examples use default settings.
The default settings for some common indicators are in the list below.
- 14-period Relative Strength Index (RSI)
- 20-period Commodity Channel Index (CCI)
- 14-period Stochastic Oscillator
- 20-period Bollinger Bands (with 2 standard deviations bands)
- 12, 26, 9 periods for Moving Average Convergence Divergence (MACD)
If the default settings work for you, there is no need to meddle with them. Unless you understand how the indicator works and you know what you want.
Consider what you want to do with your trading indicator
If you know what you want your indicator to do, you can apply the principle above to adjust the indicator settings.
For trade triggers, smaller settings work because they do not lag and is able to pinpoint trade entries. For example, to use prices closing above the 3-period simple moving average as a long trade trigger is reasonable for a short-term moving average. The 2-period ADX is another example of adapting an indicator as a trade entry.
However, using a 3-period moving average to figure out the market trend is a joke. The average of the past 3 prices hardly sums up the market trend. A longer term moving average is more suitable for assessing the market trend. The 50-period and 200-period moving averages are commonly used as long-term trend filters.
When you lengthen the indicator period, you can even use oscillators to find the market trend. I use a 100-period CCI to check trends on daily charts.
Experiment with different settings for indicators
If you feel that an indicator is really not doing its job well with default settings, you can experiment with different settings and see how the indicator behaves.
Don’t bother with the difference between the 20-period indicator and the 21-period indicator. To help you with choosing parameters for your experiment, you can use Fibonacci numbers that are commonly used in trading. Some of the common choices are 3, 8, 21, 55, 144, and 233.
Experiment for indicator settings that suits your trading style and purpose, and then stick to it. Do not change the settings regularly or blame your indicator settings for poor trading performance.
Conclusion: Trader and Trading Tools
Ultimately, the best settings for trading indicators depend on your understanding of the indicator, your purpose of using the indicator, and you.
Do you know how to use the indicator? If you don’t know how to use the indicator and interpret it well, the setting of the indicator doesn’t matter.
Focus on learning how to use the indicator, and not on hunting for the elusive perfect setting. Constant tinkering with the settings will only obscure your learning journey.