This website or its third-party tools use cookies which are necessary to its functioning and required to improve your experience. By clicking the consent button, you agree to allow the site to use, collect and/or store cookies.
Please click the consent button to view this website.
I accept
Deny cookies Go Back
  • Price Action Trading Course
  • Trading Setups
  • Topics ↓
    • Price Action Trading
    • Day Trading
    • Trader Development
    • Site Map
  • TSR Trading Guides
  • Resources
    • Udemy Trading Course
    • Trading Books
    • Trading Indicators
    • Forex Tester 4
    • NinjaTrader & Kinetick
  • Member Login

Trading Setups Review

Trading Strategies, Guides, and Articles for Active Technical Traders

You are here: Home / Trading Setups / Moving Momentum Trading Strategy

Moving Momentum Trading Strategy

By Galen Woods in Trading Setups on January 2, 2014

The Moving Momentum trading strategy comes from the ChartSchool at StockCharts.com, where you can find comprehensive information on most technical indicators. This strategy goes through a three-step process to find corrections in trends.

Trading Rules – Moving Momentum Strategy

Long Trading Strategy

  1. 20-period simple moving average (SMA) is above 150-period SMA
  2. Slow Stochastic (14,3) falls below 20
  3. MACD Histogram (12,26,9) moves above zero

Short Trading Strategy

  1. 20-period SMA is below 150-period SMA
  2. Slow Stochastic (14,3) rises above 80
  3. MACD Histogram (12,26,9) moves below zero

Moving Momentum Trading Examples

Winning Trade – Long Trading Signal

Moving Momentum Trading Strategy Winning Trade
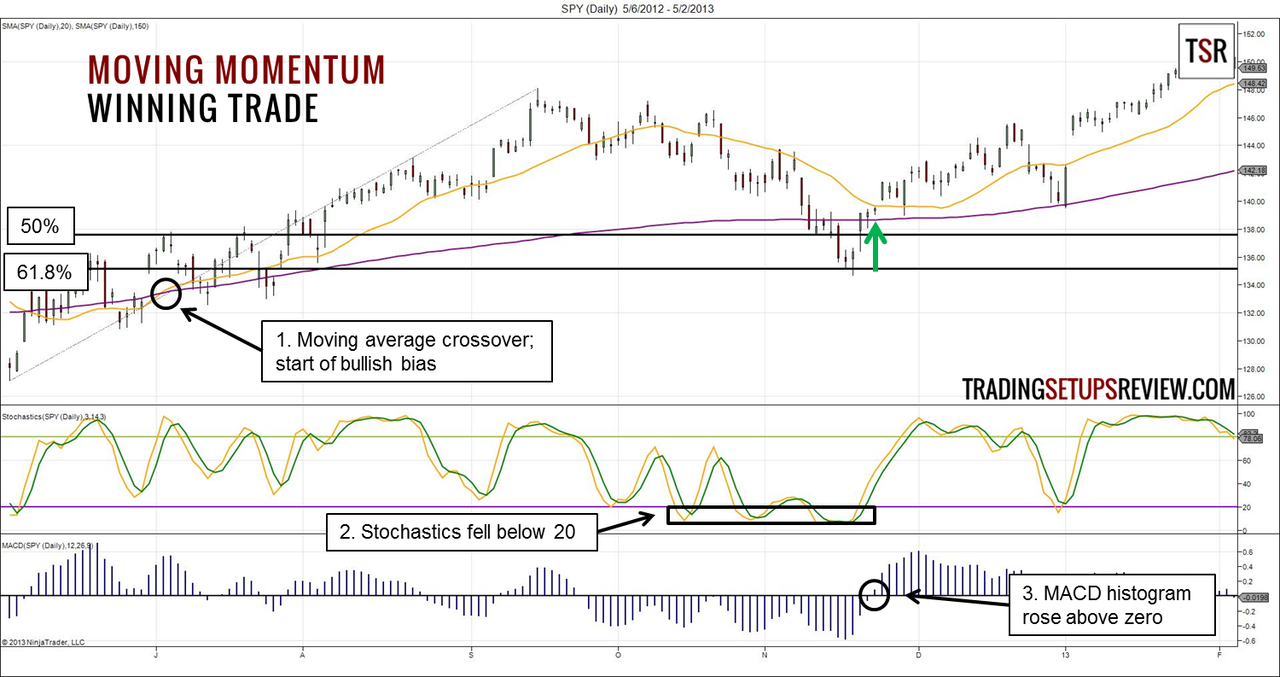
This is the daily chart of S&P 500 ETF (SPY). It shows how the Moving Momentum trading strategy found a profitable entry after a deep pullback in the index.

  1. The 20-period SMA rose above the 150-period SMA to signify a bullish bias.
  2. Slow stochastics fell below 20. It lingered around the lower values as price pulled back substantially.
  3. Finally, the MACD histogram went above the zero line and gave us a long signal. This long signal came after price bounced off from a 61.8% retracement of the previous upswing.

Losing Trade – Short Trading Signal

Moving Momentum Trading Strategy Losing Trade
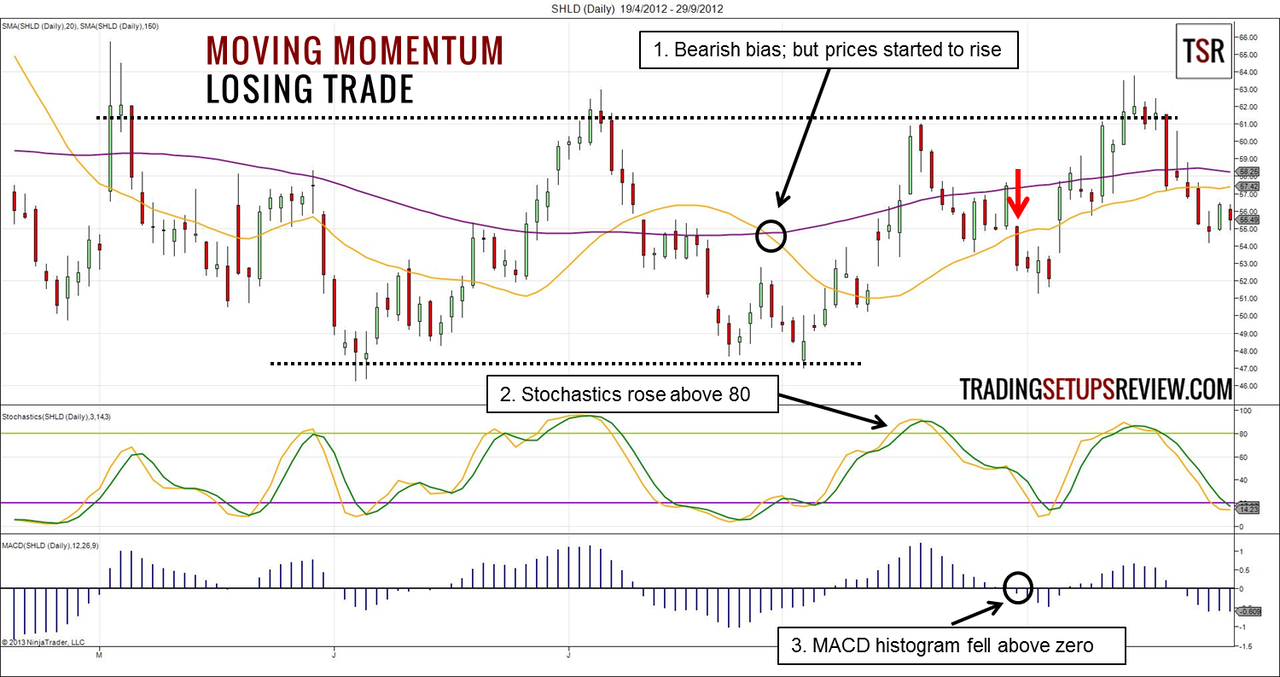
This daily chart of Sears Holdings shows a short Moving Momentum trade which failed. Paying more attention to price itself might help you to avoid this losing trade.

  1. The bearish SMA crossover defined a down trend according to the trading strategy. However, price started to rise immediately after the bearish crossover. Furthermore, a trading range (dotted lines) was forming.
  2. Stochastics rose above 80 and highlighted the pullback. This pullback is deep and went beyond the 150-period SMA. The winning trade example had a deep pullback as well. However, in the winning case, the trend was firmly established. In this example, the trend was in its early stage when deep pullbacks are unusual. Hence, the bearish bias was in doubt.
  3. We went short when the MACD histogram fell below zero. Price shot up and made a higher high shortly after.

Review – Moving Momentum Trading Strategy

This trading strategy’s merit lies with its systematic approach to finding trading opportunities.  The process and logic of this trading strategy is sound.

It uses moving averages to find the long-term trend before using stochastics to find pullbacks. Then, it uses MACD as a trade trigger.

MACD is a reliable trade trigger for complex pullbacks. However, for simple and shallow pullbacks, the lagging nature of MACD gives slow signals with bad reward-to-risk ratio.

(Learn more: MACD Basic Trade by Gerald Appel)

The Moving Momentum trading strategy is not a simple trading strategy. It uses four indicators. The orignal article at ChartSchool correctly pointed out that you will need to calibrate the settings of the indicators according to your trading instrument’s volatility. Adjusting 4 different indicators is not an easy task.

(Read: Template For A Simple Trading Strategy)

Instead of optimizing the parameters and risk the dangers of curve-fitting, you can use this trading strategy to find trading opportunities before observing the price action to see if the trade is worth taking.

Remember that this trading strategy seeks to find corrective moves within a trend. Look at each chart and assess if there is a corrective move within a trend. (Compare the winning and losing examples.)

Read more about MACD, Moving Average, Stochastic

Serious Traders Only!

Day Trading With Price Action – A complete course that teaches you the art of price action trading.

Perfectly structured with step-by-step guides to help you understand the principles of price action analysis.

Click here for the course syllabus

More From Trading Setups Review

The Ultimate Parabolic SAR Trading Guide

Forex Price Action Re-Entry Trading Strategy

Trading The Impulse System by Elder

Trading Course Banner

Comments

  1. John says

    February 15, 2014 at 6:50 PM

    Hey Galen.. Thanks for pointing out this method. I’ve been playing with it ever since you mentioned in your previous newsletter. I’ve replaced stochs with %r (easier to monitor with a single signal line than two). Also, putting less focus on EMA20. This method is very solid when it comes to strongly trending markets. Personally, in the last week i’ve managed to enter on corrections to MSFT, ABBV and some other stocks. I’ve been backtesting this method on Ninjatrader (TP of 10%/SL of 2%). And it gives amazing results. Modifying the entries based on 2x the SL (where sl = lowest low of the past x # of bars) helps in reducing the holding period and building cash quickly.

    Didn’t have much success in forex though. All in all, a great share 🙂

    Reply
  2. Galen Woods says

    February 16, 2014 at 1:24 PM

    Hi John, great to hear from you. Glad to know that you are getting good results with this strategy. And thanks a lot for sharing your back-testing experience including the parameters for TP and SL. That’s very useful for other traders who might want to test drive this strategy.

    Reply

Leave a Reply Cancel reply

Your email address will not be published. Required fields are marked *


Search Trading Setups Review

Get a Free Course Chapter from Galen Woods' Day Trading With Price Action Course [PDF]

Plus, our latest trading guides and tips in right your inbox.

Recommended For You

4 Trading Strategies For The Trend Line Tactician

Impulse System Long Signal on KSS Weekly

Bull Flag Price Action Trading Guide

10 Quotes to Help You Trade Like Stoics

3 Key Trading Barriers and How to Overcome Them

Price Action Trading Tips from the Reminiscences of a Stock Operator

The 20-Period Moving Average As Your Only Day Trading Tool

Trading Course Banner

Trading Setups Review

  • About Us
  • Contact Us
  • Advertise With Us
  • Privacy Policy
  • Affiliate Disclaimer
  • Full Risk Disclosure

Learn More

  • Day Trading With Price Action Course
  • TSR Trading Guides
  • Trading Setups
  • Trading Articles
  • Trading Books
  • Site Map

Futures and forex trading contains substantial risk and is not for every investor. An investor could potentially lose all or more than the initial investment. Risk capital is money that can be lost without jeopardizing ones financial security or life style. Only risk capital should be used for trading and only those with sufficient risk capital should consider trading. Past performance is not necessarily indicative of future results.


The website contents are only for educational purposes. All trades are random examples selected to present the trading setups and are not real trades. All trademarks belong to their respective owners. We are not registered with any regulating body that allows us to give financial and investment advice.


Trading Setups Review © 2012–2021