This website or its third-party tools use cookies which are necessary to its functioning and required to improve your experience. By clicking the consent button, you agree to allow the site to use, collect and/or store cookies.
Please click the consent button to view this website.
I accept
Deny cookies Go Back
  • Price Action Trading Course – 50% Off Ends 29 June
  • Trading Setups
  • Topics ↓
    • Price Action Trading
    • Day Trading
    • Trader Development
    • Site Map
  • Trading Resources
    • TSR Trading Guides
    • Trading Journal Software
    • Our Partners
    • Support Us
  • Member Login

Trading Setups Review

Trading Strategies, Guides, and Articles for Active Technical Traders

Forex Tester 5 - Software for traders by traders
You are here: Home / Trading Setups / How to Use the Relative Strength Indicator (RSI) for Day Trading

How to Use the Relative Strength Indicator (RSI) for Day Trading

By Galen Woods in Trading Setups on April 3, 2015

J. Welles Wilder is a giant in the field of technical analysis. In “New Concepts in Technical Trading Systems”, he introduced an array of trading indicators. Now, these indicators are among the most popular. And one of them is the Relative Strength Indicator (RSI).

The default RSI setting of 14 periods work well for swing traders. But many intraday traders find it lacking, because it produces infrequent trading signals.

Some traders deal with this problem by lowering their time-frame. Others lower the RSI period setting to get a more sensitive oscillator. However, these solutions produce RSI signals that are more unreliable.

Getting infrequent trades is not always a problem for day trading. That is if the few trading setups that show up are high-quality ones.

In this article, you will learn a simple method to find quality day trades.

The idea is to combine the default 14-period RSI with support/resistance zones. Our aim is to find intraday reversal setups with a high reward-to-risk ratio.

Trading Rules – Day Trading with the RSI

Long Day Trade

  1. 14-period RSI is below 30. (oversold)
  2. Price is testing a support zone.
  3. Buy above any bullish price bar.

Short Day Trade

  1. 14-period RSI is above 70. (overbought)
  2. Price is testing a resistance zone.
  3. Sell below any bearish price bar.

Examples – Day Trading with the RSI

Areas of congestion are useful for finding support and resistance zones. In the examples, I used the Congestion Zone indicator from my price action course.

(Trading sessions are separated by the black vertical lines.)

Winning Trade

RSI Day Trading Winning Example

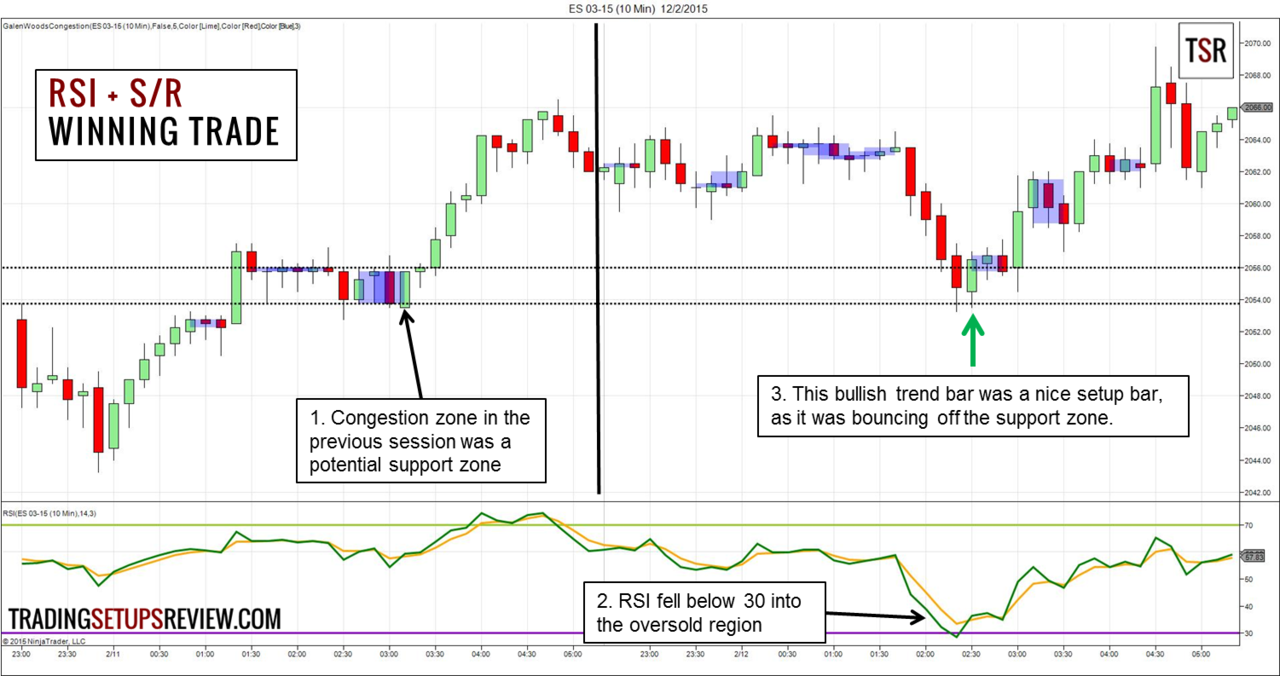
This is a 10-minute chart of the popular day trading market, S&P 500 E-mini (ES).

  1. The congestion zone from the previous session projected a potential support zone.
  2. The RSI fell below 30, prompting us to look for potential trades.
  3. As the RSI became oversold, ES found support and printed a nice bullish inside bar. We went long a tick above it and caught the low of the trading session.

Losing Trade

RSI Day Trading Losing Example

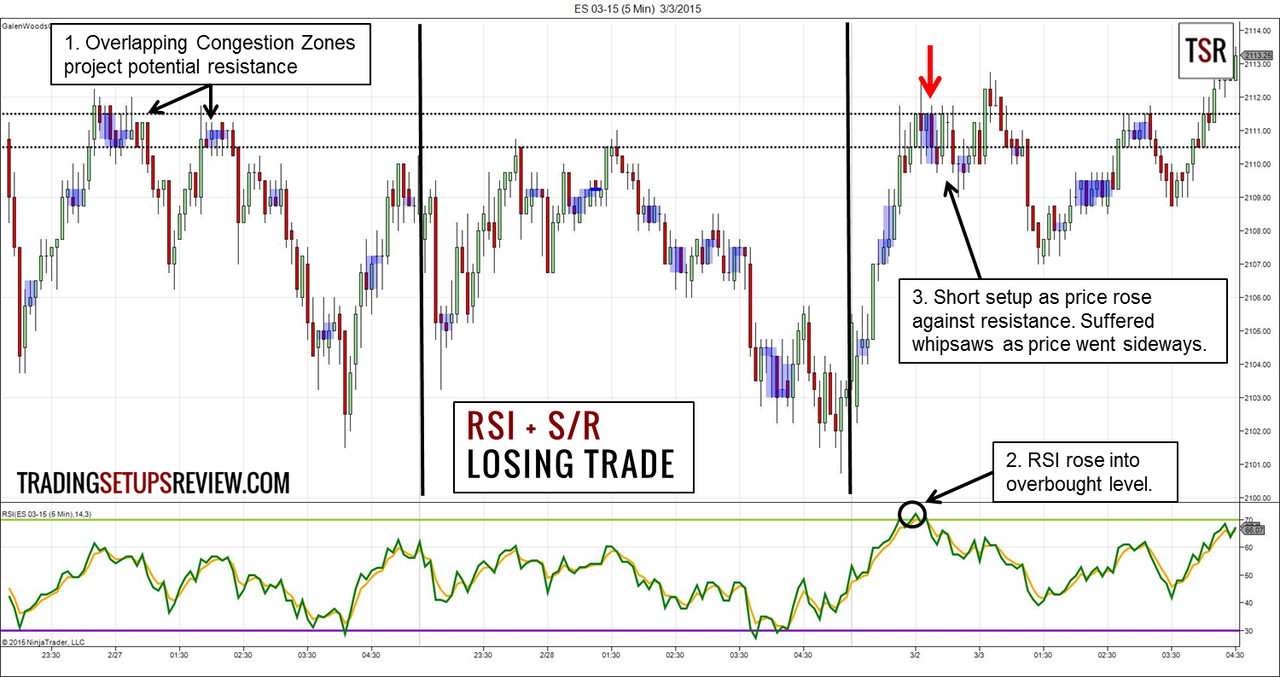
The 5-minute time-frame is another common choice among day traders.

  1. This congestion area from two sessions ago acted as resistance in the last session.
  2. RSI rose above 70 and became overbought.
  3. This overbought signal formed as the market rose into the resistance zone. We shorted below the first bearish bar formed in the zone.

This trade did not turn out well. After some whipsaws, the market fell by a short distance. Then, it rose and broke the resistance zone for good.

In this case, the resistance zone held the market down for a period. However, the timing of this trade was not ideal.

As long as the trade risk is under control, take such losses in stride.

Review – Day Trading with the RSI

The key of this trading setup is your assessment of support and resistance zones. Take into account the market structure and focus on the higher quality trading setups.

This strategy is suitable for traders who do not want to eyeball the chart. You can mark up support and resistance zones before the start of a trading session. Then, set up alerts for RSI overbought/oversold signals. When your alerts sound off, take a closer look to assess the quality of the trading setups.

If you still prefer a more sensitive indicator, try the 2-period RSI.

Day trading need not be an affair of rapid trades. By taking fewer trades, you have more time to analyze the larger picture. This is the merit of this RSI day trading strategy.

Read more about Day Trading, RSI, Trading Reversal

If Trading Setups Review has helped you trade better, please support us on Ko-fi.

Support me on Ko-fi

Thank you for being awesome.

You can also check out other ways to support us here.

Or, please continue exploring what we have to offer…

Volume-Weighted Moving Average (VWMA) – A Simple Volume Tool

5 Bollinger Bands Trading Strategies You Should Know

3 Useful Tips for Intraday Price Action Trading

Trading Pullbacks Using Trend Lines and Price Channels

How To Increase Your Trading Profits by 3729% And Cut Commissions by 80%

Comments

  1. Michael says

    October 14, 2016 at 10:00 PM

    Hi i tried your 20 EMA strategy and it worked perfectly, Thanks guys. i want to ask if i need any indicator to filter this strategy?

    Reply
    • Galen Woods says

      October 16, 2016 at 10:41 AM

      Price action will be a nice filter. Try looking for setups that have the support of chart patterns.

      Reply
    • lalit nama says

      September 8, 2019 at 11:19 PM

      what setup 20 ema use.

      Reply
  2. ray says

    March 16, 2017 at 2:49 AM

    Ive read the length being referred to as both days and periods so I’m trying to determine which one it is. Meaning, if I look at a daily chart the RSI is one number, if I look at it on an intraday day chart the RSI is another number for the same security. Does the length adjust to what ever the chart setting is? In the case of a 1 day 5 min chart would it view each 5 min period as period to make up the length of 14? I cant seem to find decisive clarity on this. Thanks!

    Reply
    • Galen Woods says

      March 18, 2017 at 8:59 PM

      Basically, a period is the time duration 1 bar (candlestick) on your chart represents. Period is the general term. A period can be a day, an hour, or minutes etc, depending on your chart.

      In a chart with each bar representing 5 min, 1 period is 5 min. So yes, each 5 min is a period and your RSI period setting should stay at 14.

      Normally, you can use the same indicator period setting regardless of your time frame. However, some traders find it useful to vary the setting. You can read more about indicators settings here.

      Reply
  3. Robert says

    February 14, 2018 at 10:09 PM

    I like the idea of using the RSI but never really understood it.
    Thanks for this. It explains a lot.
    And also a bonus using the S & R lines.

    Reply
    • Galen Woods says

      February 16, 2018 at 9:05 AM

      Glad to hear that! For best results, all indicators should be used in conjunction with price action analysis.

      Reply
  4. Uneek says

    August 5, 2018 at 11:57 PM

    What is 14 period in rsi calculation

    Reply
    • Galen Woods says

      August 6, 2018 at 9:27 AM

      Hi Uneek, this article provides an excellent explanation of the technical calculation of RSI using 14-period as an example. Take a look!

      Reply
  5. ELOGE says

    October 29, 2019 at 2:30 AM

    Would that make sense to find congestion zones using BOLLINGER BAND ?

    Reply
    • Galen Woods says

      October 30, 2019 at 9:29 AM

      Yes, you can definitely design your own rules to identify congestion areas using Bollinger Bands. The Bandwidth should be helpful. But the identified zones might be different from those shown in this article.

      For the benefit of my course students, in the articles on TSR, I usually use the congestion zone concept taught in my course.

      Reply
  6. Onans says

    January 16, 2021 at 5:50 AM

    What a great explanation! Thanks. However, can I draw the S & R zones in higher time frame and trade in a lower time frame?

    Reply
    • Galen Woods says

      January 22, 2021 at 9:48 AM

      Glad you like it! You can certainly explore that approach but I tend to stick to a single time frame.

      Reply

Leave a Reply Cancel reply

Your email address will not be published. Required fields are marked *

Trading Course Banner

Search Trading Setups Review

Recommended For You

Capture High Profits with Low Volume Pullback Trading Strategy

The Renko Chart Trading Manual

Harami Candlestick Reversal Trading Strategy

Moving Average Fake-Out

Price Action Trading Primer

Jjrvat’s Price Action Trading Approach

Inside Day NR4 (ID/NR4) Pattern Trading Guide

Top Trading Books

Top 10 Volume Trading Books

7 Forex Trading Books To Get You Started

18 Trading Psychology Books To Help You Trade Better

Top 10 Price Action Trading Books

7 Trading Books For Your Library


If Trading Setups Review has helped you trade better, please consider supporting us on Ko-fi.

Support me on Ko-fi

Or, check out other ways to support us here.

Thank you for being awesome.


Get a Free Course Chapter from Galen Woods' Day Trading With Price Action Course [PDF]

Plus, our latest trading guides and tips in right your inbox.

Trading Setups Review

  • Support Us
  • Contact Us
  • About Us
  • Privacy Policy
  • Affiliate Disclaimer
  • Full Risk Disclosure

Learn More

  • Day Trading With Price Action Course
  • TSR Trading Guides
  • Trading Setups
  • Trading Articles
  • Trading Books
  • Site Map

Futures and forex trading contains substantial risk and is not for every investor. An investor could potentially lose all or more than the initial investment. Risk capital is money that can be lost without jeopardizing ones financial security or life style. Only risk capital should be used for trading and only those with sufficient risk capital should consider trading. Past performance is not necessarily indicative of future results.


The website contents are only for educational purposes. All trades are random examples selected to present the trading setups and are not real trades. All trademarks belong to their respective owners. We are not registered with any regulating body that allows us to give financial and investment advice.


Trading Setups Review © 2012–2022

Anti-Climax Pattern - Free Course Chapter

Learn a new powerful price pattern today!

Download for free now.