The Golden Cross Moving Average Strategy For Price Action Traders
By Galen Woods ‐ 8 min read
The Golden Cross strategy combines two moving averages. While the crossover signal is helpful, price action traders should focus more on the macro picture.
The Golden Cross is a prominent moving average signal that both technical and fundamental analysts are familiar with. Its bearish counterpart has an equally gripping label: Death Cross. While these names sound melodramatic, they do offer substantial value for sensible traders.
In this tutorial, you’ll learn how to exploit the Golden Cross setup for price action trading.
In our approach, we are discarding the Golden Cross signal in favor of a Golden Cross framework.
Read on, and you’ll learn what this means.
Note: This tutorial focuses on the Golden Cross for simplicity. But the principles discussed apply to the Death Cross as well.
What is the Golden Cross?
If this is the first time you hear about the Golden Cross, don’t fret. It is an easy idea to grasp, and here is a short primer.
The basic setup of the Golden Cross combines two moving averages:
- An intermediate-term moving average
- A long-term moving average
The prevailing lookback period for the moving averages are 50-period and 200-period.
The Golden Cross is simply the bullish crossover of these two moving averages. (i.e., when the 50-period moving average crosses above the 200-period moving average.)

The Golden Cross shown in the chart above worked well as a buy signal.
But as you will see, a price action trader should focus less on using the Golden Cross as a buy signal.
Are the moving average settings fixed?
The parameters are not cast in stone so you can vary them.
However, for our purpose, two principles must apply:
- Both moving averages must be distant from the effects of short-term price action. (Avoid short-term moving averages that tend to be very responsive to price changes.)
- There must be a substantial difference between the two moving averages. (E.g., 50 vs. 200 is okay, but 180 vs. 200 will not work well.)
For a valid Golden Cross approach, these two principles are essential.
They ensure two critical behaviors that contribute to useful market analysis.
- The Golden Cross is grounded by long term price action.
- The interaction between the two moving averages offers meaningful analysis.
Should You Use SMA or EMA For The Golden Cross?
For the Golden Cross, you will see some traders using simple moving averages (SMA). And others might use exponential moving averages (EMA).
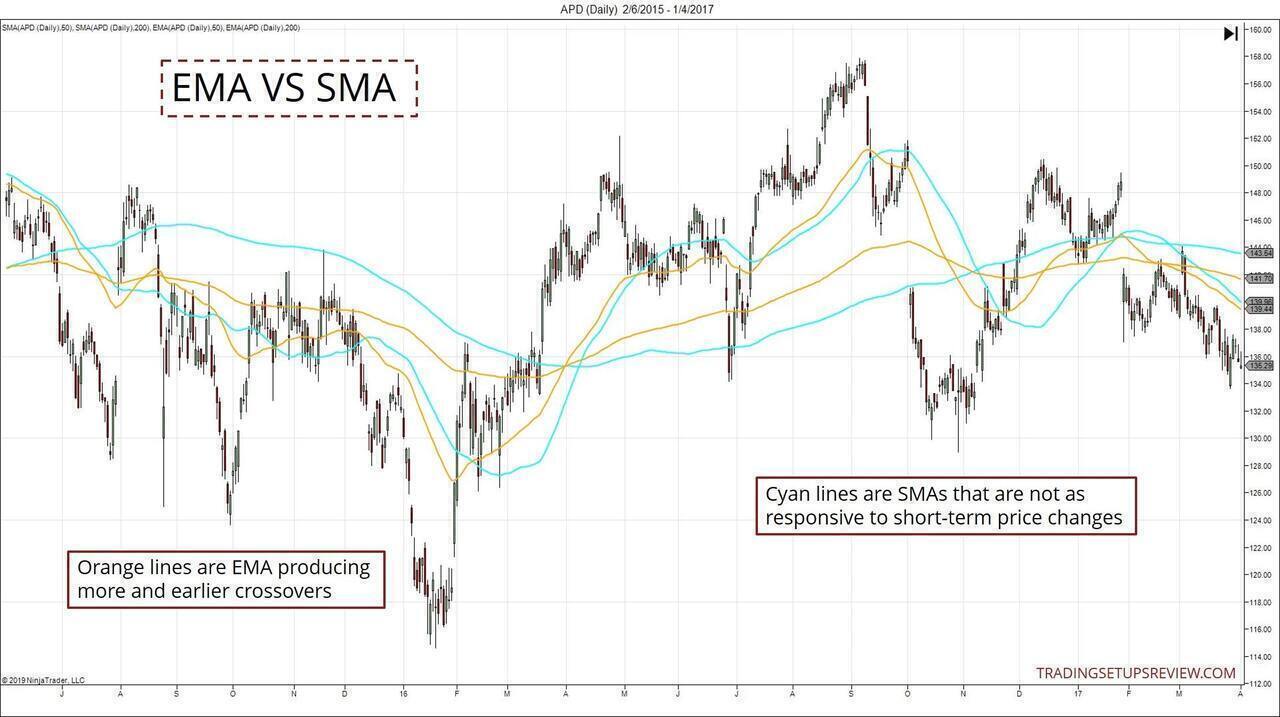
Some traders gravitate towards the EMA because it is more responsive to price action. And for many applications, they are right to do that.
However, here, we aim to focus on the more stable signals for macro analysis. Hence, the responsiveness of the moving average is not critical. In fact, if the moving averages are too responsive to short term prices, it may be harder to interpret the long term bias.
Hence, we will be using the SMA in this tutorial.
After all, we want to set up the Golden Cross as a framework for macro analysis. We are not looking to trade the Golden Cross signals. Hence, responsiveness to recent price action is not a plus for us.
Nonetheless, in practice, as long as you:
- Perform sound price action analysis; and
- Do not rely entirely on the Golden Cross signals;
Using EMA is acceptable.
Above all, consistency is vital for ensuring that you get used to interpreting one type of moving average. So pick one and stick to it.
Golden Cross Framework Price Action Guidelines
For a price action trader, there is a common problem when it comes to using moving averages. They distract you from price action.
To mitigate this problem, let’s set a few ground rules.
First, forget about using the moving averages as support and resistance. If you focus on finding moving average bounces, you will end up trading the moving average. This is a problem because what you really want is to trade price action.
Second, do not focus on the crossover signals.
The fact that a Golden Cross has occurred is relevant for our analysis, but you should not rely on it as an entry signal. The exact point where the Golden Cross form has no direct relation to the current price action. Hence, use price action patterns instead to find low-risk entries.
Third, when in doubt about the market bias, rely on price action analysis. (Refer to the example in the next section.)
Distinguishing Market Phases With The Golden Cross
The ability to recognize market phases is critical for price action traders.
To see how you can leverage the Golden Cross set up for macro analysis, look at the charts below.
Trending Phase
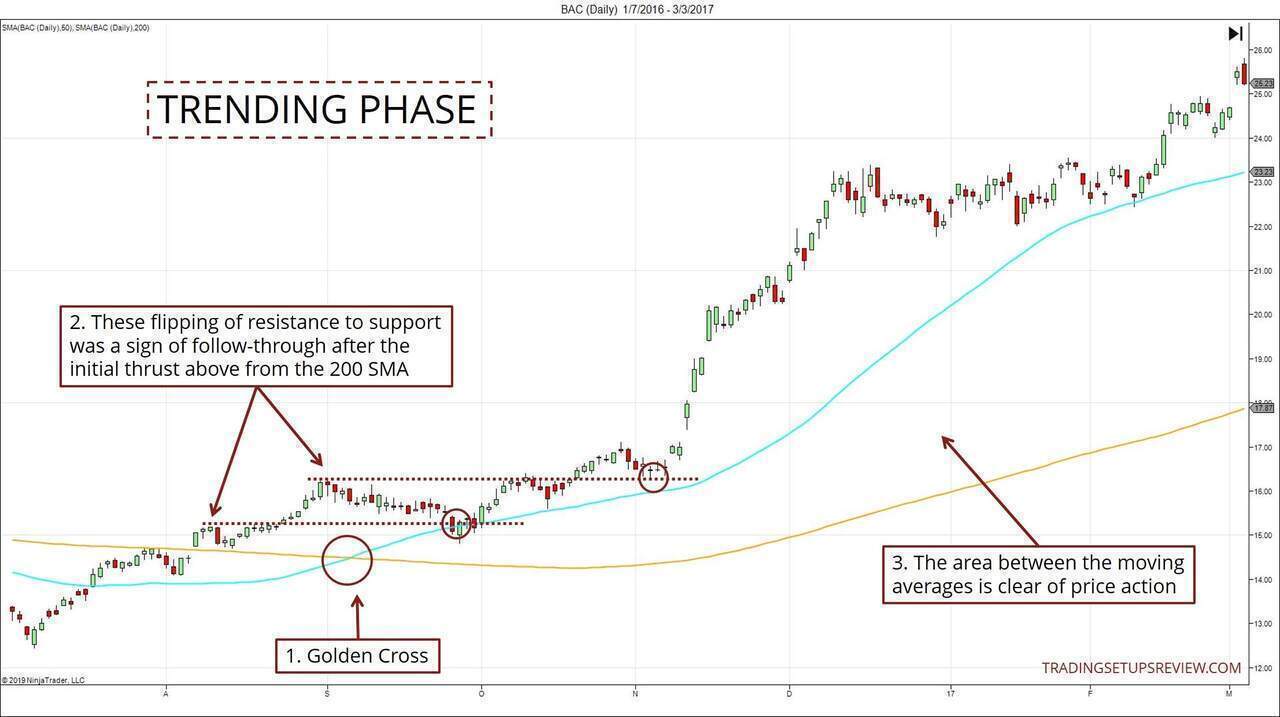
- The Golden Cross serves as a signal for us to watch out for the development of a bullish bias.
- Two consecutive trend extremes were broken as resistance, before flipping to support the market. Market structure supported a bullish premise as hinted by the Golden Cross. (You might’ve overlooked the first flip if you focused on the 200 MA bounce.)
- The increasing gap between the two moving averages highlighted the momentum of the rising market.
Meandering Phase
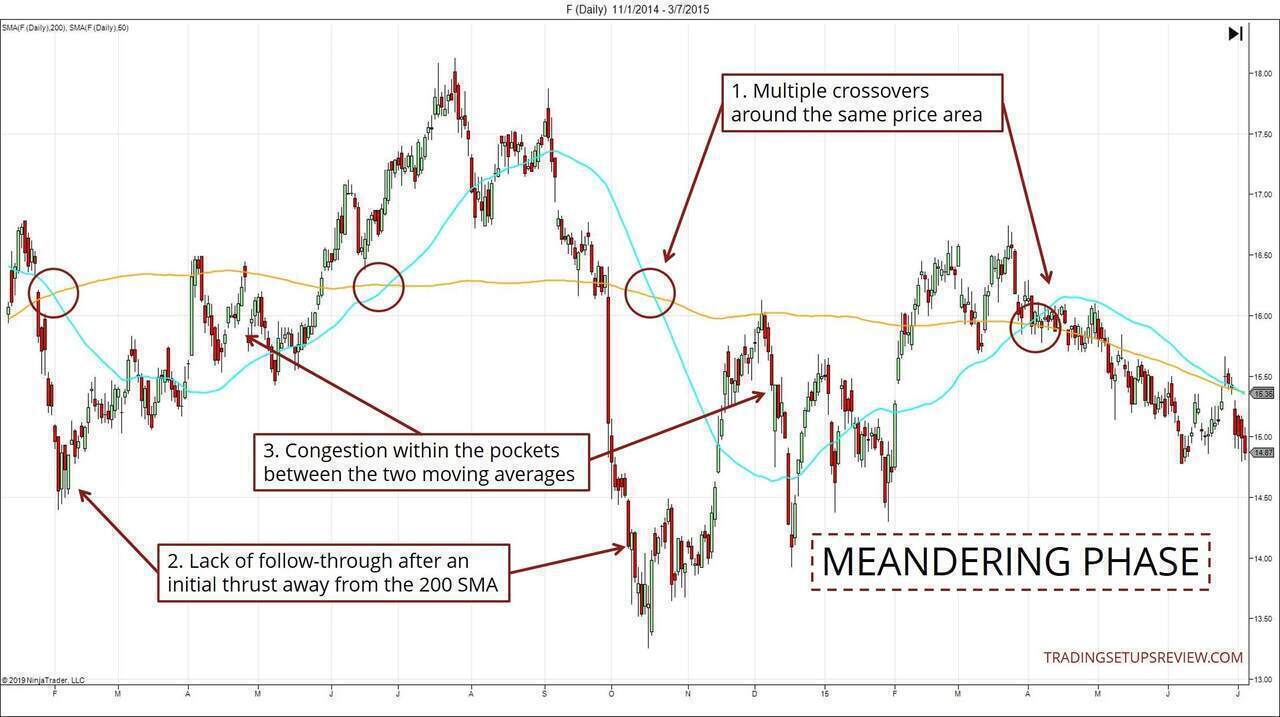
The meandering phase is characterized by:
- Consecutive crossovers (both Golden Cross and Death Cross) around the same price level
- Lack of follow-through after an initial thrust away from the 200 SMA
- Congested price action between the two moving averages
Trading Examples
This is a discretionary analytical approach, so more examples will help. Let’s go through two more examples.
Through them, you’ll see how you can analyze the market using the Golden Cross as a starting point.
Example #1 - Stock Swing Trading Example (MCD)
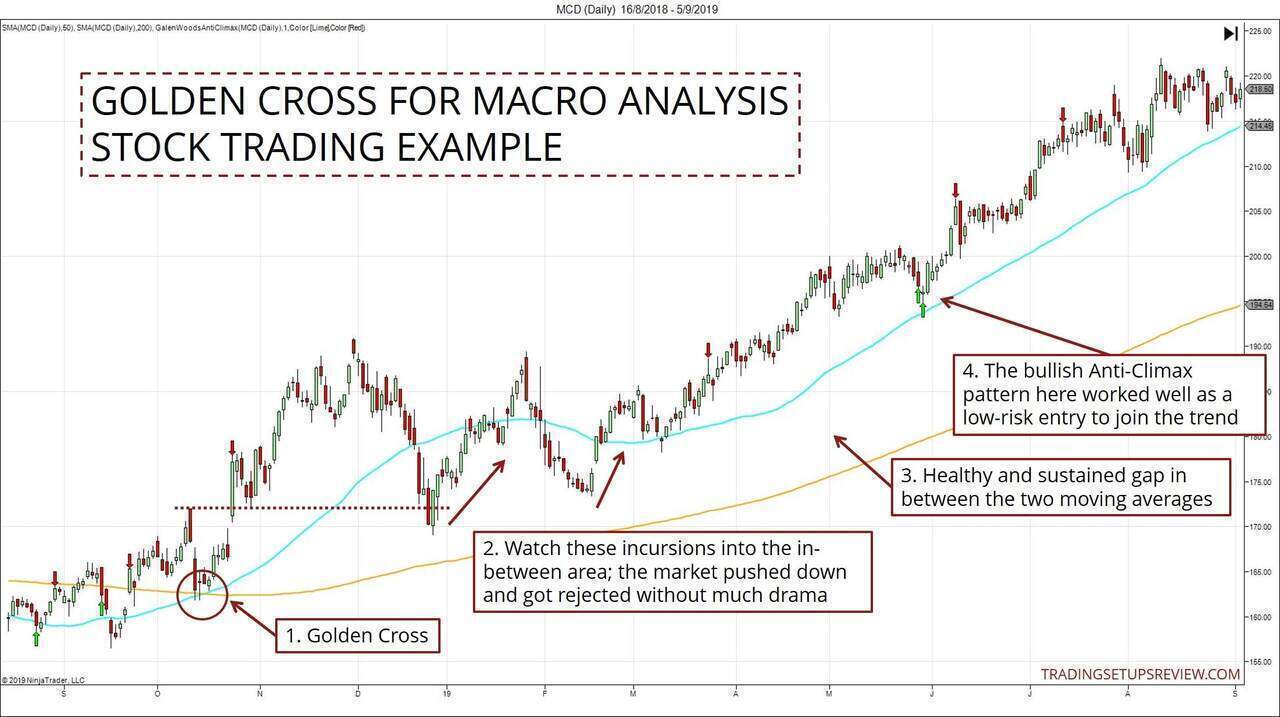
- A Golden Cross signaled the possible start of a bullish trend.
- Look at these incursions below the 50 SMA. The market rejected them without much struggle. Compare these to those in the “Meandering Phase” chart above. You’ll notice that there are more overlapping price bars within the in-between zone.
- A healthy gap between the two moving averages was sustained after the Golden Cross signal. It was a sign of bullish momentum in the trend.
- We are not looking to enter the market with the Golden Cross signal. Instead, we use price action patterns as trade entries. These consecutive bullish Anti-Climax patterns (green arrows) worked well here.
(Learn more about the Anti-Climax pattern in this free chapter, or through this Udemy course.)
Example #2 - Forex Hourly Trading Example (USDCHF)
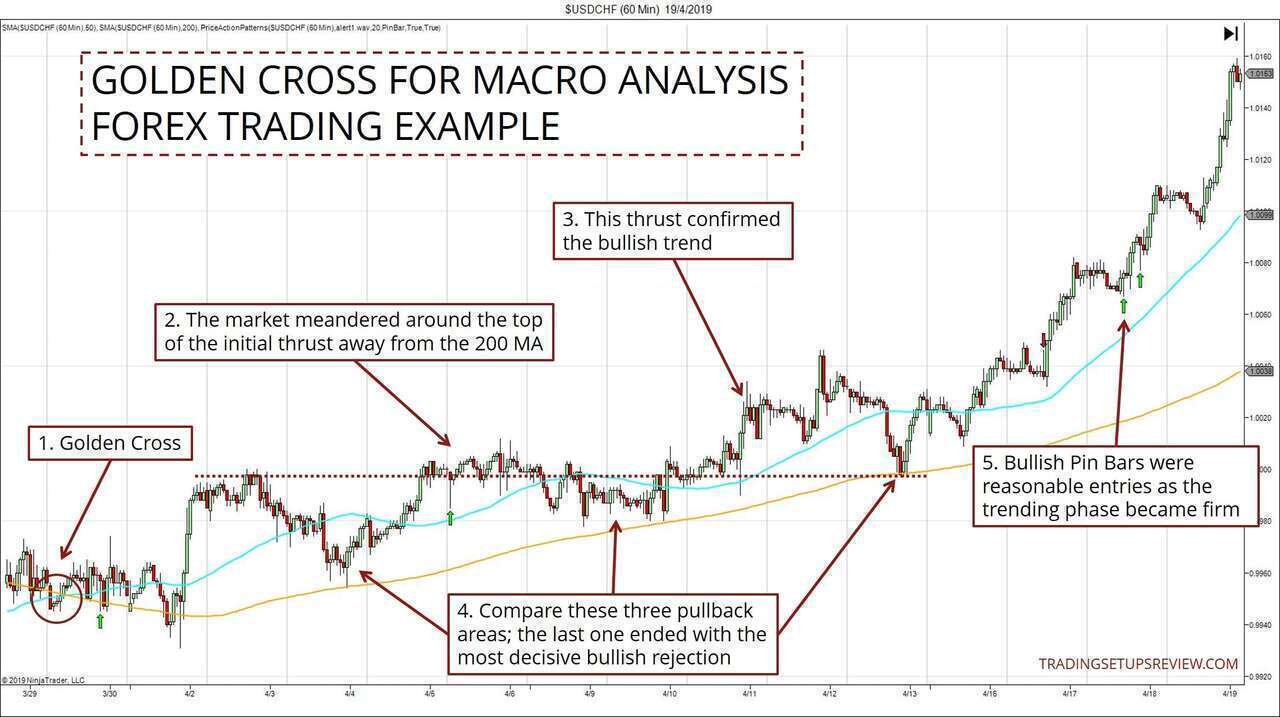
- Golden Cross formed here, but the price action that followed was lackadaisical.
- The dotted line marked out the top of the initial thrust above and away from the 200 SMA. The clearing of this price level is critical to confirming a trending phase. However, the market meandered around this level. (Nonetheless, this market held our interest because the 50 SMA stayed a healthy distance above the 200 SMA.)
- This bullish thrust brought the market away from the sideways consolidation. A bullish trend was affirmed.
- Examine these three pullback regions between the moving averages. The first two saw significant sideways action. But the last pullback was rejected decisively. You could tell this from the sharp bullish reversal that ended the pullback.* It further confirmed the bull trend.
- Since the bullish trend was established, we started looking for price action pattern entries. These long Pin Bar setups were reasonable candidates.
*Noticed the bounce from the 200 MA? Don’t overlook that it was also a bounce off the previous consolidation area. On top of that, the swift manner it ricocheted was just as important.
These are vital price action observations. And you could’ve easily missed them if your sole focus is on the moving averages.
Golden Cross Stock Scanner
The Golden Cross serves as a signal for us to consider a change of market phase. Hence, it’s beneficial to be able to scan for Golden Crosses across the vast universe of stocks.
Ideally, you should set up a scan in your charting platform for seamless analysis.
But if you want a handy list of the latest stocks that presented a Golden Cross, here are some options:
- Yahoo Finance Golden Cross List
- Stock Monitor Golden Cross Filter
- Trade-Ideas Golden Cross Stock Screen (This screen does not track actual crossovers. Instead, it factors in volatility to find stocks that are likely to cross over soon.)
Price Action Trading Tips For Using The Golden Cross
The Golden Cross is valuable as an early signal of a change in the market’s long-term bias.
Once the market enters the trending phase, there are many low-risk trading opportunities. However, it is not uncommon for the market to stay in the meandering phase for a prolonged period. This is why it’s essential to be patient.
The Golden Cross signal is not ideal for traders looking to minimize their risk for quick trades. But for investors who rely on fundamental analysis, Golden Crosses are useful entry triggers.
For these long-term traders, the exact entry point is not critical. All they need is a signal that the technical bias has aligned with their bullish fundamental outlook. And that is what the Golden Cross provides.
Finally, I want to highlight an important learning point. It’s possible to take on a price action perspective, even when using an indicator strategy.
This tutorial demonstrated this approach for the Golden Cross. But you can do this for most trading methods.
Instead of rejecting indicators, focus on anchoring your analysis with price action. This way, you can always consider how to use indicators to augment your price analysis.
Of course, you must have ground rules to avoid being distracted by the indicator signals.
Enjoy analyzing price action with moving averages? Check out these articles: