MACD Basic Trading Setup (With 6 Detailed Examples)
By Galen Woods ‐ 9 min read
The MACD indicator is helpful for clarifying both trend and momentum. Learn how to use the MACD with a basic approach from its inventor, Gerald Appel.
Gerald Appel’s Moving Average Convergence Divergence (MACD) is a standard indicator that you’ll find in every technical analysis package. While there are many sophisticated MACD trading strategies, it’s best to start with a basic approach.
In this tutorial, you’ll learn to appreciate how the MACD works by examining a basic MACD trade strategy Gerald Appel explained in his book - Technical Analysis: Power Tools For Power Investors.
But before that, let’s go through a short primer on the MACD indicator.
What is the MACD Indicator?
To know what the MACD indicator is, start by observing how moving averages work.
The critical problem with moving averages is that they lag behind price action. And the higher the lookback period, the more significant the lag. (e.g., The 200-period EMA lags more than the 50-period EMA.)
The MACD is an ingenious invention because it turns this disadvantage of moving averages into a practical trading tactic.
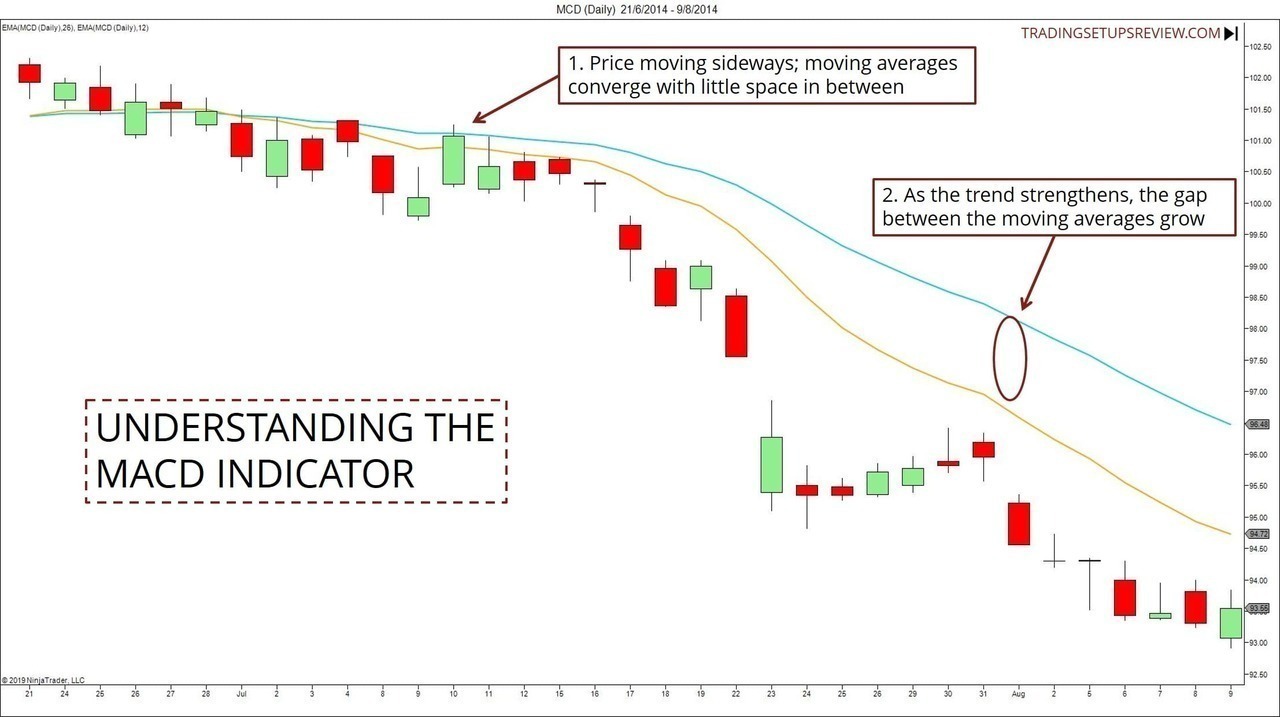
As a trend strengthens, a more sensitive moving average with a lower lookback period will track price action more closely. A moving average with a higher lookback period tends to lag behind the trending price action.
The result is the divergence of these two moving averages.
Of course, in the opposite scenario, as a trend weakens, the two moving averages will converge.
So if you want to track the momentum of a trend, what do you measure?
Yup, the difference between the two moving averages. This is what the MACD indicator does.
First, the MACD Line plots this difference. Then, it adds a Signal Line, which is a moving average of the MACD Line.
By focusing on the distance between two moving averages, you can get reversal signals earlier than the usual moving average crossovers.
Based on the MACD’s default settings, this is how you can construct the MACD Line and the Signal Line.
- MACD Line = 12-day EMA - 26-day EMA
- Signal Line = 9-day EMA of MACD Line
Of course, your charting platform will do the heavy lifting for you.
As long as you understand the intuition behind the MACD indicator, we’re good to go.
Trading Rules - MACD Basic Setup
In Gerald Appel’s book, he stated supplementary rules for more conservative setups. In this tutorial, we will include these rules.
MACD Settings
Use the default MACD settings.
- Fast: 12
- Slow: 26
- Smooth: 9
Long trade setup
- MACD crosses below the Signal Line (supplementary rule)
- MACD crosses below the Zero Line (supplementary rule)
- Buy when MACD crosses above its Signal Line
Short trade setup
- MACD crosses above the Signal Line (supplementary rule)
- MACD crosses above the Zero Line (supplementary rule)
- Sell when MACD crosses below its Signal Line
MACD Basic Trading Setup Examples
The best way to learn how to apply a trading tool is through analyzing examples.
Hence, the examples in this section will not just show you entry points using the MACD. They will also distill broader lessons to help you apply the MACD indicator with more significant insights.
Example #1: Deep Pullback
This is a textbook example of the MACD basic setup. It showcases its power in a trending market.
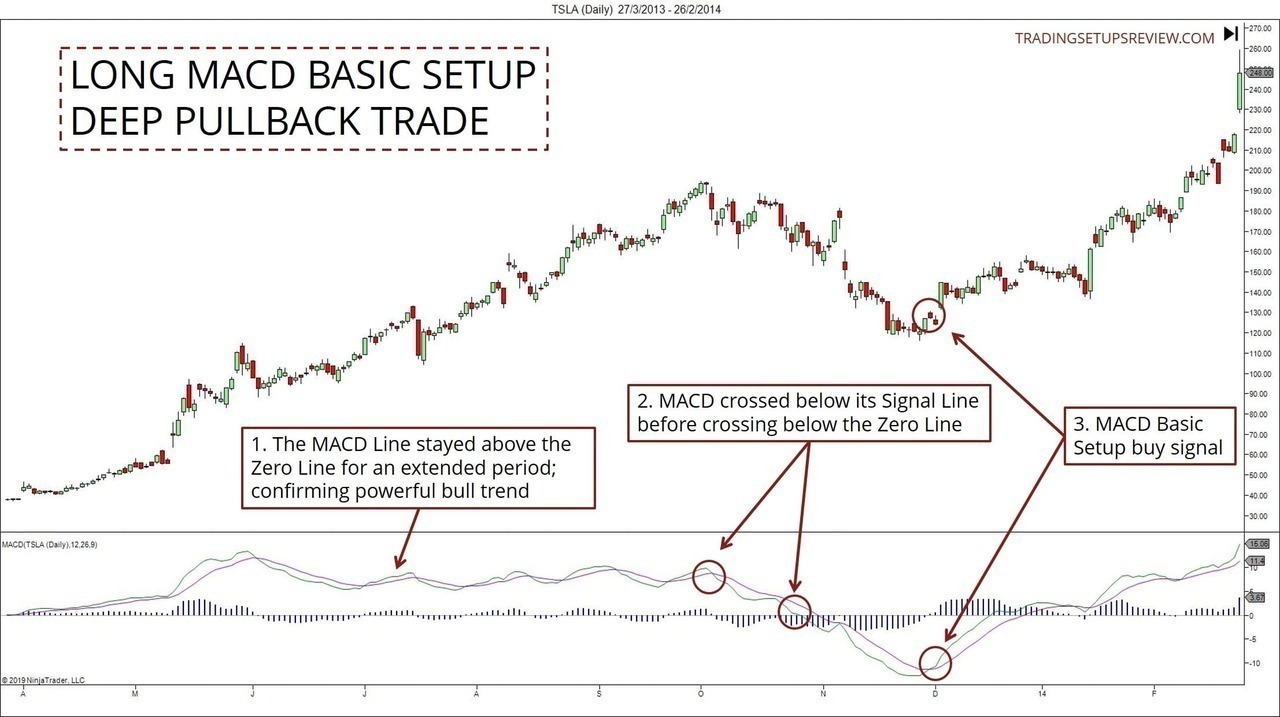
- Note that the MACD Line stayed above zero for a prolonged period. The market was in a solid bull run.
- The MACD first crossed below its Signal Line before falling below zero. These two points fulfilled the supplementary rules of the MACD Basic Trading Setup and hinted at the development of a deep pullback or potential reversal.
- The MACD Line rose above its Signal Line and fired a buy signal.
A common problem with MACD trade signals is their lag time, especially when price spikes.
However, in this case, the market moved sideways for around a week before resuming the trend. When the market behaves this way, it allows the MACD indicator to catch up. Hence, the lag time of the MACD signal here was minimal.
As with any trading strategy, you can pick perfect examples from the historical charts.
Examples like the one we just saw are great for educational purposes. However, do not expect all real setups to look like this.
Example #2: Wedge Trade
This is a daily chart of Suncor Energy Inc listed on the Toronto Stock Exchange.
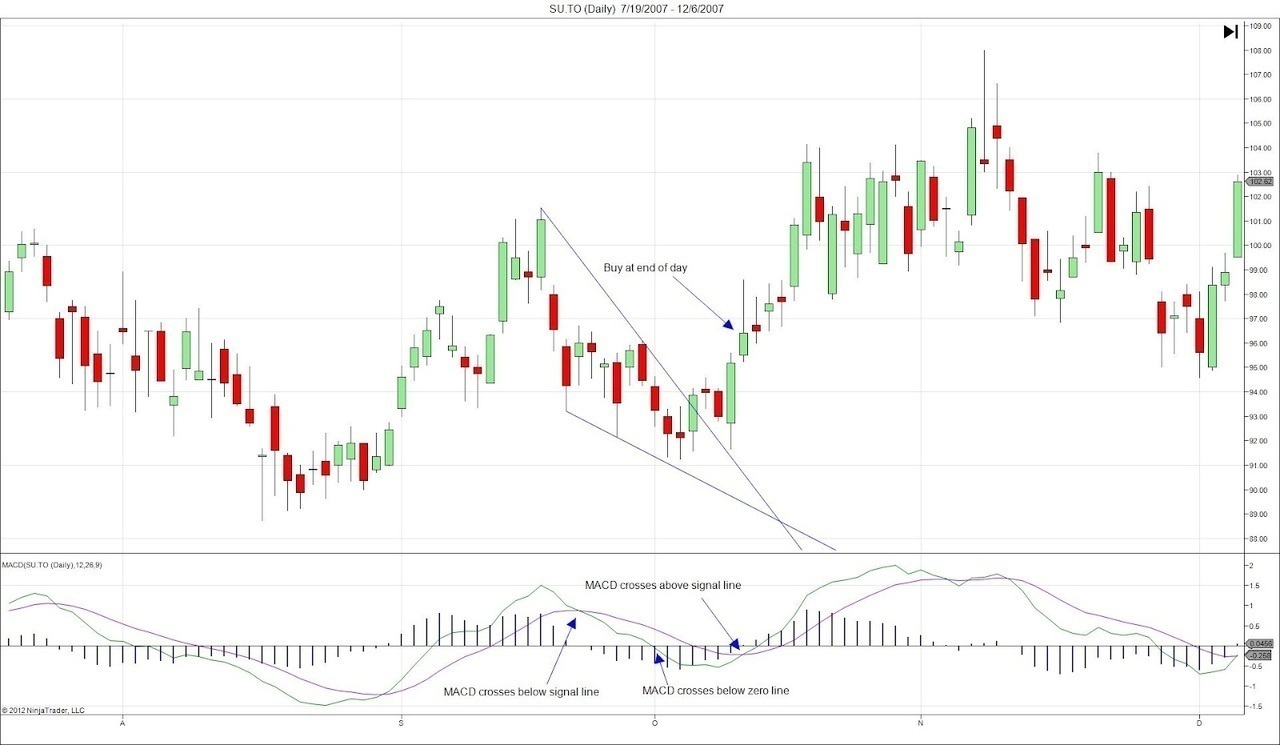
- We observed a sell signal, which was the MACD crossing below its Signal Line. The MACD continued to move below the Zero Line, indicating that the stock was oversold.
- Hence, we bought once the MACD crosses above its Signal Line. Prices continued to move up almost 12% over the next month. (The MACD gave a desirable exit signal here too. One option is to place a trailing stop below the low of each day after a MACD sell signal.)
This trade setup looked good for two reasons:
- Bullish outside reversal bar right before our entry bar
- Wedge pattern
The wedge pattern had an upside breakout. More importantly, it followed by a pullback that ended with that bullish outside bar.
In this example, the wedge pattern breakout offered an earlier signal than the MACD.
Example #3: MACD With Gap Support
As with most trading indicators, you should not use the MACD alone. A sound approach is to combine MACD signals with price action tactics.
In this example, you’ll see how this MACD trading signal enjoyed the support from a previous price gap.
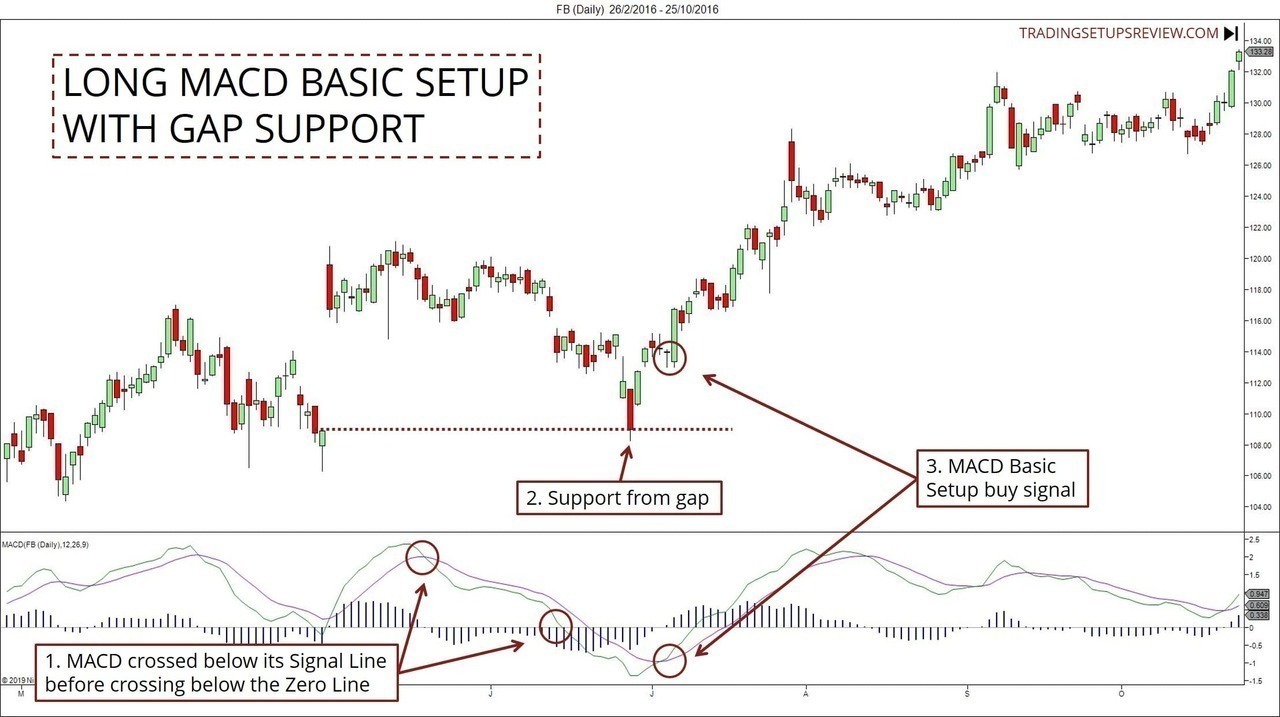
- The supplementary criteria were met here. The fall below the Zero Line confirmed that the market was in a technically oversold position.
- The market tends to fill gaps before resuming a trend. Hence, gaps are potential support zones. Here, shortly before the MACD issued a buy signal, we saw clear support from the filled gap. (This test of the gap support also formed an Anti-climax pattern.)
- The bullish crossover of the MACD Line fired a long signal. It served as bullish confirmation for the earlier bounce from the gap support zone.
There are two key lessons from this example.
First, you can use the MACD trade signal to confirm a price action formation (in this case the gap support bounce) and vice versa.
Second, you can try to find earlier entries with price action analysis once the MACD crosses the Zero Line. Primarily, you rely on the MACD to find oversold markets but not for your exact trade trigger. For a price action trader, this nimbler approach can result in a better entry point.
Example #4: Conservative & Aggressive Trades
What difference do the supplementary rules make?
This example answers this question. But in a nutshell, if you exclude the supplementary rules, you are taking more aggressive trading setups.
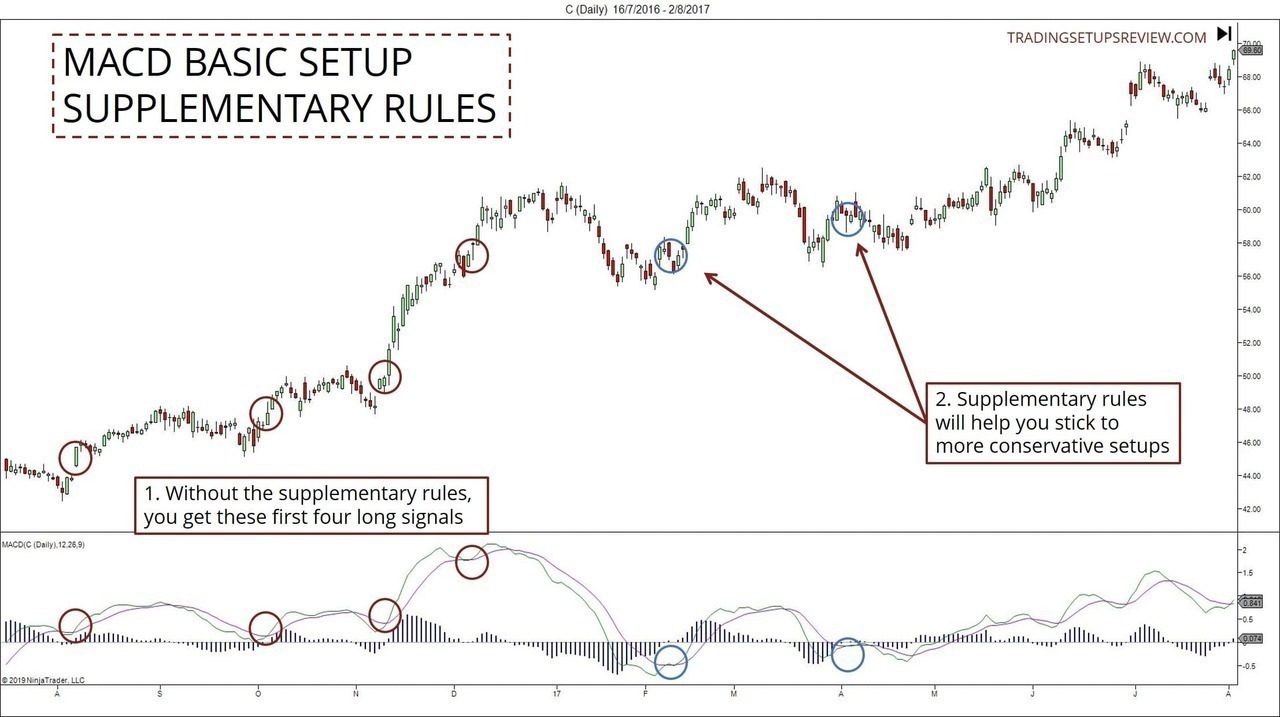
- The first four signals are valid if you ignore the supplementary trading rules. These are entry signals that follow shallow pullbacks in a strong trend.
- However, if you stick to the supplementary rules, only these two MACD buy signals are valid. These are long signals that follow deeper multi-legged pullbacks.
The supplementary rules help you identify more conservative entry points which occur with low frequency.
When do you look for aggressive entries?
When do you look for conservative setups? Is it always better to stay conservative?
Apply this rule of thumb.
- High confidence in the market bias - look for aggressive entries
- Uncertain of the market bias - look for conservative entries
Example #5: Position Trading (Weekly Bars)
The MACD indicator is a useful tool for position trading.
By switching to a weekly chart, you can quickly adapt it for long-term trading and for timing your investments.
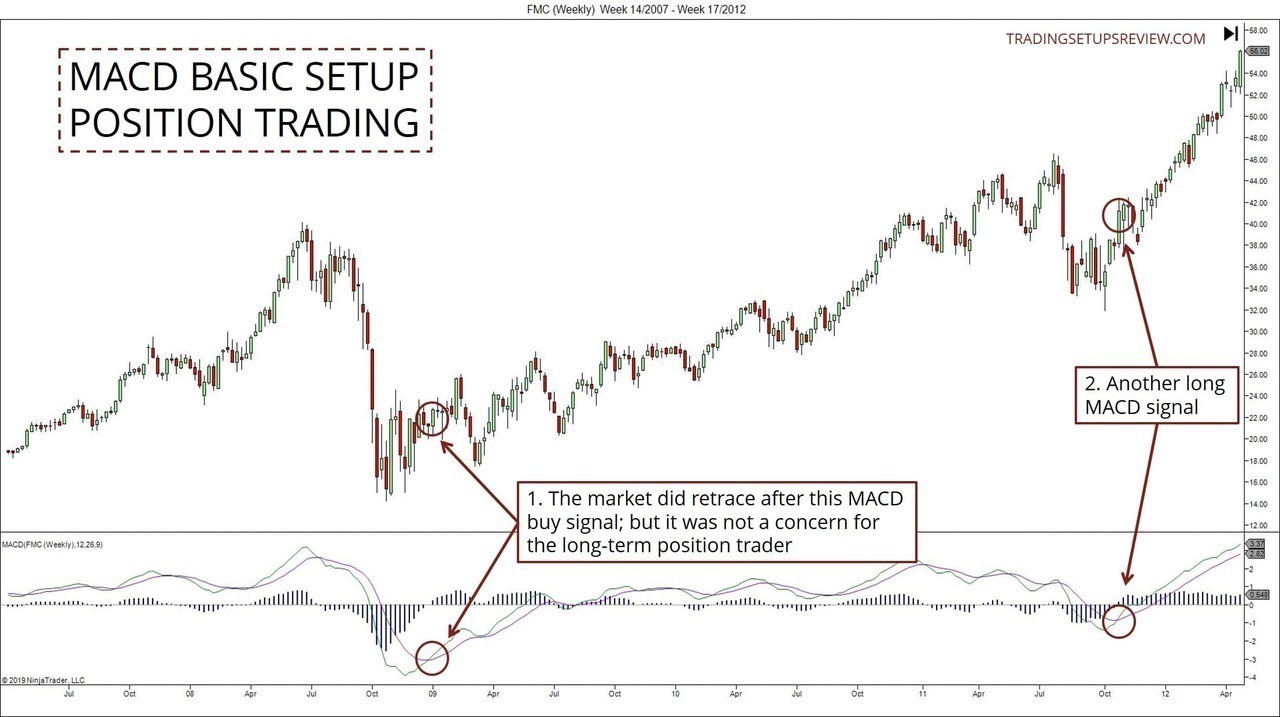
The chart above shows two MACD buy signals.
The first signal got the trader into a position that benefitted from the recovery after the 2008 crash. The signal did not come at the bottom of the crash, and that’s fine. Expecting to catch the absolute bottom of a crash is unrealistic.
However, for any trader who thought that the worst was over, the MACD offered an objective signal to start accumulating a long position.
While the market retraced down after the first signal, it was not a concern for position traders. These long-term traders are aiming for a bull run over a long horizon. Hence, they can allow more whipsaws around their entry price and still enjoy a healthy reward-to-risk ratio.
Example #6: Losing Trade
In real trading, you will encounter losing trades. So we should not avoid them in our learning process.
This chart shows a losing trade for the EUR/USD currency pair.
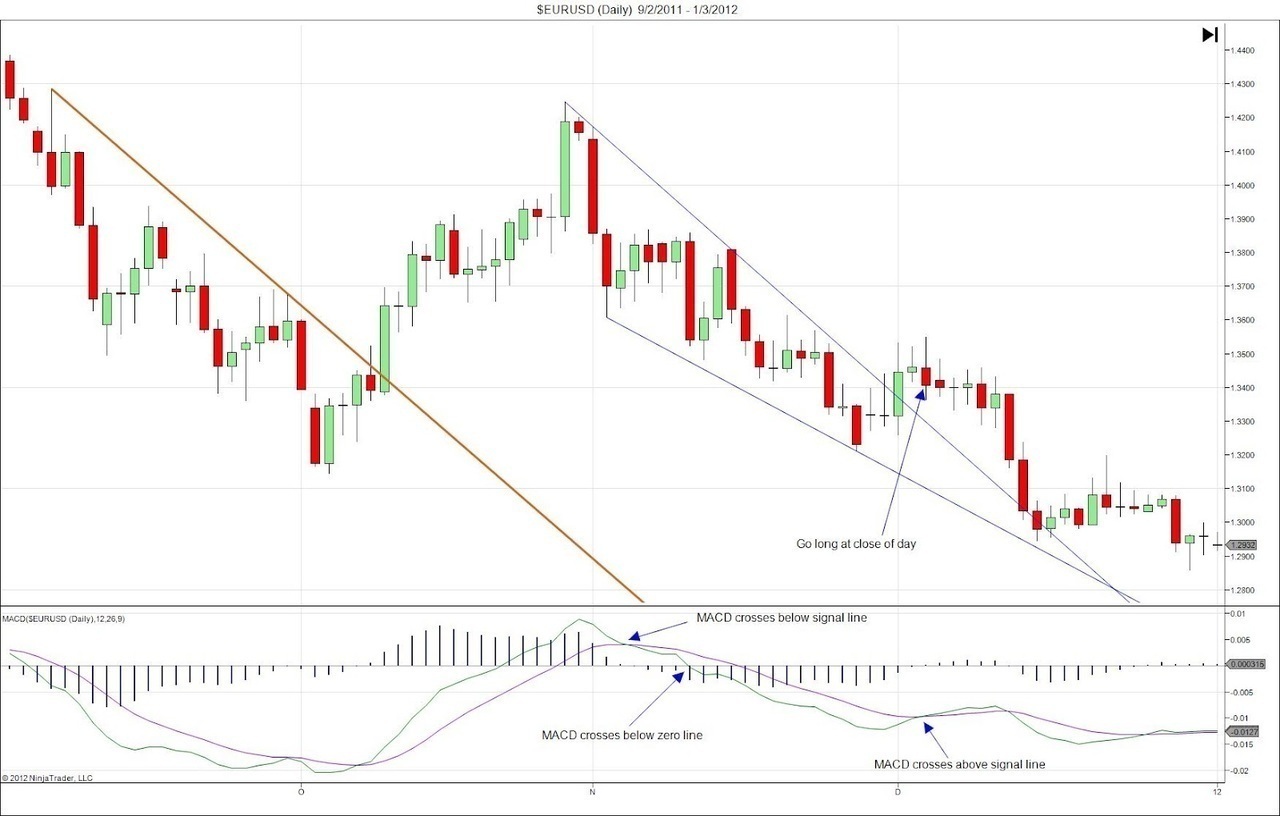
- The MACD crosses below its Signal Line before falling below the Zero Line. The supplementary rules were met.
- Hence, once we got a positive crossover of the MACD, it presented a technical signal to go long. However, the trade went against us almost immediately.
What was bad about this trade?
Here, the market broke above a bear trend line (orange). This development created the context for a bullish trend reversal.
However, the highlighted wedge pattern retraced almost 80% of the bullish move up from the brown trendline. This extended retracement was a sign that the trend reversal was not forthcoming. While it was not a dealbreaker at that point, it’s a good idea to demand further confirmation before taking on a bullish position.
Review - MACD Basic Trade Setup
Gerald Appel designed the MACD basic setup as an improvement over the usual moving average crossovers.
The supplementary rules play the role of an oscillator. Essentially, it makes sure that the market is sufficiently oversold before buying or overbought before selling.
With their help, you can identify complex pullbacks like the wedge you saw earlier. However, you can often find better entry signals based on the price action rather than waiting for a MACD buy signal.
In a nutshell, the MACD combines a trend indicator and an oscillator into one neat package. In doing so, it offers a more holistic view of the market.
However, while the MACD offers value in terms of clarifying price action, its lagged signals present a disadvantage. Consider paying attention to price bars patterns for entry signals after using MACD to understand the context.
If not, consider using the MACD for position trading.
This area is where the MACD has the best chance to shine despite its lagged signals. Position traders aim to profit from a major chunk of a trend. As position trading offers substantial profit potential over a longer time frame, the lagged signals become a minor concern.
With these in-depth and varied trading examples, you’ve gained mastery over the pros and cons of the MACD indicator. You’ve also seen how this common indicator behaves in markets presenting different price action.
Armed with this solid foundation, you are well-placed to dive into more advanced MACD strategies.
And don’t forget to check out Gerald Appel’s book for more insights.

This article was first published on 24 February 2012 and updated on 15 July 2019.