2-Period ADX Trend Trading Strategy
By Galen Woods ‐ 4 min read
The 2-Period ADX Trend Trading Strategy uses a simple tweak of a popular indicator finding low-risk, high-reward trend entries.
J. Welles Wilder pioneered an array of popular indicators (ADX, Parabolic SAR, RSI) in his book, New Concepts in Technical Trading Systems. The 2-period ADX is our tweak of Wilder’s ADX indicator to enhance its prowess for day traders. In the 2-period ADX Trend Trading Strategy, we are using a 2-period ADX to catch low risk entries in a trending market.
The concept underlying the 2-period ADX is to find the perfect pause in the market. By using such a short look-back period for the ADX indicator, it becomes extremely sensitive. Hence, it rarely falls below 25. When it does, it is a signal that a break-out is imminent.
Learn: The Logic Of The 2-Period ADX
In this trading strategy, we will analyze the trend context to anticipate the break-out direction.
Trading Rules - 2-Period ADX Trend Trading
Bull Trends
- From below the 20-period EMA, price makes a higher swing high above the 20-period EMA.
- 2-period ADX falls below 25 but price is still above EMA. (signal bar)
- Place buy order one tick above the high of the signal bar.
- Cancel order if not triggered by the next bar.
Bear Trends
- From above the 20-period EMA, price makes a lower swing low below the 20-period EMA.
- 2-period ADX falls below 25 but price is still below EMA. (signal bar)
- Place sell order one tick below the low of the signal bar.
- Cancel order if not triggered by the next bar.
2-Period ADX Trend Trading Examples
Winning Trade - Bullish Entry
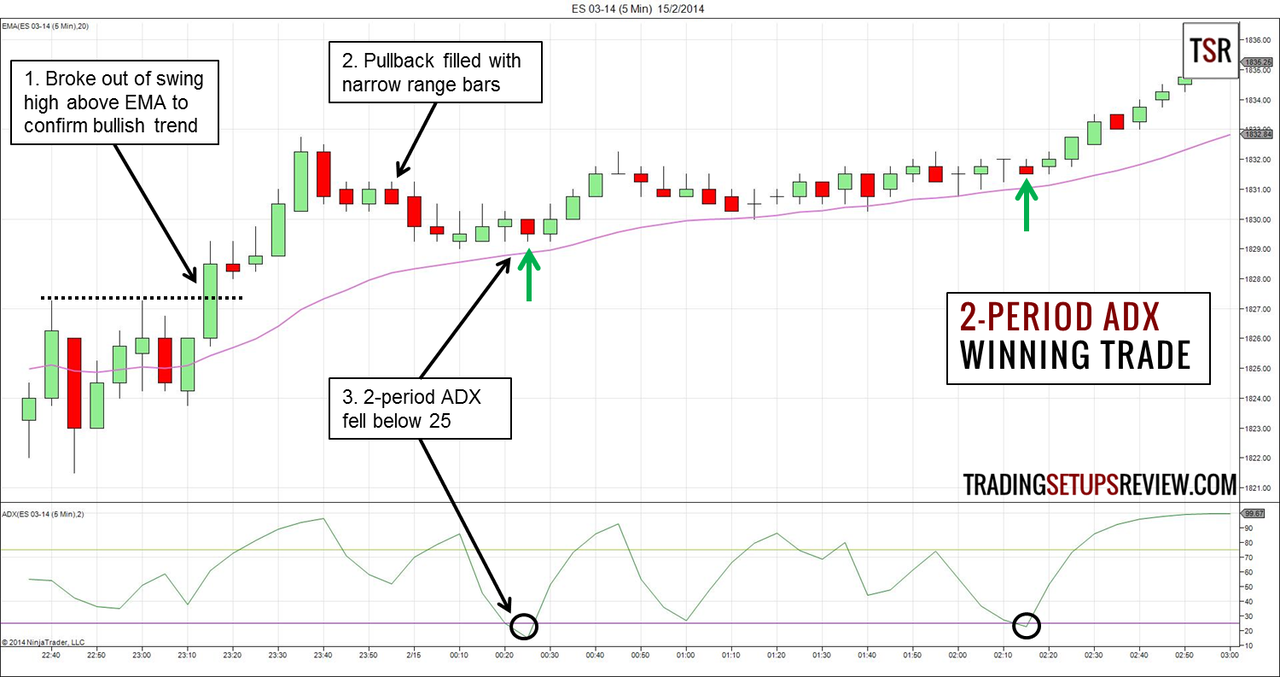
This is a 5-minute ES chart showing a nice bullish trending session. The purple line is the 20-period EMA, and the lower panel shows the 2-period ADX.
- From below the moving average, price rose and broke above a swing high. That was our signal that a bull trend has begun.
- After rising for several bars, price started to pullback. The pullback consisted of many narrow range bars which stayed above the EMA. The bullishness remained intact.
- The 2-period ADX fell below 25. We bought as price broke above the high of the signal bar.
By placing our stop just below the low of the signal bar, our risk was small. Even with a conservative target price, we could obtain a high reward to risk ratio.
In addition, the 2-period ADX offered a second entry in the later part of the session. That entry was another low-risk entry into the bull trend.
Losing Trade - Bearish Entry
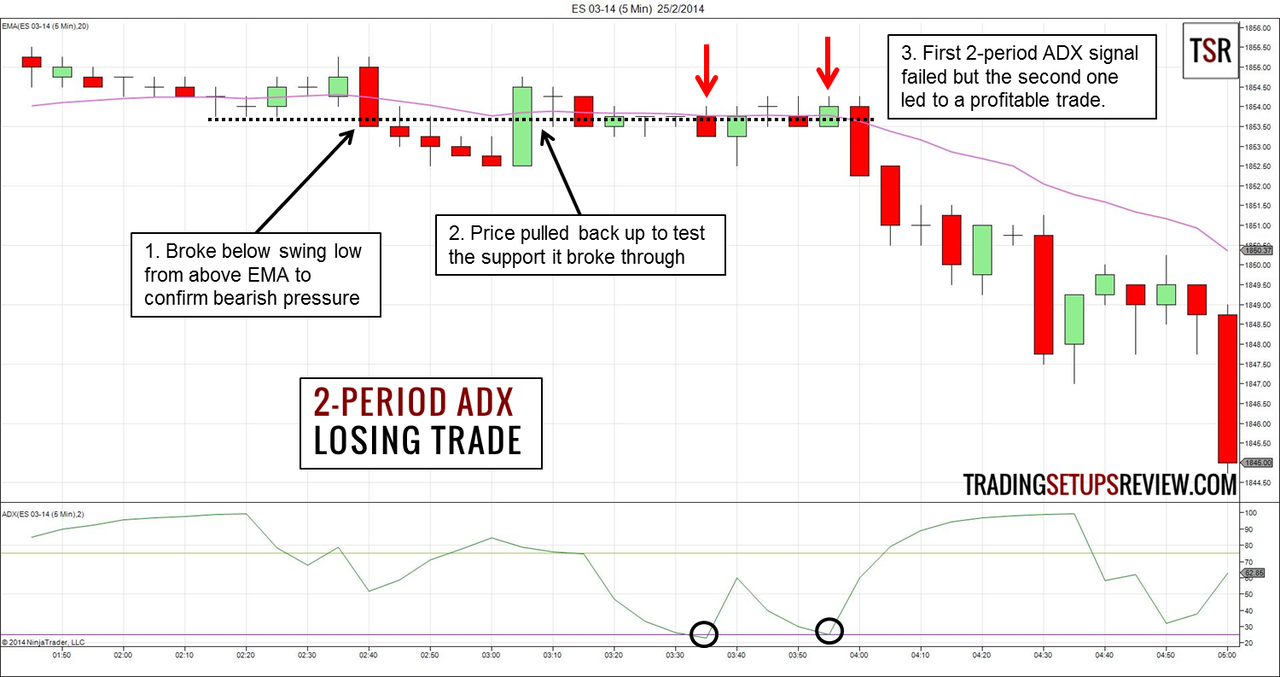
This is another 5-minute chart of ES futures. In this case, the first signal resulted in a loss.
- Price fell below the EMA and broke a swing low, giving us the signal to look for shorts.
- After pushing below the support, the bearish momentum waned. The bearish candlesticks had small bodies. Eventually, a strong bullish bar ended the fall. However, the bullish bar had no follow-through. Instead, price drifted horizontally along the earlier support which has flipped to become a resistance.
- In the sideways trading range, we had two 2-period ADX signals. The first signal failed almost immediately.
However, the trade risk was low. Hence, the potential profits from the second ADX signal more than made up for it.
Review - 2-Period ADX Trend Trading Strategy
The 2-period ADX is an excellent way to find low-risk entries into market trends. Most signal bars are narrow range bars, and its extreme offers a reliable stop-loss level.
The main drawback of the 2-period ADX is that we might get caught in tight trading ranges. However, by combining the 2-period ADX signal with the market bias we identified with price action, we limit our entries to potential new trends. Not only does this method keep us with the trend, it also helps us to avoid false break-outs.
Another characteristic of the 2-period ADX signals is that they occur infrequently. It teaches the virtue of patience in trading. Instead of jumping into a trend as it’s speeding away, exercise patience and join the train during its perfect pause.
Feel free to use your own trend filters instead of what we suggested. The key is to find potential new trends. The signals do not work as well in mature trends.