10 Technical Trading Indicators You Must Know
By Galen Woods ‐ 13 min read
Do not be overwhelmed by technical trading indicators. Kick-start your trading education with these 10 essential trading indicators.
Are you confused by the bright lines on your trader friend’s price charts? What value do those squiggly lines add to your chart analysis?
Let’s find out now.
In technical analysis, these colourful lines are technical indicators used for forecasting the market. There are tonnes of trading indicators with creative traders churning out new variants every day.
There is absolutely no need to master them all. But you should know the ten technical indicators that follow.
For each trading indicator, I will briefly explain its calculation logic. We aim to find out what goes into each indicator while avoiding their intimidating formulae.
(For their exact calculation, refer to ChartSchool.)
I will also describe each indicator’s basic usage together with an example chart and further resources.
Technical Indicators - Overview
Price Moving Averages
1. Simple Moving Average (SMA)
2. Exponential Moving Average (EMA)
Trading Oscillators
3. Stochastic Oscillator
4. Relative Strength Index (RSI)
5. Commodity Channel Index (CCI)
Trend Indicators
6. Average Directional Index (ADX)
7. Moving Average Convergence Divergence (MACD)
Price Channels
8. Bollinger Band
9. Donchian Channel
10. Keltner Channel
Price Moving Averages
A moving average is one of the simplest technical indicator derived from price. Although there are many versions out there, there are only two common variants.
1. Simple Moving Average (SMA)
The simple moving average was popular in the past as it was easy to calculate manually without the need for computers. Now, despite powerful charting platforms, it continues to attract traders with its sheer simplicity.
Calculating the SMA
The SMA is calculated by taking the average closing price of the past N bars. The trader provides the input N.
Simple, right?
Interpreting the SMA
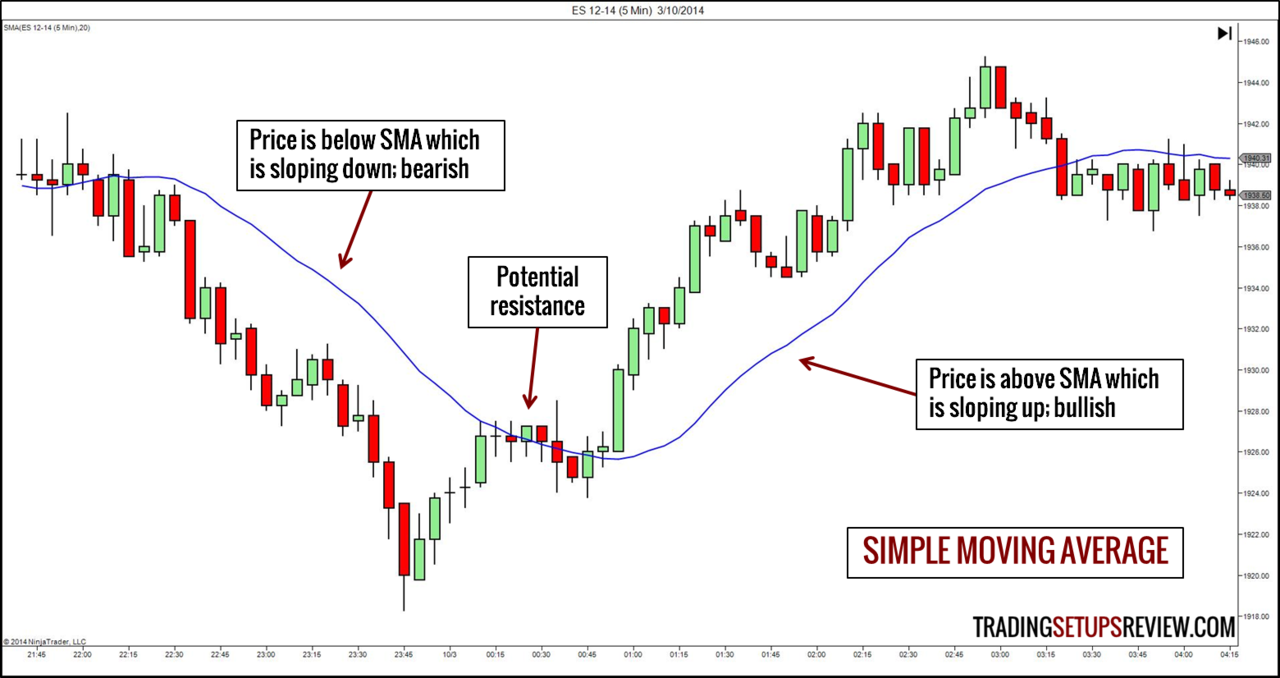
The basic approach is to compare the price with the SMA to assess the market sentiment.
- Price is above the SMA –> Bullish
- Price is below the SMA –> Bearish
You can also look at the slope of the SMA.
- SMA is sloping up –> Bullish
- SMA is sloping down –> Bearish
As we overlay moving averages on price charts, it is also possible to use them as support/resistance levels.
Learn More About the SMA
- Find out how to trade with only a 20-period moving average.
2. Exponential Moving Average (EMA)
In the past, the SMA was just MA. But traders grew dissatisfied with the SMA as they always do with simple methods. So, they started to tinker with it. They then had to call it “simple” to distinguish it from its complex counterparts that resulted from the tinkering.
One of the SMA’s sophisticated cousin is the EMA.
Calculating the EMA
Like the SMA, the EMA is also an average closing price of the past N bars. However, it is not a simple average. It is a weighted average.
(A small caveat here. The EMA contains information from more than N bars ago. Read this article to learn more.)
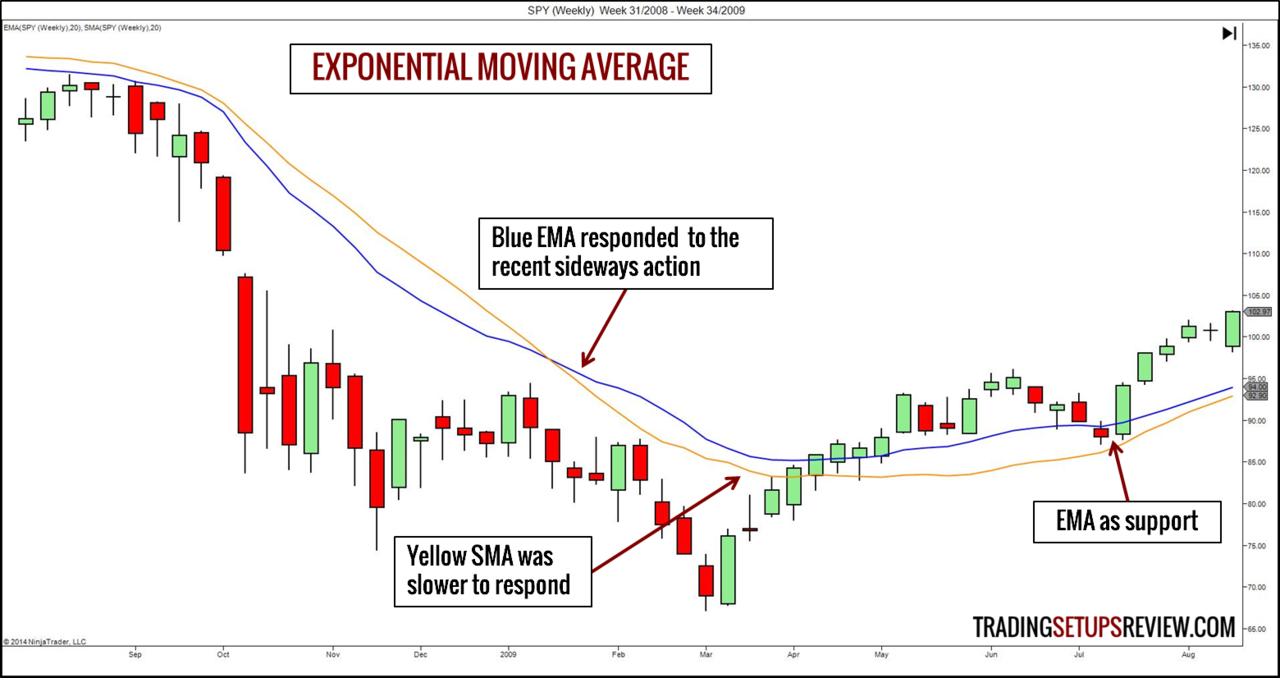
In obtaining the EMA value, we give a higher weight to the more recent values. The result is a moving average that is more responsive to current prices.
Interpreting the EMA
The interpretation of the EMA in trading is the same as that of the SMA as stated above.
The key here is to recognise the trade-offs between the SMA and EMA. As the EMA is more responsive to recent market prices, it produces more signals from bullish to bearish and vice versa. However, the more signals a moving average provides, the less reliable each signal becomes.
This trade-off is inevitable among technical indicators.
Learn More About the EMA
- The 9/30 trading setup uses a 9-period EMA with a 30-period WMA.
- Find out more about the difference between SMA and EMA.
Trading Oscillators
Trading oscillators measure the momentum/speed of price movement. Mostly, they find over-extended market movements that might be reversing.
Let’s take a look at three common oscillators in technical analysis.
3. Stochastic Oscillator
George Lane’s Stochastic Oscillator had been the classic oscillator since its invention decades ago. For a fascinating history of the Stochastic, take a look at this article in MTA’s knowledge base.
Calculating the Stochastic
Common Default Value: Stochastic(14,3)
The Stochastic plots with two values: %K and %D.
As an example, consider the price range of the past two weeks. If the price is near the top of this range, the two-week Stochastic produces a high %K value. If price hovers near the bottom of the range, it gives a low %K value.
The %D line, which is usually a 3-period moving average of %K, acts as the trigger line.
A few tweaks in its formula ensure that the Stochastic values always fluctuate between 0 and 100.
Interpreting the Stochastic
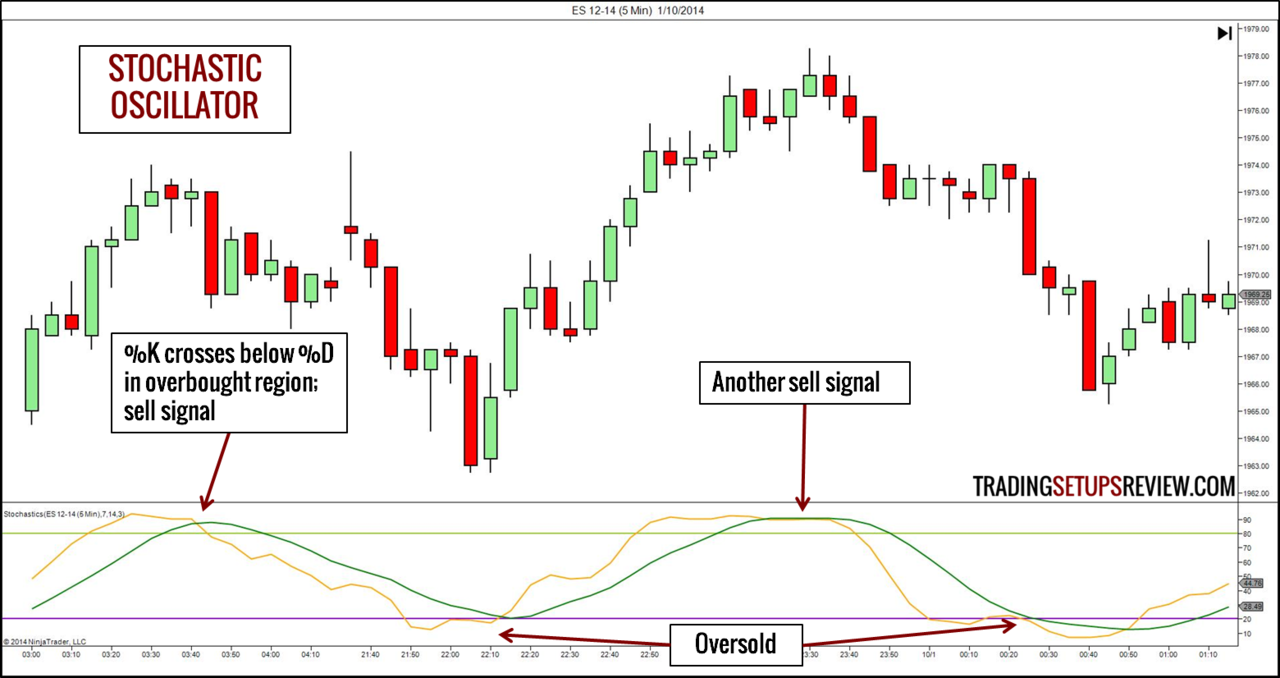
If the market is at the extreme (high or low) of the recent trading price range, there is clearly strong momentum in one direction. But the momentum might be unsustainable. Hence, there are overbought and oversold zones.
- Stochastic values above 80 –> Overbought (look to sell)
- Stochastic values below 20 –> Oversold (look to buy)
Combining both the %K and %D lines offers exact signals.
- %K crossing below %D –> Sell signal
- %K crossing above %D –> Buy signal
Learn More About the Stochastic
- A multiple time-frame day trading strategy that uses Stochastic.
- How to really calculate the Stochastic (with Excel spreadsheet).
4. Relative Strength Index (RSI)
There is one person we can never avoid when we talk about technical indicators. He is J. Welles Wilder. The RSI is one tool in his diverse and valuable toolbox.
Calculating the RSI
Common Default Value: RSI(14)
The RSI measures the speed of price movement using concepts of average gain and average loss.
The RSI combines the average gain and average loss into a single ratio (RS) that represents price momentum. Then, we apply a smoothing process similar to that of the EMA.
Like the Stochastic, the RSI values are always between 0 and 100.
Interpreting the RSI
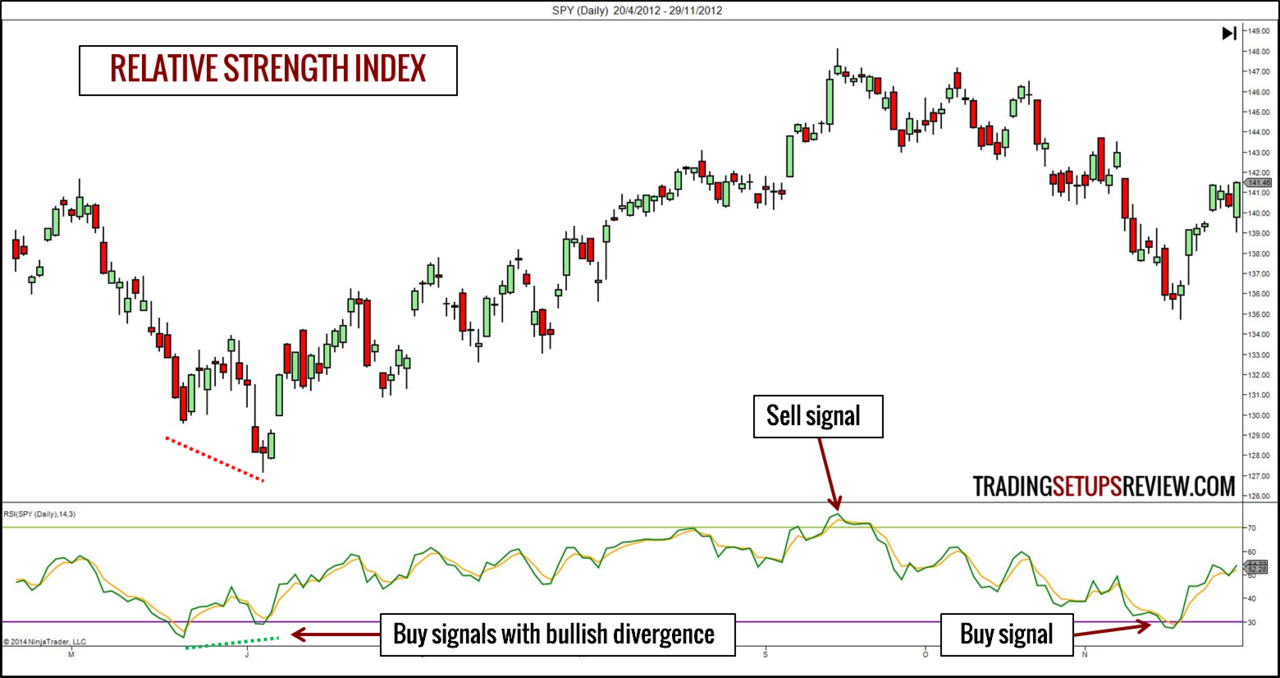
If the average gain outpaces the average loss consistently, the market might be poised to fall. The reverse is true when the average loss is leading.
- RSI values above 70 –> Overbought (look to sell)
- RSI values below 30 –> Oversold (look to buy)
Learn More About the RSI
- Combine candlestick patterns with RSI for a well-timed entry.
- Use RSI in day trading.
- Try an unusual RSI setting that works.

.
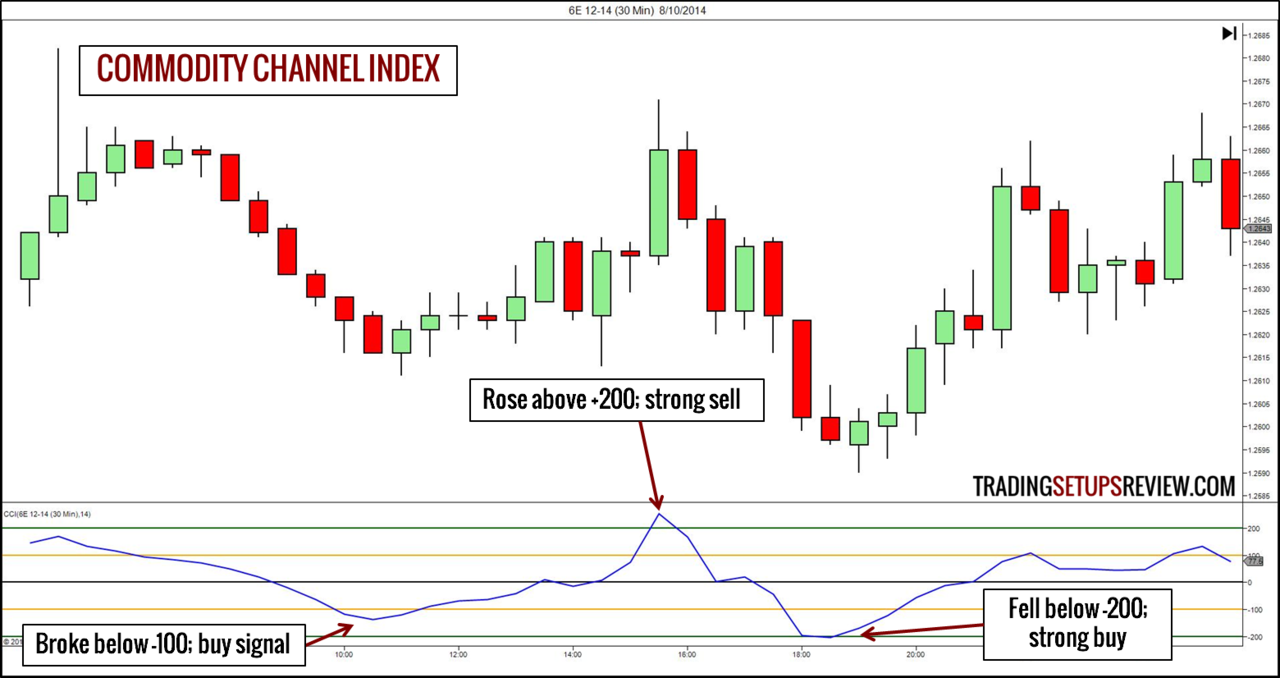
5. Commodity Channel Index (CCI)
Donald Lambert’s CCI is another trader’s favourite. Although originally meant for trading commodities, it is also used for other financial instruments.
Calculating the CCI
Common Default Value: CCI(14)
The CCI uses the deviation between price and its moving average to measure price momentum. It does so by comparing the deviation of the current period with the average deviation in the past N periods.
Unlike the Stochastic and RSI, CCI values are unbounded. But, practically, due to a factor chosen by Donald Lambert, its value is usually between -100 to +100.
Notably, the CCI uses typical price (H+L+C/3) instead of closing price.
Interpreting the CCI
Its name is telling. The CCI works on the assumption that price is typically contained by an invisible channel around a moving average.
If you think that the hidden channel will hold, you should follow these trading rules.
- CCI values above +100 –> Overbought (look to sell)
- CCI values below -100 –> Oversold (look to buy)
If you think that the market will break out of the invisible channel, then look at Donald Lambert’s original rules.
Learn More About the CCI
- Day trade forex with Donald Lambert’s original concept.
- Woodie did a great job popularising the CCI indicator.
Trend Indicators
The oscillators above work hard to find reversals. On the other hand, the technical indicators in this section try to pinpoint trends.
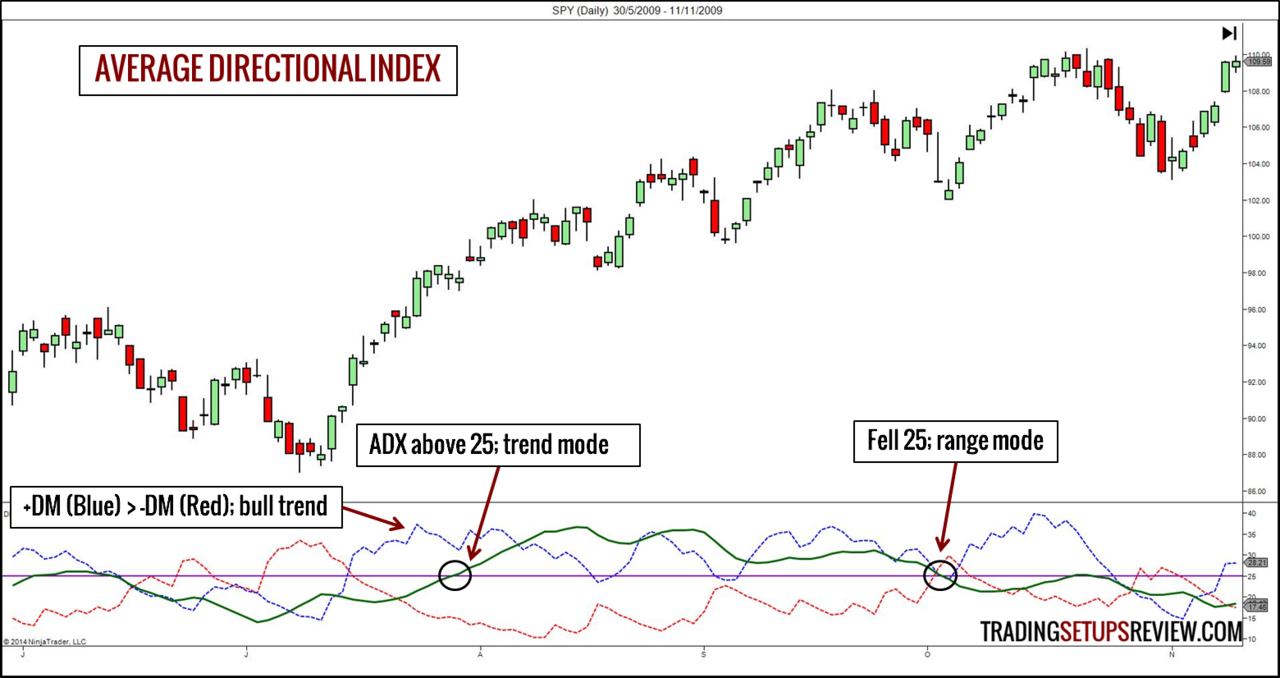
6. Average Directional Index (ADX)
Let’s welcome J. Welles Wilder again. He believed that to trade effectively, you must figure out if the market is trending or ranging. And the ADX is his tool for doing so.
Calculating the ADX
Common Default Value: ADX(14)
The ADX is built on the unique concept of directional movement. Positive directional movement (+DM) refers to the difference between the high of a price bar and that of its preceding bar. Negative directional movement (-DM) is the difference between the low of a price bar and that of the bar before it.
Clearly, when the market is bullish, +DM is high. When the market is bearish, -DM is high.
By combining +DM and -DM in a Wilder-ish formula, we get the ADX which is a measure of trend strength.
Interpreting the ADX
The ADX is a trend strength indicator. High values represent a trending market, and low values represent a dull one.
- ADX values above 25 –> Market is trending
- ADX values below 25 –> Market is meandering
Something is missing. Doesn’t the ADX show us market trend’s direction?
Alone, it does not. But the ADX is often used with the +DM and -DM plots. For instance, when +DM is above -DM and ADX is above 25 like in the chart above, the market is in a bull trend.
There is one more method to interpret the ADX.
Learn More About the ADX
- Time your trend trades with ADX(2).
is the best resource for learning the ADX.
.
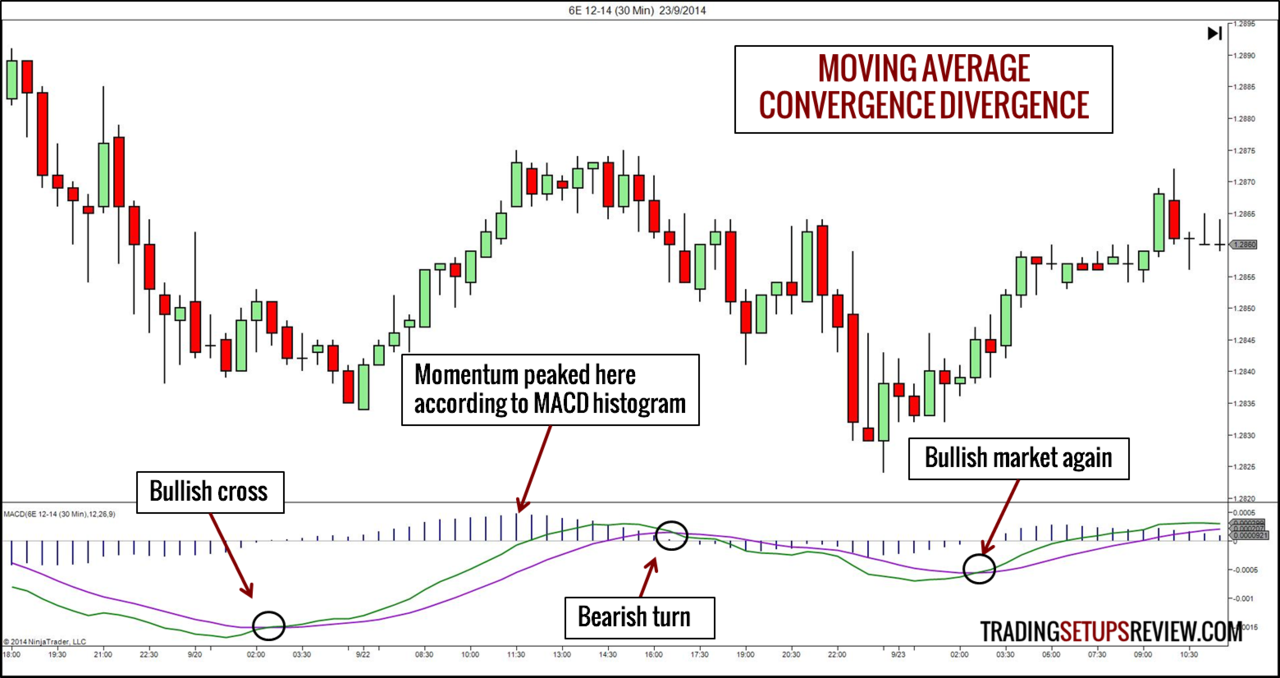
7. Moving Average Convergence Divergence (MACD)
Gerald Appel’s MACD is one of the most intuitive technical indicators around. It amplifies the value of moving averages in an elegant way to track both trend and momentum.
Calculating the MACD
Common Default Value: MACD(12,26,9)
The MACD plots the difference between two moving averages, usually the 26-period and 12-period.
A 9-period moving average of the MACD is then plotted as the signal line.
If you see a histogram on a MACD plot, it is the difference between the MACD line and its signal line.
Interpreting the MACD
The MACD works because, in a trending market, the space between two different moving averages expands. As the MACD always deduct the shorter moving average from the longer one, its value rises in a bull trend and falls in a bear trend.
- MACD above signal line –> Bullish
- MACD below signal line –> Bearish
Also, the histogram highlights the momentum of the market.
- High positive histogram values –> Strong bullish momentum
- High negative histogram values –> Strong bearish momentum
However, as the MACD is unbounded with no normal limits, it is not practical to define oversold and overbought regions. Hence, looking for MACD divergence is the preferred method.
Learn More About the MACD
- Combine MACD with the inside bar pattern to time your trades.
- Gerald Appel’s original MACD strategy from his book - Technical Analysis: Power Tools for Active Investors.
- An advanced MACD strategy with hidden divergence.
- A 4-hour MACD strategy for forex trading.
Price Channels
Price does not move in a straight line. It swings up and down. And the market often looks like it is moving within a price envelope.
This is why many traders favour technical indicators that highlight the market’s channel-like movement.
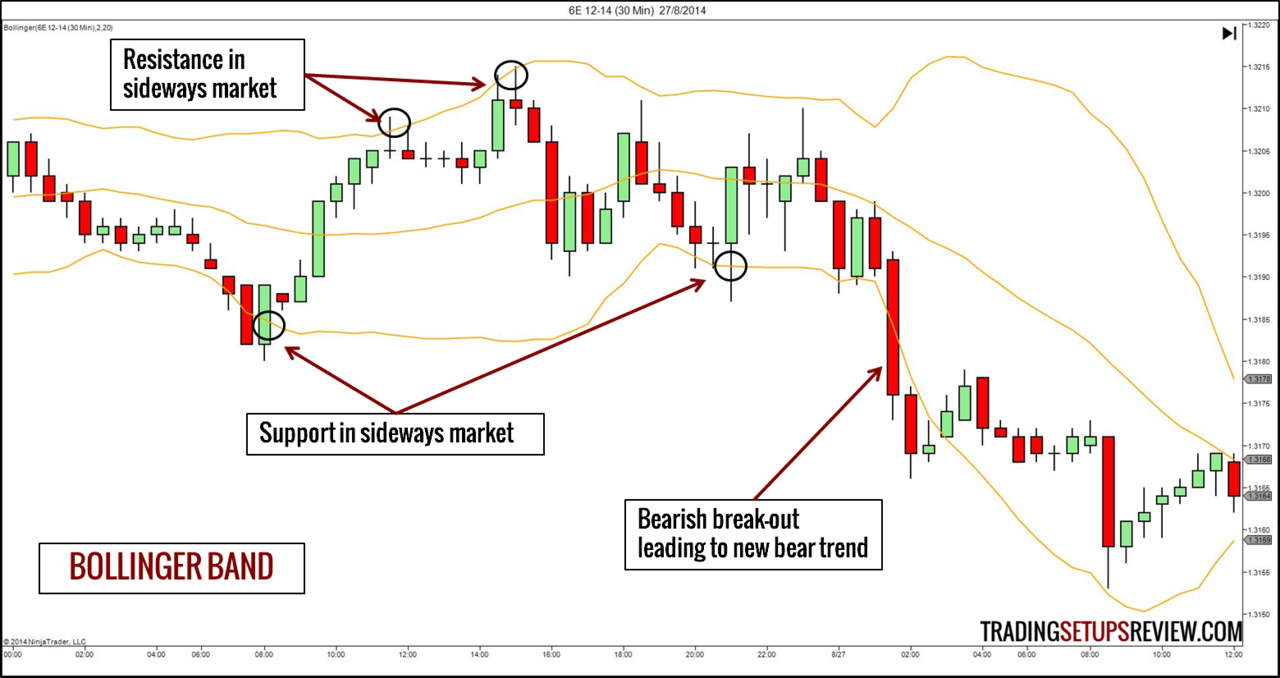
8. Bollinger Band
John Bollinger has given his name to one of the most popular technical indicators. The Bollinger Band is now a standard overlay for many technical traders.
Calculating the Bollinger Band
Common Default Value: Bollinger(20,2)
The Bollinger Band might look erratic with its sudden expansions and constrictions. But it is, in fact, a straightforward and logical technical indicator.
First, plot a moving average of the past N periods. Then, calculate the standard deviation of the past N periods.
To get the upper band, displace the moving average upwards by a multiple of the standard deviation. For the lower band, displace the moving average lower by the same distance.
Interpreting the Bollinger Band
For a range trade,
- Price tags upper band –> Look to sell
- Price tags lower band –> Look to buy
The Gimmee Bar is an example of using the Bollinger Band in a sideways market.
For a break-out trade,
- Price closes above upper band –> Look to buy
- Price closes below lower band –> Look to sell
For example, consider this strategy which combines the MACD and the Bollinger Band.
Learn More About the Bollinger Band
- Trading the Squeeze with Bollinger Band.

.
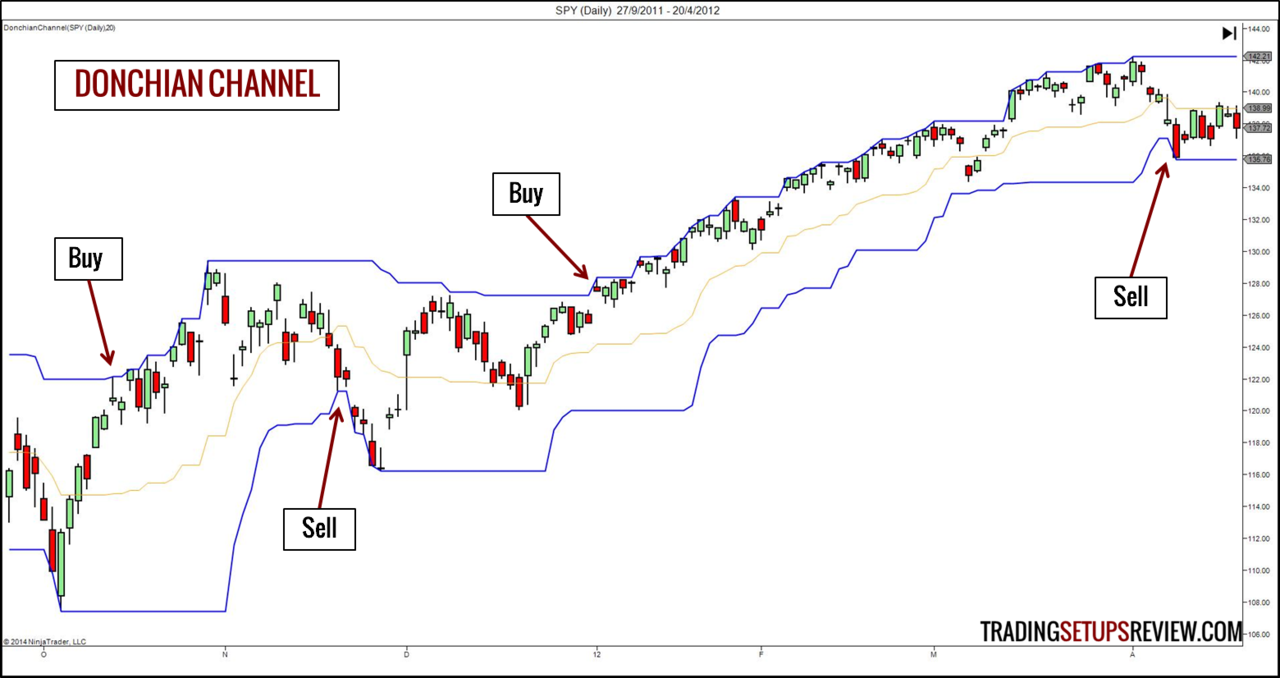
9. Donchian Channel
This indicator got its name from Richard Donchian, a pioneer of managed futures and the well-known Turtle trend-following method. There is no way we are giving this indicator a miss.
Calculating the Donchian Channel
Common Default Value: DonchianChannel(20)
The normal default period of 20 aims to contain four weeks of trading activity on the daily chart.
The Donchian Channel plots the highest high in the last N periods as its top channel line. The lowest low in the last N periods is plotted as its bottom channel line.
Interpreting the Donchian Channel
The Donchian Channel is designed to follow a trend. Each break-out of the channel is a possible start of a new trend.
- Price breaks out above the channel –> Potential bull trend
- Price breaks out below the channel –> Potential bear trend
Learn More About the Donchian Channel
- Try using the Donchian Channel in day trading.
- Curtis Faith describes a Donchian Channel trading system in his book - Way of the Turtle.
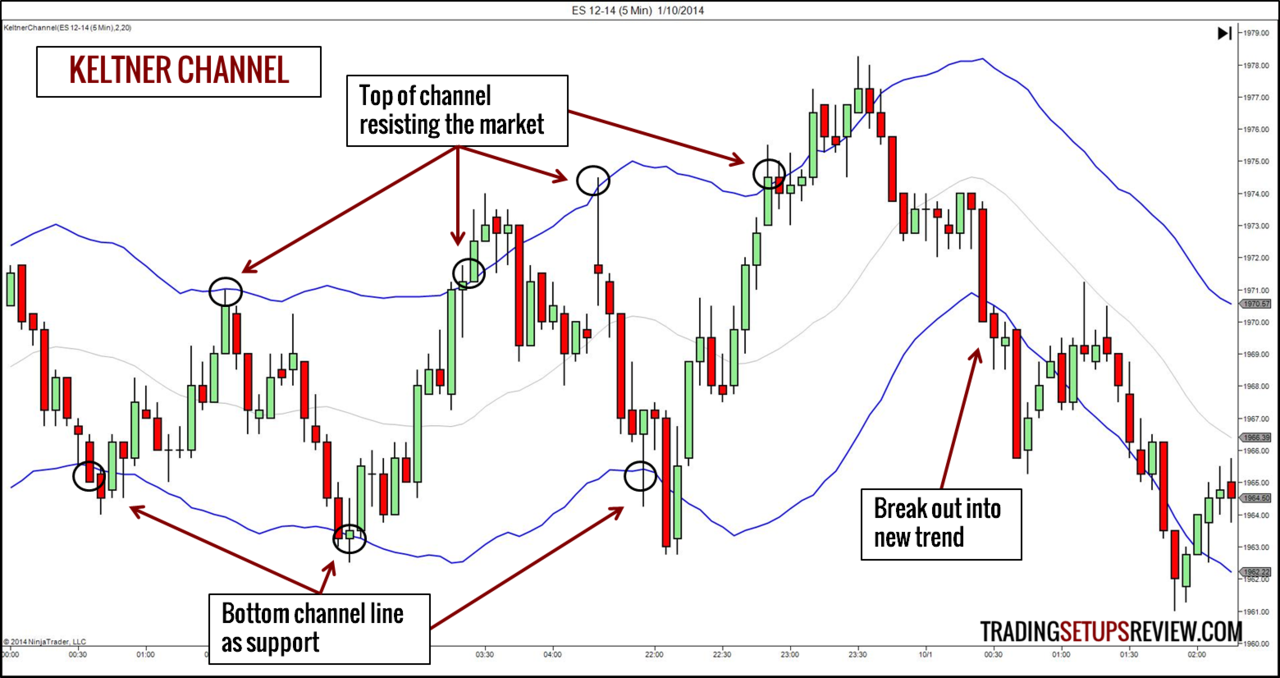
10. Keltner Channel
The Keltner Channel as most traders know it now combines the ideas of Chester Keltner and Linda Bradford Raschke.
Calculating the Keltner Channel
The construction of the Keltner Channel is like that of the Bollinger Bands.
However, instead of using standard deviation to draw the bands, it uses Wilder’s Average True Range. This difference causes the Keltner Channel to look smoother than the Bollinger Band.
Interpreting the Keltner Channel
For a range trade,
- Price tags the upper channel line –> Look to sell
- Price tags the lower channel line –> Look to buy
For a break-out trade,
- Price closes above the upper channel line –> Look to buy
- Price closes below the lower channel line –> Look to sell
Learn More About the Keltner Channel
- Learn how to read price action with the Keltner Channel.
- Find high-quality trend trades with the Keltner Channel.
- This article has a helpful comparison of the Keltner Channel and the Bollinger Band.
- Look at Chester Keltner’s original trading ideas.
What’s Next?
We have covered the basics of 10 essential technical indicators. But there is much more to learn before you can extract value from them.
Understand That Rules Are Guidelines
No trading indicator is perfect.
The interpretation rules above look straightforward and mechanical. But they are merely guidelines. In fact, if you apply them mechanically, you will not make money.
Master technical indicators with these tips:
- Grasp the market context in which they work.
- Learn to read price action together with technical indicators to complete your learning.
- Learn from the masters by following the links in the “Learn More” sections above.
- Combine indicators to form a rounded perspective.

.
Experiment with Look-Back Periods
The behaviour of each technical indicator varies with its look-back period. The default settings might not always make sense. Experiment!
(This 2-period ADX strategy is a product of my experiments.)
Add Volume Indicators into the Mix
The ten technical indicators we covered are derived from price. Volume is another important piece of market data.
When you feel up to it, add in volume indicators for another dimension of analysis. Start with the OBV indicator.
Find it tough to apply indicators? Try price action. Click here for our ultimate price action trading guide.