Active Trading with the StochRSI Indicator
By Galen Woods ‐ 4 min read
The StochRSI indicator produces more trading signals compared to the RSI . This means more profit opportunities. But what should you look out for?
StochRSI is a portmanteau of two common oscillators: Stochastic and Relative Strength Index (RSI). It nests the RSI indicator within the Stochastic indicator.
Sounds suspicious. Sounds like a fanciful indicator that obscures price action. Something to stay away from.
But before you take to your heels (and miss a useful tool), let’s take a closer look at the StochRSI.
When you study a new indicator, especially a complex one, do not start by evaluating its signals. Without first understanding the indicator, you might use it wrongly. In that case, the resulting signals are not worth further analysis.
The first step is to ask why. In this case, why nest the RSI into the Stochastic indicator?
Why can’t you use the RSI indicator on its own? What’s wrong with the RSI indicator?
The Function of StochRSI
In The New Technical Trader: Boost Your Profit by Plugging into the Latest Indicators, Tushar Chande and Stanley Kroll gave the answers.
The RSI produces few overbought and oversold trading signals. It works well for catching deep pullbacks, but misses out on short-term price extremes.
This is a problem for active swing traders who want more trading opportunities.
The StochRSI seeks to solve this problem. By fitting the RSI within a Stochastic indicator, we compare the RSI values to its recent range. With the same lookback period, the StochRSI will give more trading signals than the RSI.
RSI
- Overbought - Above 70
- Oversold - Below 30
StochRSI
- Overbought - Above 0.8
- Oversold - Below 0.2
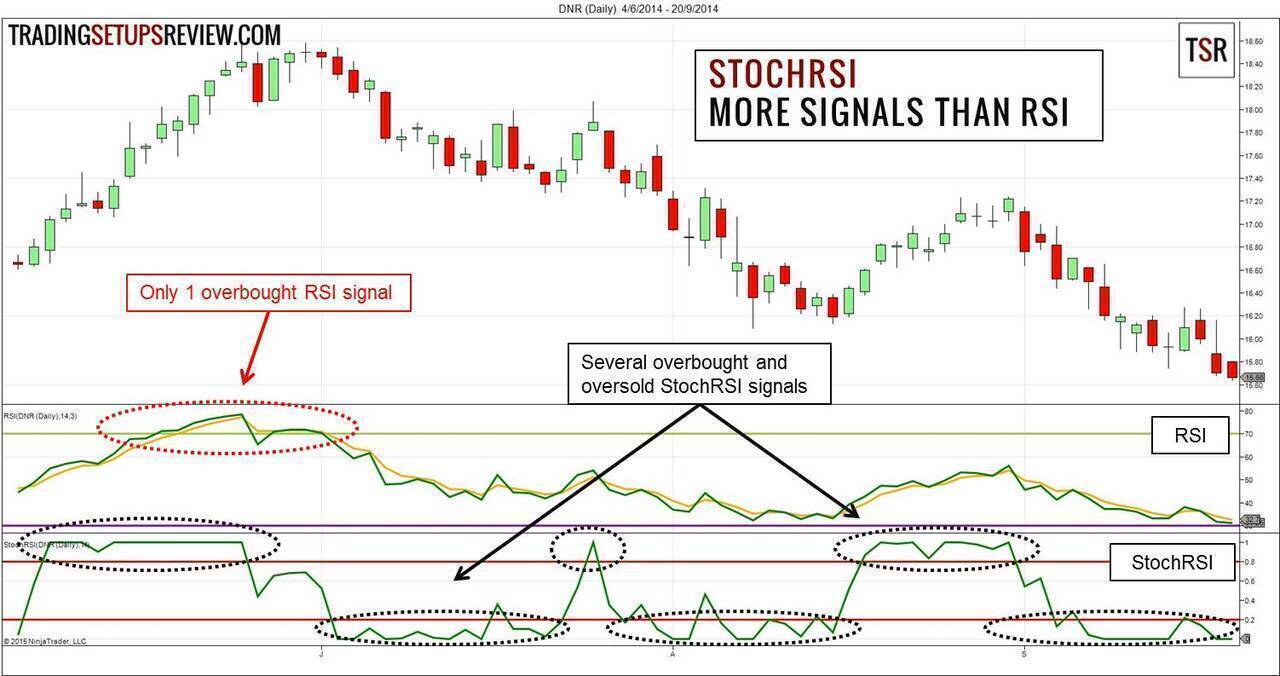
As you can see from the chart, the RSI had only one trading signal while the StochRSI gave several signals.
Prudent Use of StochRSI
The StochRSI aims to re-cast the RSI into an indicator that gives more trading signals. There is no free lunch. Remember that more trading signals come with a deterioration of signal quality.
This means that we need to take greater care to check the signals. Here are a couple of tips for trading with StochRSI.
StochRSI identifies short-term price pullbacks. Compared to the RSI, it finds shallower pullbacks. Shallow pullback trading setups work best in the context of a powerful trend.
StochRSI is more sensitive than the RSI alone. Hence, it gives off signals in response to slight pullbacks or even sideways action. This is why it is crucial that you look at price action to make sure that the market has, in fact, pulled back.
Let’s take a look at two examples to reinforce these points.
StochRSI Trading Examples
Example 1 - StochRSI in a Bear Trend
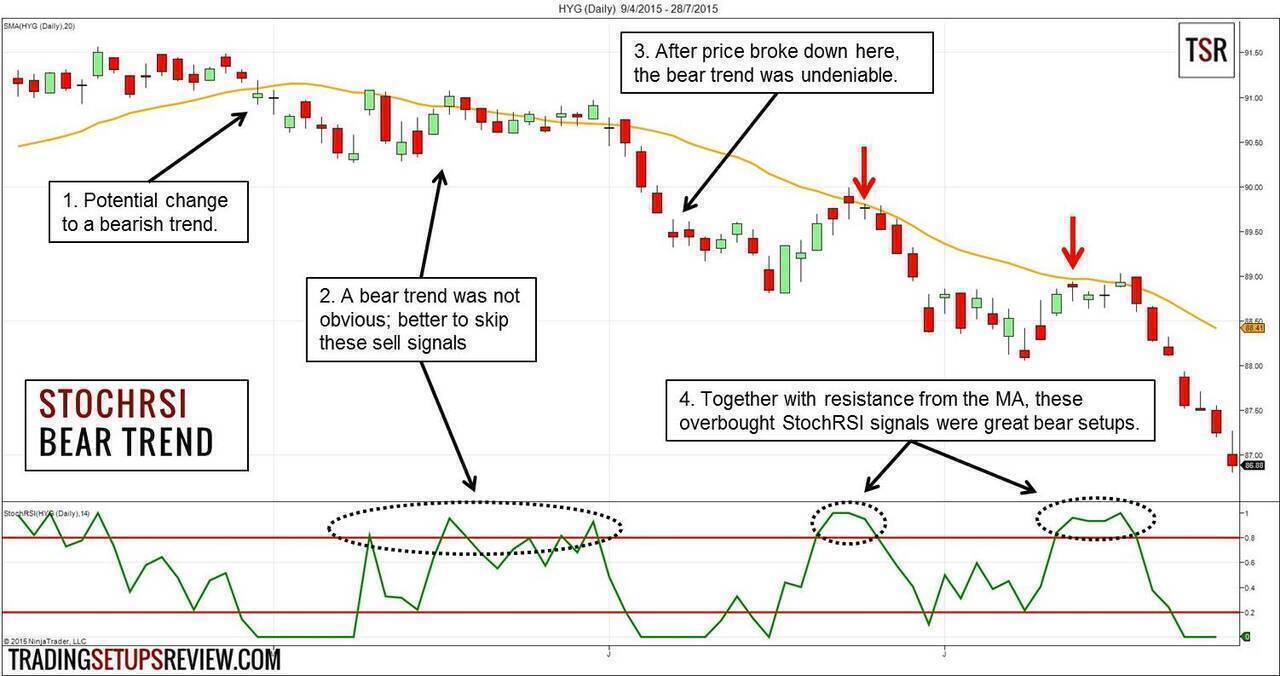
This is a daily chart of iShares iBoxx $ High Yield Corporate Bond ETF (HYG). It has a 20-period SMA overlay and a 14-period StochRSI indicator in the lower panel.
- The bearish SMA crossover hinted at a possible bear trend.
- While there were several overbought StochRSI signals here, the bear trend was not clear. Remember that a distinct trend is a better context. Hence, ignoring these signals was a good idea.
- After this price breakdown, the bear trend was then firmly established.
- These two StochRSI overbought signals were great. They were real pullbacks with higher bar highs and higher bar lows. Also, they met resistance from the SMA.
Example 2 - StochRSI in a Trading Range
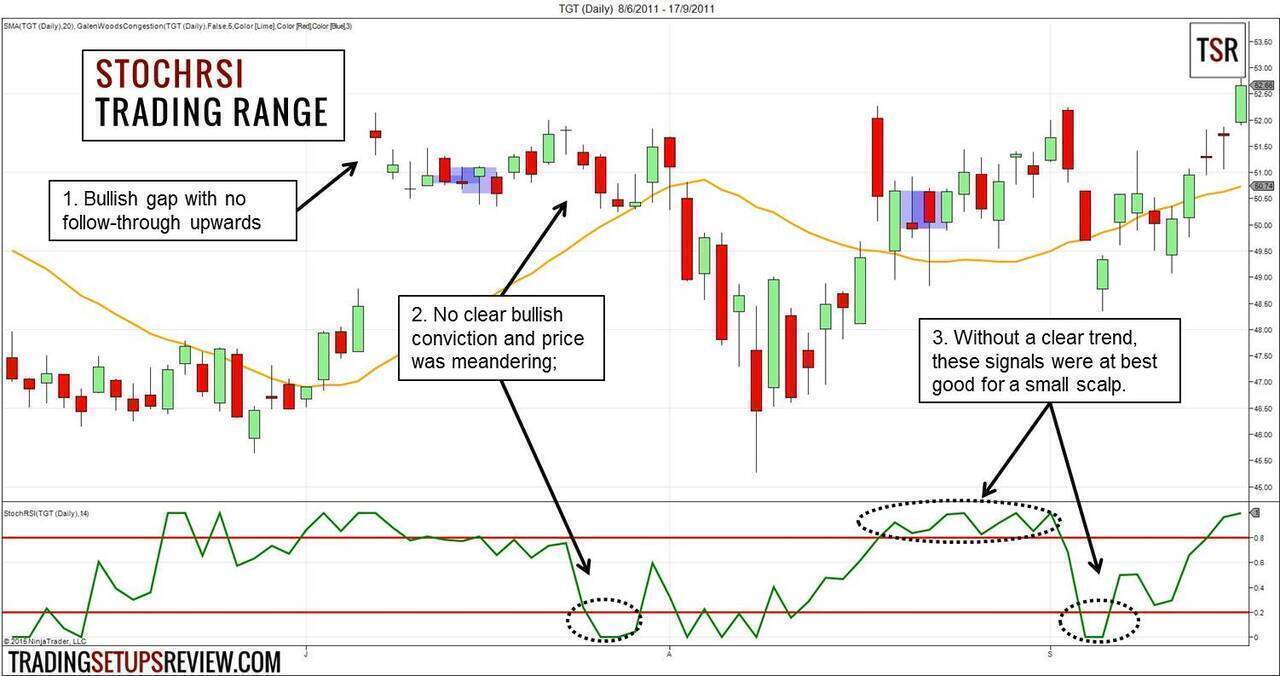
This is a daily chart of Target Corp (TGT).
- This bullish gap got the bulls excited, but failed to carry its momentum through.
- Without the support of the bulls, this oversold signal was not convincing. Furthermore, price was stuck within the earlier Congestion Zone (blue area). The Congestion Zone is a concept in my price action course.
- TGT continued to whipsaw around the SMA without forming a clear bias. Hence, these StochRSI signals were not pullback trade setups. (For the nimble and experienced trader, they might point to quick scalps.)
More Notes on the StochRSI Indicator
StochRSI might get a bad rap for being a second derivative of price. But it achieves higher trading frequency for active traders with convenience. Active swing traders can add StochRSI to their market screeners to find potential setups.
Want to find more setups while avoiding the complexity of StochRSI?
Consider using the RSI(2) or moving down to a lower time-frame. (Also look at using Stochastic for trade timing.)
If your charting platform does not have the StochRSI indicator, there is a workaround. Check if your platform can nest indicators. By using the RSI output as the input for the Stochastic indicator, you can create the StochRSI.

As always, it’s useful to refer to the original writing on StochRSI by Chande and Kroll. The New Technical Indicator also covers other interesting methods like Qstick and Linear Regression Analysis.