Demystifying the Displaced Moving Average
By Galen Woods ‐ 4 min read
The displaced moving average is a unique trading tool. Uncover the mystery and learn the effects of displacing the common moving average to your advantage.
If you shift the regular moving average on your chart to the right or left, you get a displaced moving average. Many trading strategies use displaced moving averages as an improvement over regular moving averages.
However, what is the value of displacing the moving average right or left?
Is it an improvement over the normal moving average?
Let’s find out.
Displacing Moving Average to the Right
Comparing the Regular Moving Average with the Displaced Moving Average
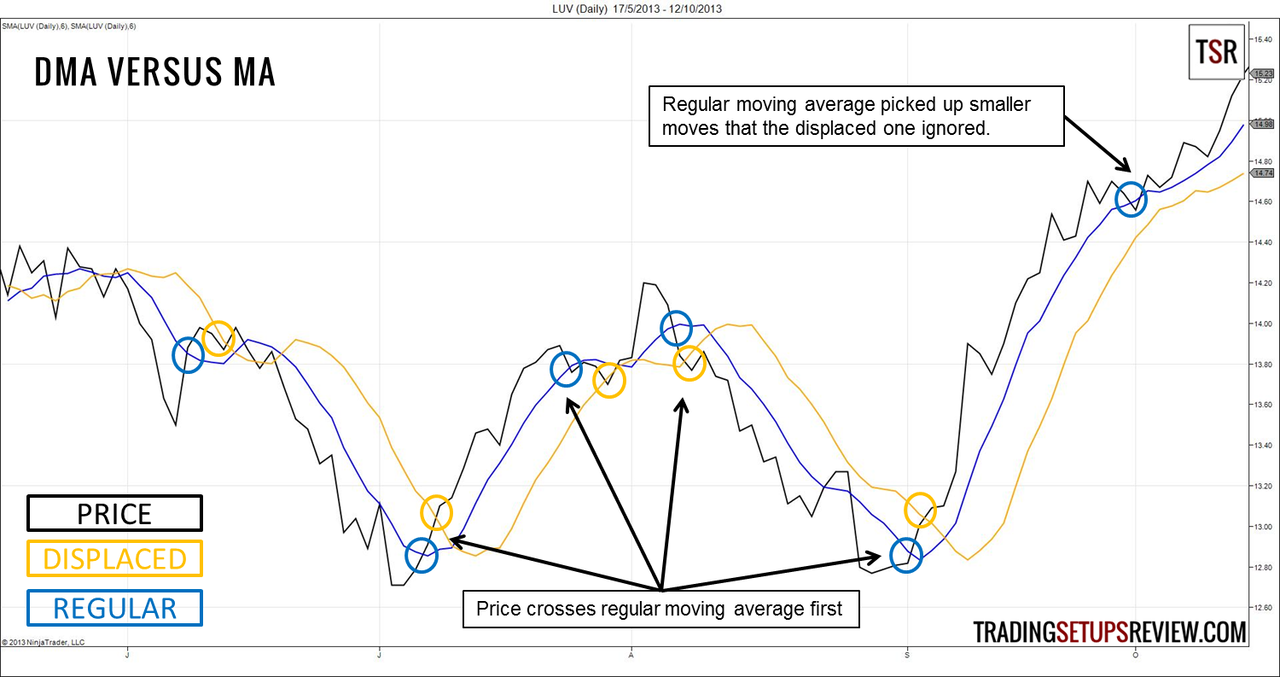
In this example, we placed a 6-period simple moving average (orange) on the daily chart of Southwest Airlines. Then, we added a 6-period simple moving average displaced by 4 periods to the right (blue). (We adapted these settings from the DMA channel trading strategy.)
To highlight price crossovers, we displayed prices with a line chart instead of the usual candlestick charts.
From this chart, it is clear that price always crosses the regular moving average before crossing the displaced moving average.
The effects of using a displaced moving average are:
- Less crossover signals
- More reliable signals, filtering out small trends
- More lag in signals
Sounds like the differences between a fast moving average (shorter period setting) and a slow moving average (longer period setting).
So is the displaced moving average just a slower moving average?
Comparing the Displaced Moving Average with a Slower Moving Average
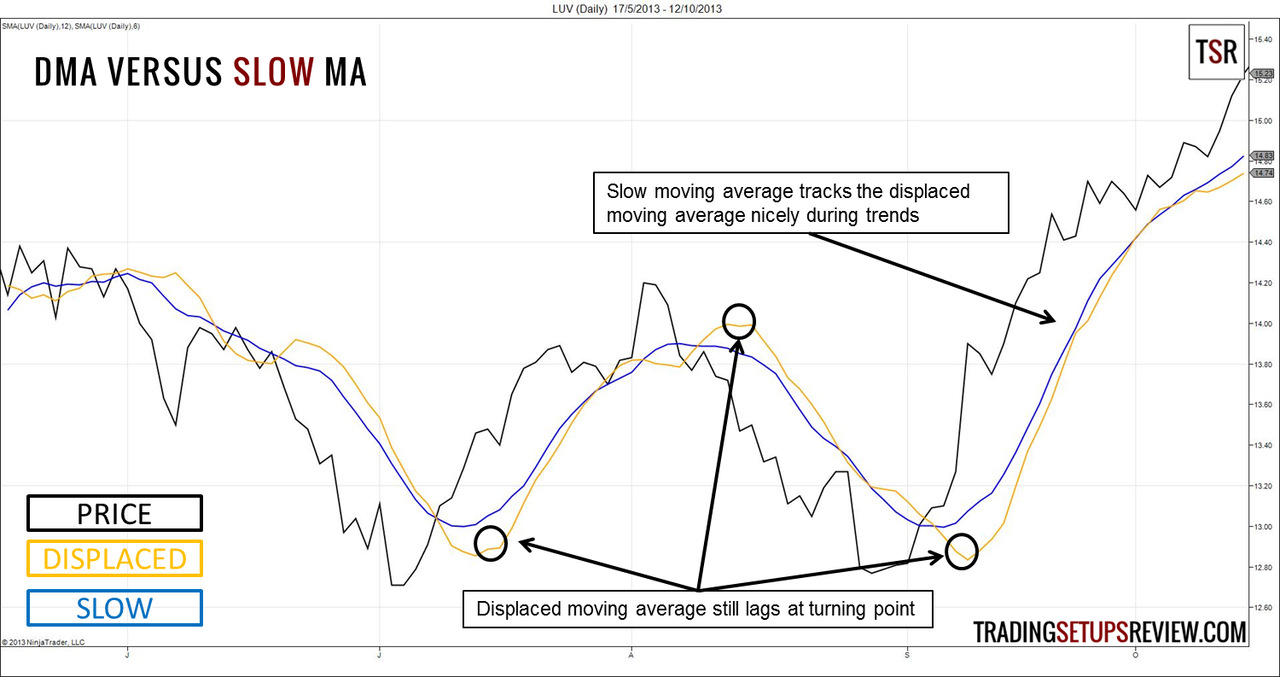
To check if a displaced moving average is merely a slower moving average, we doubled the period setting of the regular moving average to 12.
Our key observations:
- 12-period moving average tracks the displaced moving average very well during trends.
- The displaced moving average lags more at turning points.
Effects of Displacing Moving Average to the Right
Summing up what we observed, a displaced moving average is effectively a slower moving average with increased lag at turning points.
We cannot reproduce a displaced moving average simply by adjusting the period of a simple moving average. However, the displaced moving average is not a mystical forecasting tool simply because we displaced it to the right, into the future.
I do not use moving averages displaced to the right. It requires two inputs (look-back period and displacement period) and complicates an originally simple trading indicator. And the valued added is limited. It is just yet another flavor of moving average, which could work if you learn to use it.
If you want to use displaced moving averages in your trading, you can take a look at DMA channel and Bill William’s Alligator system.
Displacing Moving Average to the Left
Displacing a moving average to the left removes the value of the moving average for real-time analysis.
Cycle Analysis
However, shifting the moving average to the left by half of its look-back period actually centers the moving average and is useful for cycle analysis.
A centered moving average seeks to remove trend from price to find market cycles.
Displaced Keltner Channel Example
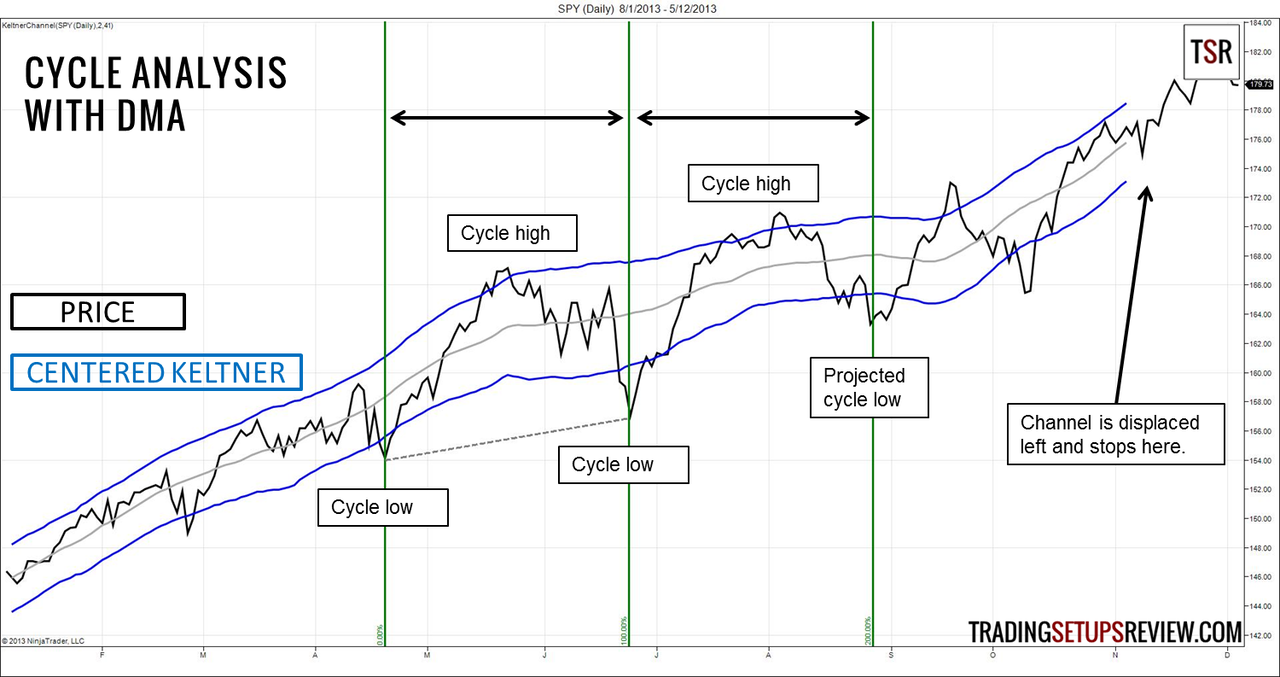
This example uses a centered Keltner Channel for cycle analysis.
This Keltner Channel consists of a 41-period moving average of the typical price (H+L+C/3), and two channel lines (2 x average true range away from the moving average). We then displace the channel 20 periods to the left to center it.
The centered channel highlights cycle lows and highs. By measuring the cycle period, we can project the possible timing of the next cycle low (or high). In this chart of the S&P ETF, the projected timing of the next cycle low was spot on.
To learn more about cycle analysis using centered moving averages, you can refer to:


Conclusion: Displaced Moving Averages
Displacing moving averages in different directions has distinct implications. Displacing the moving average to the right introduces more lag, and displacing it to the left aids in cycle analysis.
Although the basis of a displaced moving average is a simple trading indicator, it is important to understand the implications of shifting moving averages before we use them in our trading strategies.