The Renko Chart Trading Manual
By Galen Woods ‐ 6 min read
Renko charts remove market noise. Conduct big picture analysis and let your profits run easily with Renko charts that show smoothed price action.
Introduction - What is Renko Chart
“Renko” comes from the Japanese word “renga” which means brick.
Once you look at a Renko chart, you will understand why. The chart looks like a series of bricks placed at a 45-degree angle to each other.
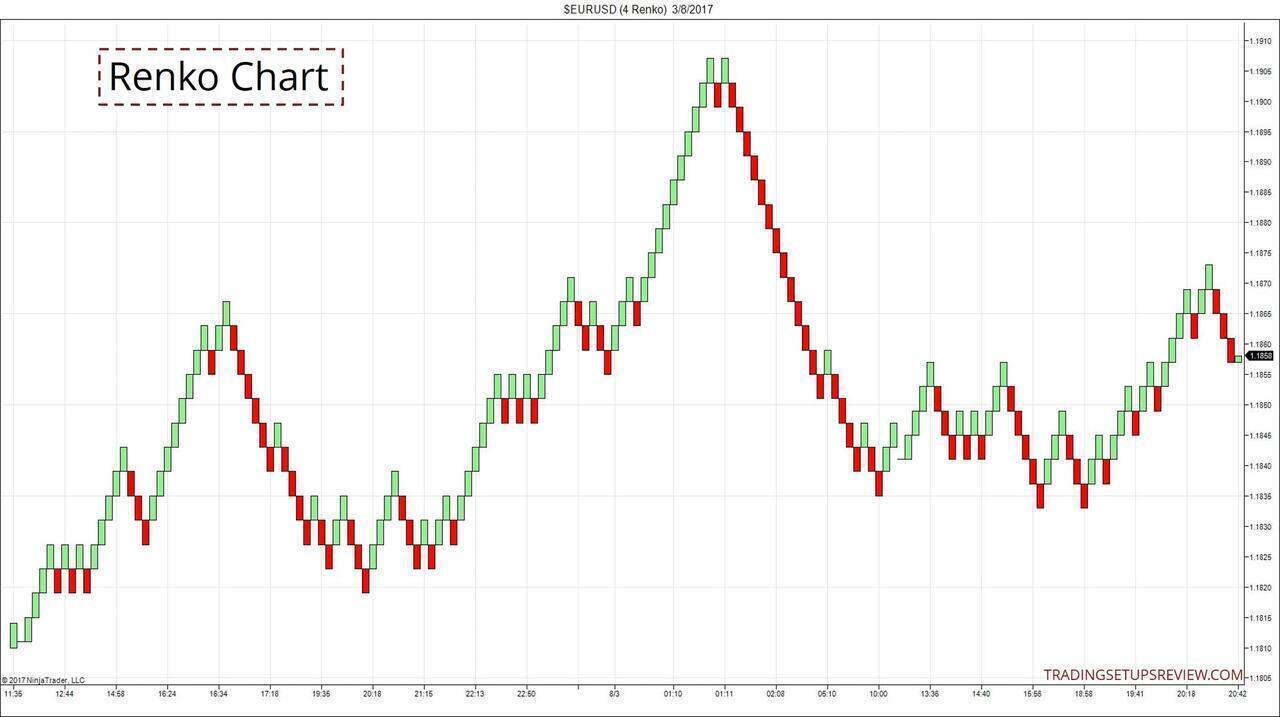
The two charts below show the striking differences between a regular candlestick chart and a Renko chart.
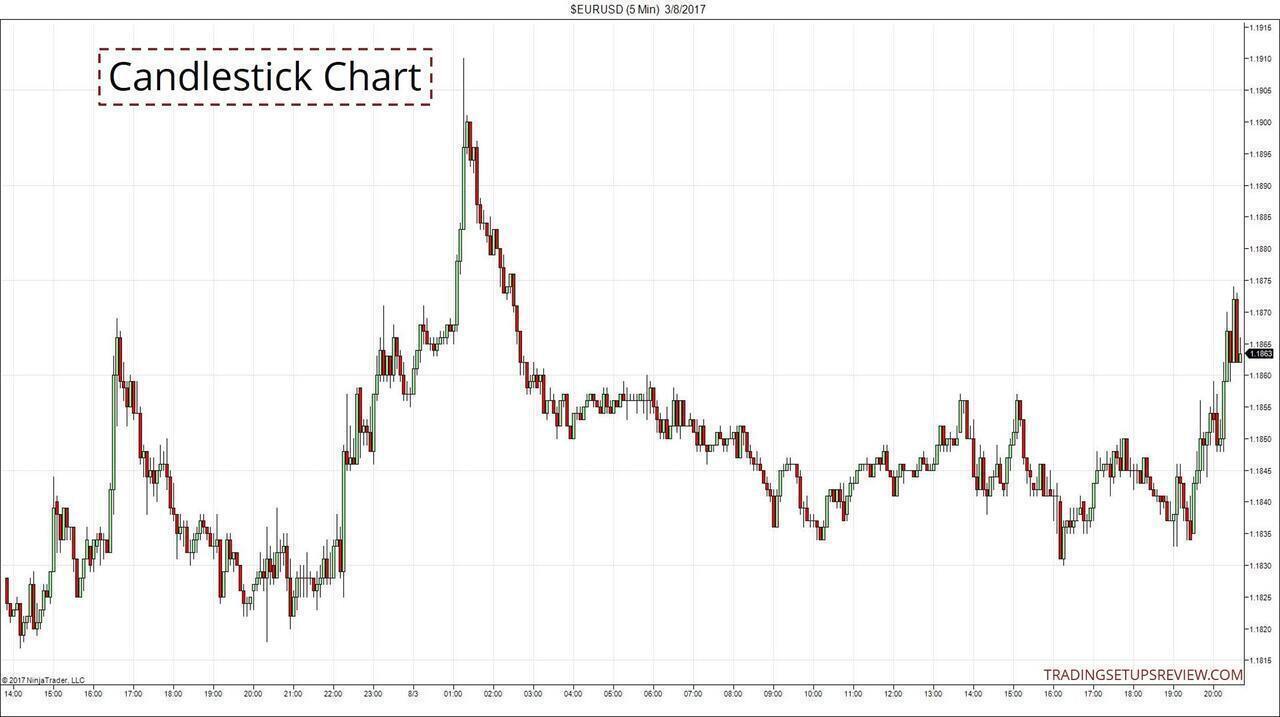
Traditional candlestick charts plot new bars as time passes. For instance, a five-minute chart will plot a new bar every five minutes.
On the other hand, a Renko chart:
- Does not depend on time
- Plots a new bar only when the market moves beyond a certain amount
Being independent of time is the defining characteristic of a Renko chart. Due to this attribute, it depends only on price action, creating a smoothed chart with less noise.
In this manual, you will learn about the benefits (and pitfalls) of this unique price action chart type.
Important: You must have a clear understanding of standard candlestick charts before proceeding. If not, click here to learn.
Renko Chart Construction
Each brick on a Renko chart is a candlestick with no shadows. Think of them as Marubozus with the same range.
You need only one key parameter for Renko charts - brick size.
The brick size is the price range that the market must cover before a new brick is plotted. You can set the brick size in pips, ticks, or cents, depending on the market.
However, for a Renko chart to reverse, price action must reverse by at least two brick sizes.
Refer to the example below for clarification.
Renko Chart Construction Example
Brick Size = 5 pips
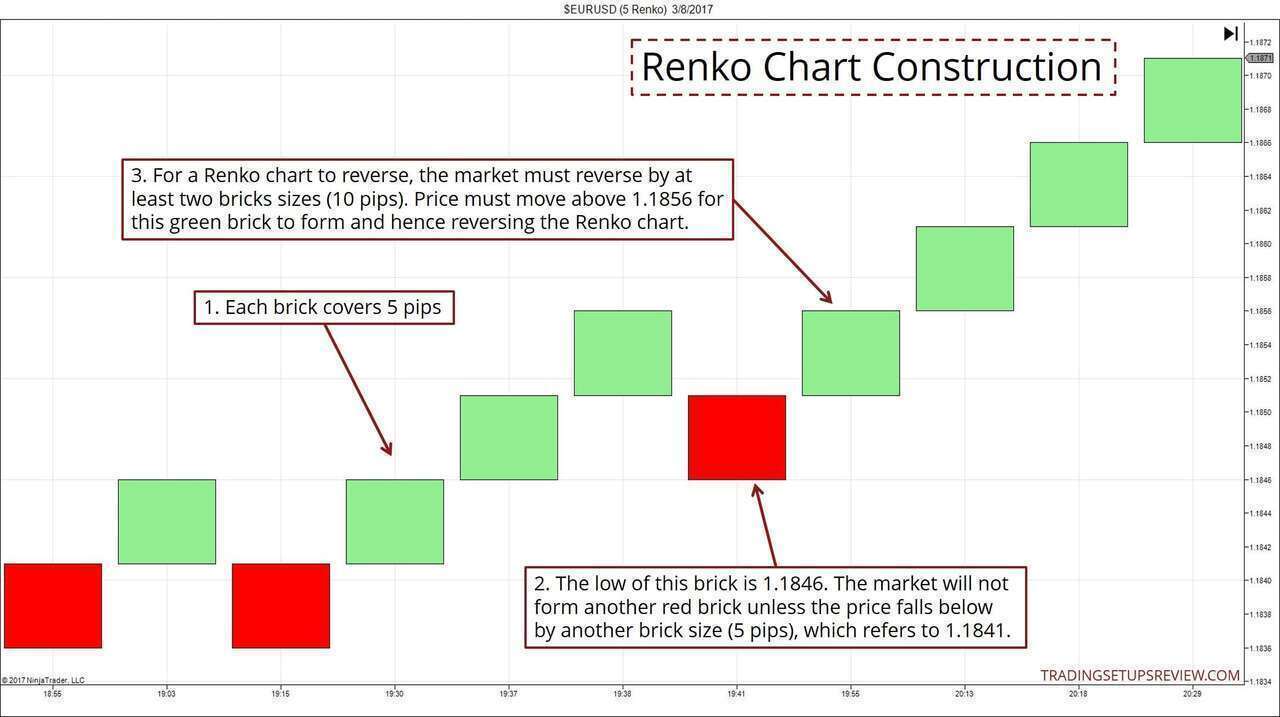
- Each brick covers five pips.
- The low of this brick is 1.1846. But this does not mean that the market did not fall below 1.1846. This is because a Renko chart will not form a new brick unless the preceding brick is exceeded by at least a brick size. (i.e. 1.1841)
- For a Renko chart to reverse, the market must move in the opposite direction by at least two brick sizes, which is ten pips in this case.
Setting the Brick Size
Since the brick size is the only parameter, the efficacy of your Renko chart is highly dependent on it.
Hence, you should pay attention to the three methods used to set this parameter.
- Fixed Amount
- Fixed Percentage
- Average True Range
#1: Fixed Amount
Using a set number of ticks/pips/cents as the brick size is the simplest method.
But unless you are already familiar with the market, it’s challenging to arrive at a suitable figure. You need some trial and error here.
Be careful not to use a brick size that’s too small. If your brick size is too small, the Renko chart will be volatile. As a result, it loses its intended effect of smoothing price action.
#2: Fixed Percentage of Price
This is a straightforward yet dynamic method. It is simple to set up and is based on the price of the stock (or forex or futures).
Swing traders often use 1% of the stock price to set up their Renko charts.
#3: Average True Range (ATR)
You can also use the ATR as your brick size. The advantage of this method is that it factors in changes in price volatility.
A typical value is the 14-period ATR.
The main drawback of this approach is that it’s harder to set up. If your charting platform does not allow a dynamic input for brick size, you might need to code it up yourself.
How To Harness The Power Of Renko Charts
If you are new to Renko, you should observe both normal candlestick and Renko charts together.
This side-by-side study will highlight the pros and cons of a Renko chart.
Due to its smoothed nature, Renko charts are useful for:
- Identifying demand and supply zones
- Letting your profits run
- Confirming breaks of support and resistance
The examples below demonstrate these properties.
Renko Chart Trading Examples
Example 1: Identifying Demand and Supply Zones
With the bricks on a Renko chart, you can spot price clusters quickly. These clusters are great demand and supply zones.
A simple guideline is to look for boxes formed by alternating bricks within a price range.
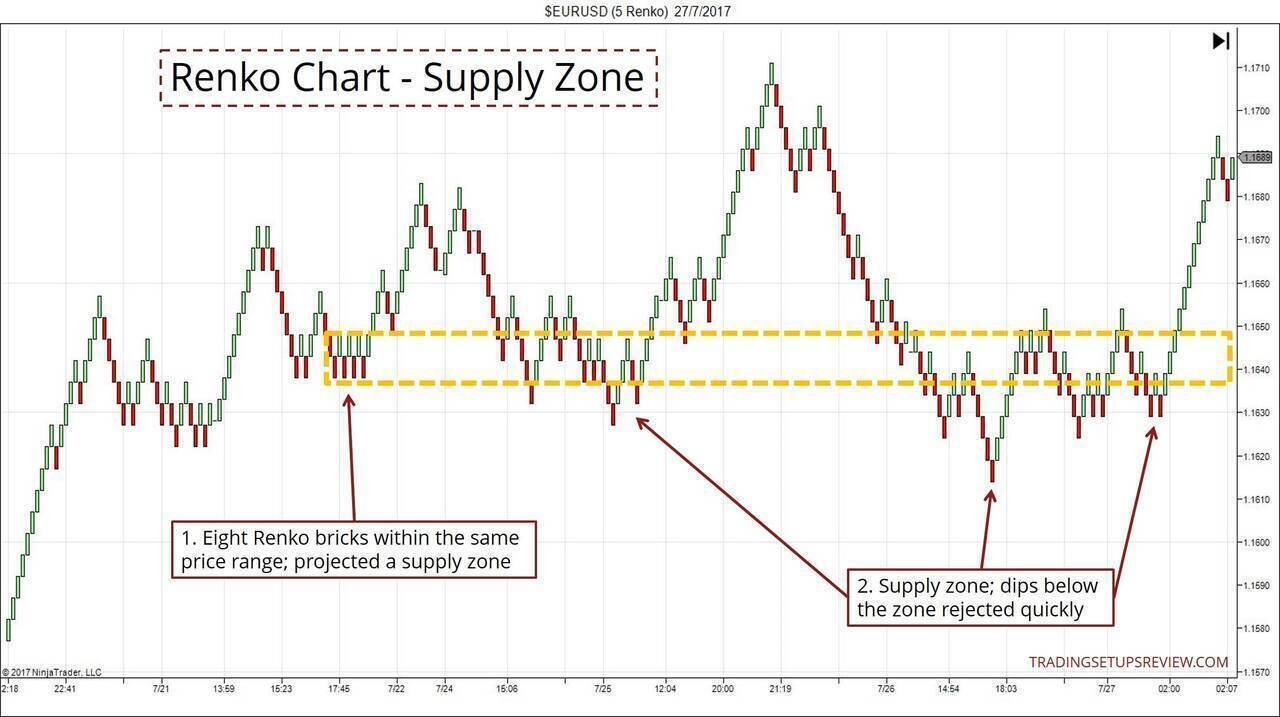
The example above shows how a Renko chart highlighted an effective supply zone.
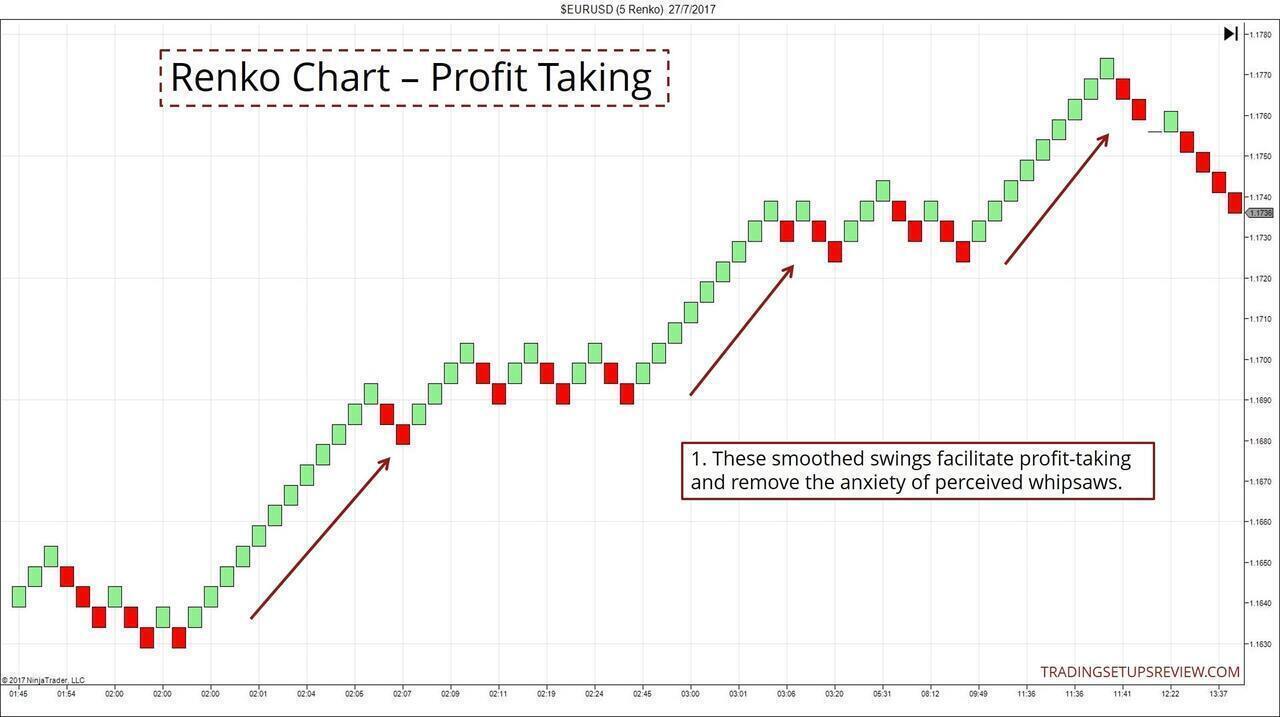
Example 2: Letting Your Profits Run
Taking profits is often stressful due to market noise. You will find the smoothness of a Renko chart helpful here.
Example 3: Confirming Breaks of S/R
When the market breaks an S/R, you need to decide if the break is valid (i.e. the S/R has failed) or if it is just a test of the S/R.
This decision is tricky.
But as a Renko chart eliminates noise from the chart, it’s easier to evaluate a break of an S/R. A rule of thumb is to look for an entire brick beyond the S/R.
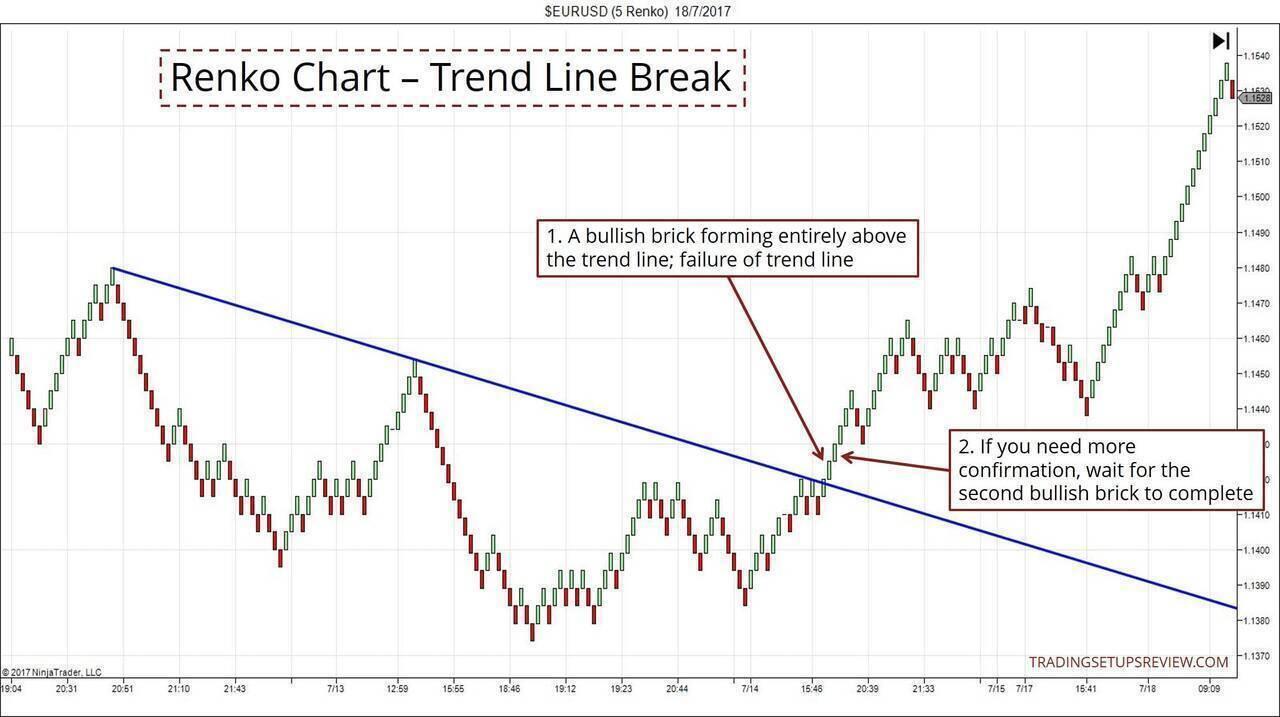
The chart above example shows the break of a bear trend line.
Two Unique Characteristics of Renko Charts & Their Implications
#1: Not based on time but price action
Candlestick charts are updated at fixed intervals. So you know when to check your charts to update your analysis.
However, for Renko charts, you need to check on the chart constantly. If not, consider setting audio alerts to remind you to review the chart when a new brick forms.
#2: Does not show the actual market price
Since a Renko chart shows smoothed price action, it’s not reliable for placing trades. You should always refer to a regular price chart for actual trading.
A Renko chart does not display OHLC information. Hence, you cannot make use of short-term price patterns (bar and candlestick patterns).
However, Renko charts work well with chart patterns.
In a nutshell, Renko charts are suitable for big picture analysis. But fine tuning entries is not its strength. For that, traditional candlestick charts are superior.
Trading Platforms With Renko Charts
Renko chart is not a standard feature on most charting platforms.
But don’t worry if your platform cannot plot Renko charts. You can check out the following platforms.
Ninjatrader 7 and 8 - The charts in this article are created by NinjaTrader 7 which is free for simulation trading. NinjaTrader 8 is the latest version. (You need access to tick data to plot Renko charts.)
TradeStation - A popular trading platform that offers reliable Renko charting.
Stockcharts.com - Free with paid options. Click here and select SharpCharts. Then follow Chart Attributes » Type » Renko.
TradingView - My favorite online charting platform. User-friendly with Renko charting ability.
Renko and Beyond
- 10 Chart Types You Must Know - covers ten chart types including five price-based chart types like Renko
- Renko with Moving Average
- Renko with MACD and CCI
- Steve Nison’s Beyond Candlesticks - a candlestick expert’s guide to exotic Japanese trading methods including Renko charts
Finally, remember that you must master regular candlestick analysis before exploring Renko charts.
If you’re looking for a structured price action education, check out my course here.