How I Trade With Only The 2-Period RSI
By Galen Woods ‐ 5 min read
The 2-Period RSI popularized by Larry Connors is a robust tool for finding meaning reversion trades. Learn the trading rules we use for this one indicator.
“Even though we do not suggest using only one indicator, if one had to, the 2-period RSI would be the indicator.”
-Larry Connors in How Markets Really Work
Larry Connors is an experienced trader and publisher of trading research. Together with Linda Raschke, he wrote the book, Street Smarts, which is a solid collection of trading strategies including the Holy Grail.
What is so fantastic about the 2-period Relative Strength Index (RSI) that a well-regarded trader like Larry Connors would suggest it as “the one” indicator?
Let’s find out.
Trading Rules - 2-Period RSI Strategy
Coupling an oscillator with a trend indicator is the usual approach.
For instance, Connors recommended the 200-period moving average, and StockChart.com did just that in their RSI2 examples.
However, I added a twist to this fast oscillator. Let’s do away with a separate trend indicator, and let the 2-period RSI clue us in on the trend. I always enjoy putting less on my charts.
The 2-period RSI (like the 2-period ADX) is extremely sensitive. We expect the 2-period RSI will give many overbought signals during an uptrend. Of course, most of these overbought signals will fail because the 2-period RSI is not meant for locating significant reversals.
So, when an overbought 2-period RSI actually succeeds in pushing the market down, we know that a downtrend has begun.
Apply the same logic to oversold RSI signals in bear trends to alert us to the beginning of bull trends.
Long Setup
- 2-period RSI falls below 5
- Price breaks above the higher swing high that formed just before the RSI signal (confirmation of bull trend)
- 2-period RSI drops below 5 again
- Buy on break of the high of a bullish bar
Short Setup
- 2-period RSI goes above 95
- Price breaks below the lower swing low that formed just before the RSI signal (confirmation of bear trend)
- 2-period RSI rises above 95 again
- Buy on break of the low of a bearish bar
To sum up, we look for two RSI signals. The first one to show us the trend, and the next one to show us trade.
2-Period RSI Trading Examples
Winning Trade - RSI Oversold
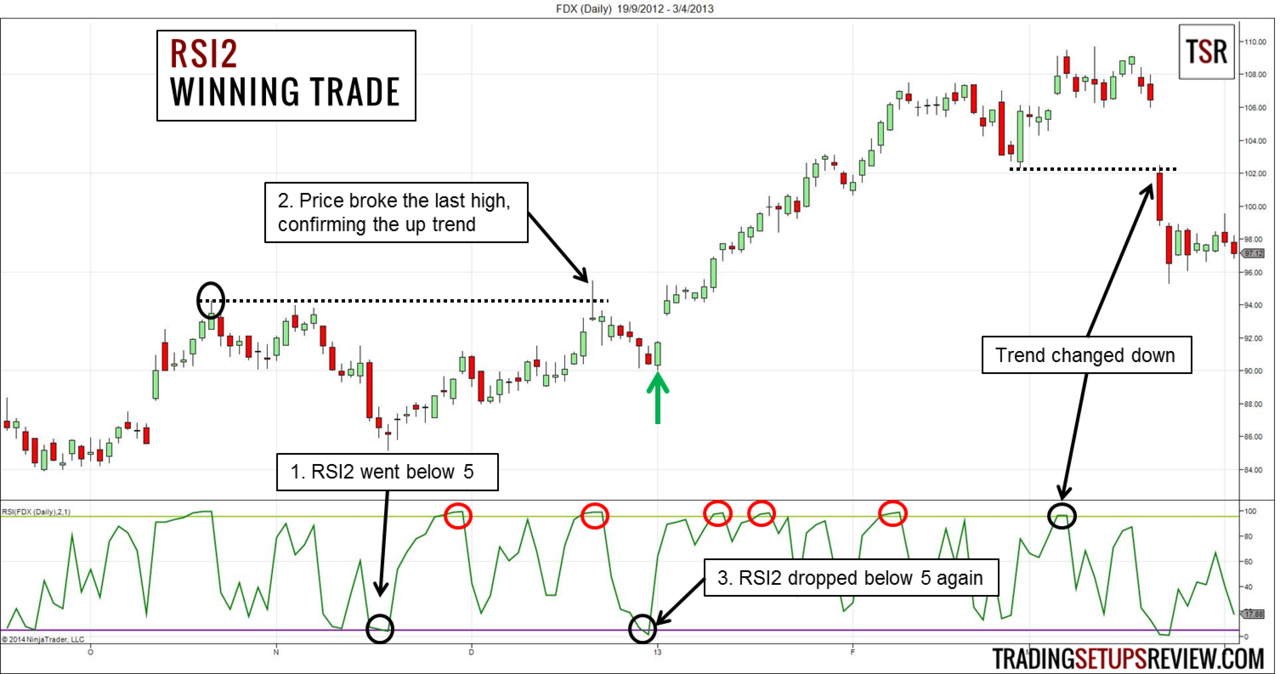
This chart shows the daily prices of FDX. The lower panel shows the 2-period RSI indicator with overbought and oversold levels set at 95 and 5 respectively.
- The RSI dropped below 5. That was our signal to look for the last higher high. We marked it with the dotted line and observed it.
- Price moved up and broke the resistance level. The 2-period RSI oversold signal was credible. Although we did not take this oversold signal, its success confirmed that the market is now in an upward trend. Time to look for a tradeable signal.
- The next 2-period RSI signal came quickly as it dropped below 5 again. We bought as price gapped above the bullish bar marked with a green arrow. It was an excellent long trade.
To clarify how we figure out trend changes in this strategy, I’ve marked out the RSI overbought signals that failed to push the market down in red. These failures are common in a bull trend.
However, the last overbought signal circled in black sent the market down below the previous lower swing low. The market bias has changed from bullish to bearish.
Losing Trade - RSI Overbought
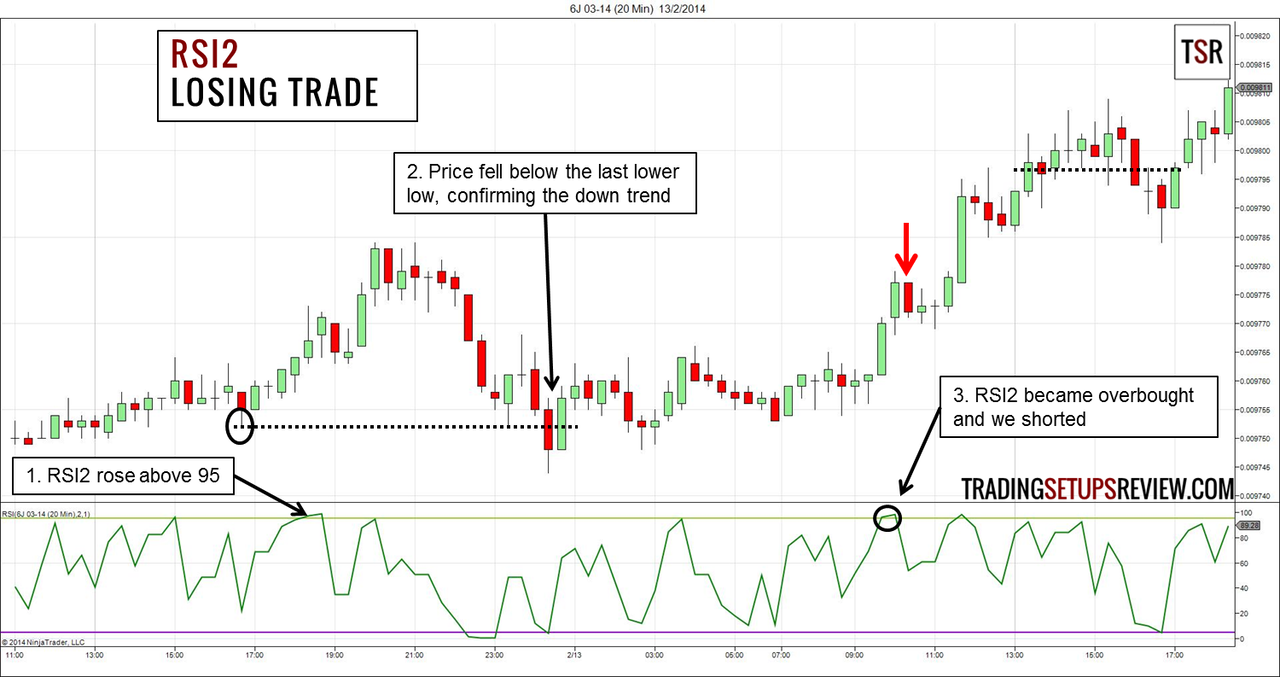
This chart shows the 6J futures with 20-minute bars and a less rosy picture.
- The 2-period RSI rose above 95, and we started paying attention to the last major pivot low.
- 6J fell below the support level and confirmed a change of trend. We began looking for overbought signals for short trades.
- The RSI overbought signal came, and we shorted below the bearish inside bar. Price stopped out our position within an hour.
Compare the price action surrounding the first RSI signal in both examples. The quality of the first RSI signal shows us if the impending trend change is genuine.
In the winning trade, the first oversold signal was reliable, and the price rose up to break the resistance without hesitation. It showed great bullish momentum which supported our trade.
However, in the losing example, the first overbought signal did not reverse the price immediately. Instead, it rose up further to make a higher high before falling through the support level. This RSI signal is inferior. Hence, the trend change it signaled is less reliable.
Review - 2-Period RSI Trading Strategy
I had fun with the 2-period RSI. It is an instrumental version of RSI that you can add to your trading toolbox.
Varying Indicators: 2-Period ADX
I find value in this trading tool as it highlights where price action gets interesting.
The 2-period RSI finds potential short-term tipping points of the market. And according to whether the market tips or not, we form our market bias and get our trading signals.
According to our trading rules, we are looking for one strong oversold signal to confirm the uptrend, before we buy the next oversold signal.
What this approach implies is that one good trade is more likely to be followed by another good trade. Statistically speaking, we are depending on the serial correlation of successful signals, a useful concept in trending markets.
Our method of using the 2-period RSI to find trend changes works best when you are trying to catch the end of a well-established trend.
Larry Connors’ research comes with performance statistics. And the statistics of the RSI2 back-testing in his book looks excellent. If you feel tempted to trade it mechanically, think again because the results are historical.
However, his book, How Markets Really Work, is a great read. It has back-test results of trading strategies and price action behavior, including highs/lows, VIX, put/call ratio and more. It presents the results clearly in nice tables to show you how markets really work.
Read it for the complete answer to why Connors recommends the 2-period RSI.

(Connors has recently come up with ConnorsRSI, something I look forward to reviewing. If you want to move ahead, you can get more information here.)
Confused by multiple complex indicator entries? Take advantage of this two-bar pattern to simplify your trade entries.