How To Find Pullback Trade Zones With Heiken-Ashi Candlestick Chart
By Galen Woods ‐ 6 min read
Learn how to use the Heiken-Ashi candlestick chart as a powerful tool to find pullback zones for low-risk entries to take advantage of market trends.

Pullback trading is popular among technical traders due to its simplicity. And you can use Heiken-Ashi candlesticks to make it even simpler. In this tutorial, you will learn how to read Heiken-Ashi to find optimal zones for pullbacks.
The Heiken-Ashi candlestick chart is not a tool I use regularly. But, over the years, I’ve noticed several practical uses of Heiken-Ashi. Here, you’ll learn about one such Heiken-Ashi method for trading pullbacks.
Heiken-Ashi candlesticks offer traders a way to smooth price action. While Heiken-Ashi removes some price details, it helps to highlight key features. (We will not cover the calculation basics of Heiken-Ashi candlesticks here. You can learn them from this article.)
An Important Question For Trading Pullbacks
At which point does the pullback end?
- If your guess is early, you will enter before the pullback ends. Hence, your position will suffer more adverse movement. If your stop-loss is not wide enough, you will be stopped out.
- If your guess is late, you might enter at an inferior price as the trend has already resumed.
There is no perfect solution here. But we are always on the lookout for useful tools to help us gauge the end of a pullback.
The Heiken-Ashi Foundation
Here, let’s see how Heiken-Ashi performs in helping us locate the end of a pullback.
Before we dive into the guidelines for this method, there are two Heiken-Ashi patterns you need to watch out for here.
- Bearish Shaved Head - Bearish candlestick with a shaved head.
- Bullish Shaved Bottom - Bullish candlestick with a shaved bottom.
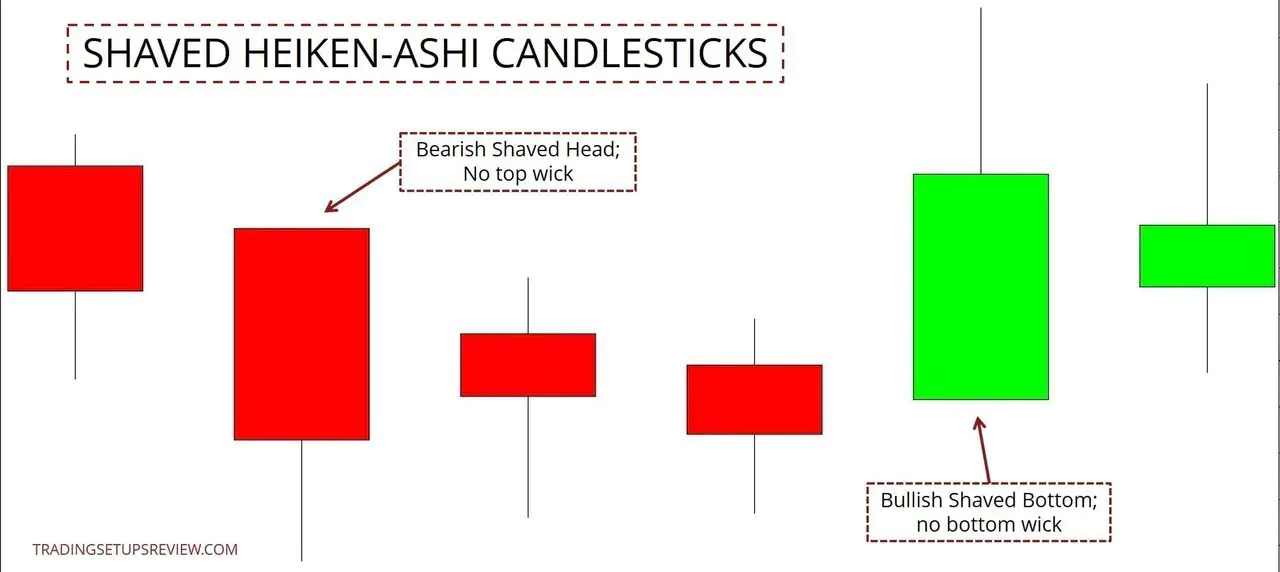
These shaved Heiken-Ashi candlesticks represent price momentum.
Make sure you learn these patterns before proceeding.
Guidelines For Finding Pullback Zones With Heiken-Ashi Charts
Let’s cover the guidelines by going through an example.
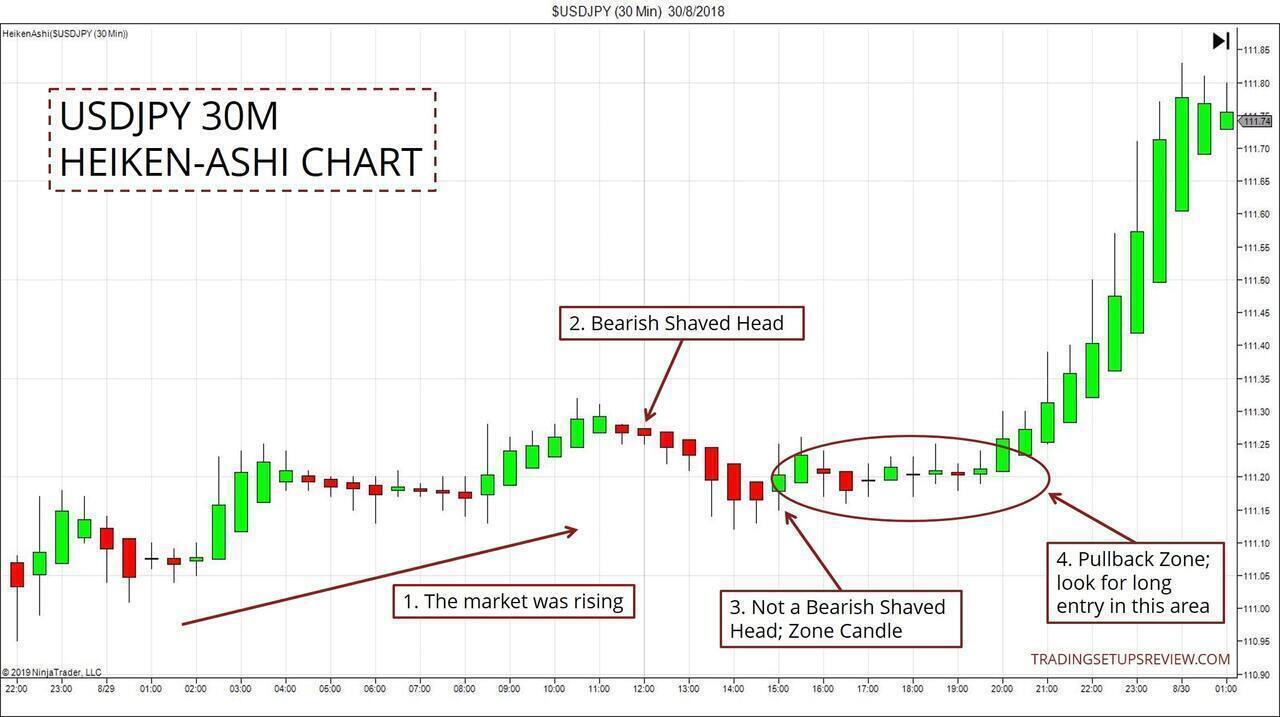
- In the context of a bull trend, once you see a pullback down, wait for a Bearish Shaved Head.
- This is the Bearish Shaved Head we are waiting for. It confirms downward momentum in the pullback. (If you’re wondering, the preceding candlestick has a short top wick. It is not apparent without zooming in.)
- Then, look out for the first subsequent candlestick that is not a Bearish Shaved Head. This candlestick is the Zone Candle. It signals that the downward momentum has paused/stopped, hinting at the end of the pullback.
- This Heiken-Ashi method does not tell us exactly when to enter. This is why you should see the Zone Candle as a tool for projecting a pullback zone.
A zone does not provide a trigger. Instead, it tells us to get ready for the end of a pullback. It prepares us to join the market as the trend resumes. The Zone Candle gets us into the zone.
The final part of this strategy is to look for price action entries around the level of the Zone Bar. It can be a simple formation like the bullish two-bar reversal pattern.
For this, let’s refer to the corresponding standard candlestick chart below.
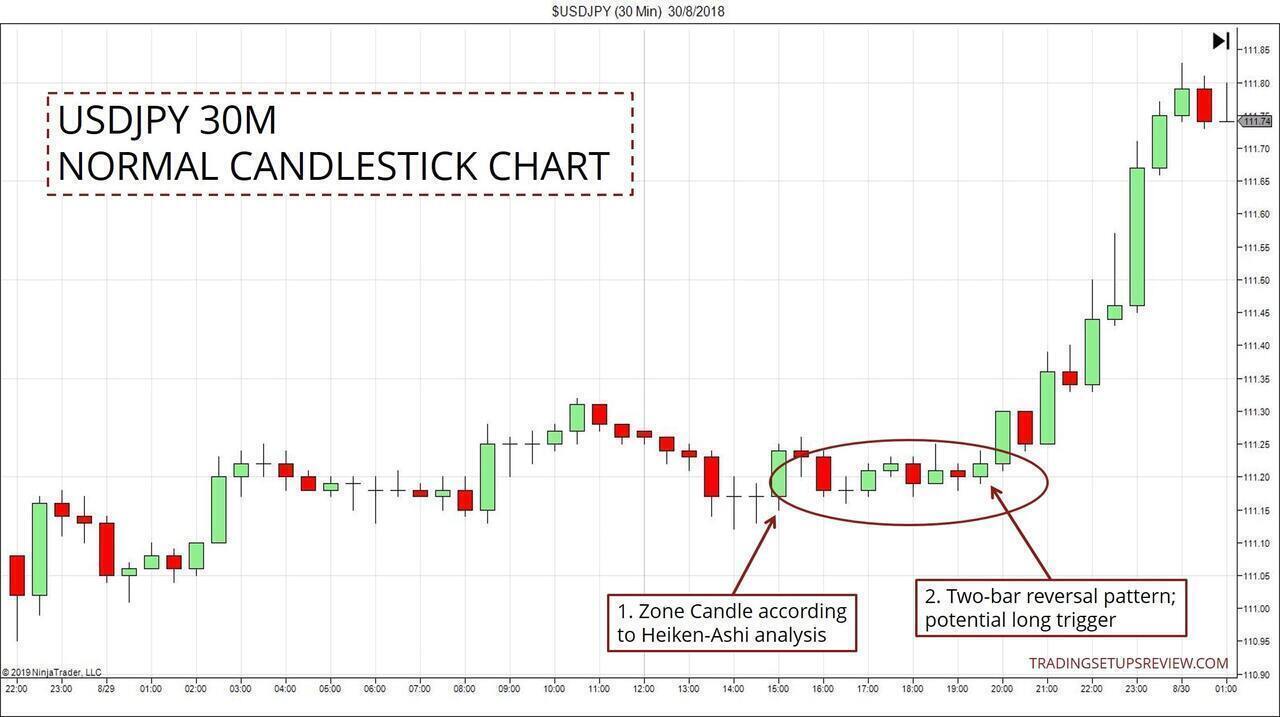
- This is the Zone Candle according to our Heiken-Ashi analysis. Look for a pullback entry within the zone projected by this candlestick (as circled).
- This bullish two-bar reversal was a candidate for entry. There was an earlier two-bar reversal, but its setup bar was not triggered.
Note: Heiken-Ashi charts do not represent real tradeable prices. Always refer to the actual candlestick or bar charts when executing your trades.
Heiken-Ashi Pullback Zone Examples
Let’s look at two more trading examples that are not as neat and pretty, but with great learning points.
For each example, we will first look at the Heiken-Ashi chart to find the Zone Candle. After that, we will switch to the usual candlestick chart to find potential entries.
Example #1 - AMD
Heiken-Ashi Chart
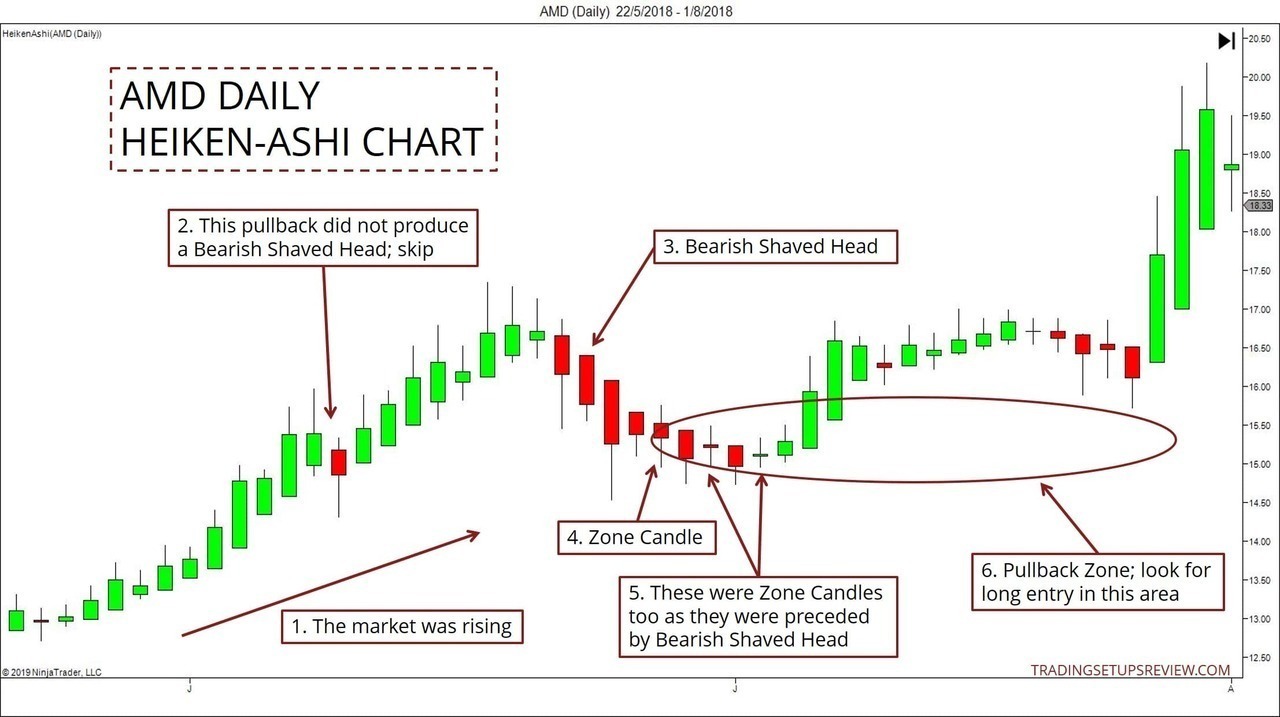
- The market bias was bullish.
- This pullback did not produce a Bearish Shaved Head. Hence, it was not of interest.
- This Bearish Shaved Head confirmed downward momentum. It set the stage for a potential long pullback trade.
- This candlestick, with its top wick, terminated the series of Bearish Shaved Heads. Hence, it was a Zone Candle.
- Each time a Bearish Shaved Head is not followed by another Bearish Shaved Head, a Zone Candle forms. Hence, like what’s shown here, you can get multiple Zone Candles within a retracement. In fact, numerous Zone Candles clustered together increases our confidence.
- The price area covered by the Zone Candles was our pullback zone. To pick specific trade triggers for a long setup, refer to the regular candlestick chart below.
Normal Candlestick Chart
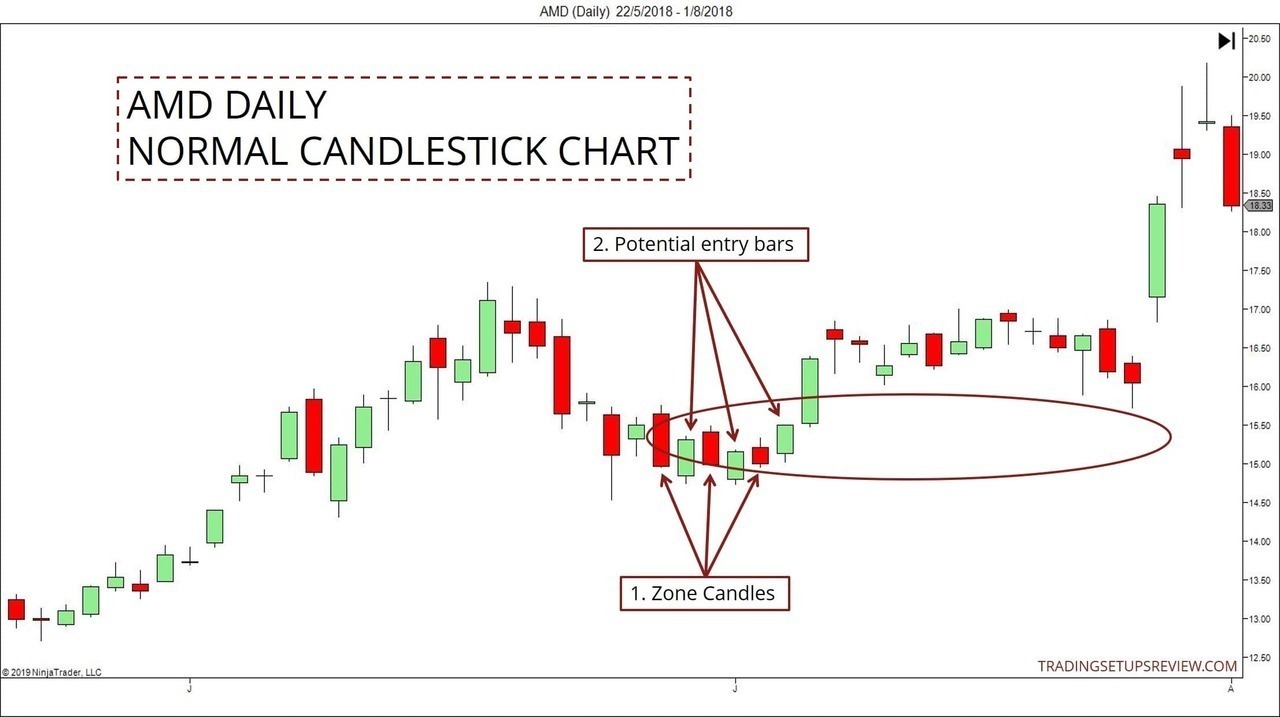
- These are the Zone Bars as identified via our Heiken-Ashi chart.
- For a start, try examining any bullish bar pattern as a potential entry.
Example #2 - PG
Unlike the first two charts, this one shows a short pullback trade within a bearish trend.
Heiken-Ashi Chart
You should be familiar with spotting Shaved Head/Bottom and Zone Bars by now. So in the example, I’ve marked out the Zone Candles directly.
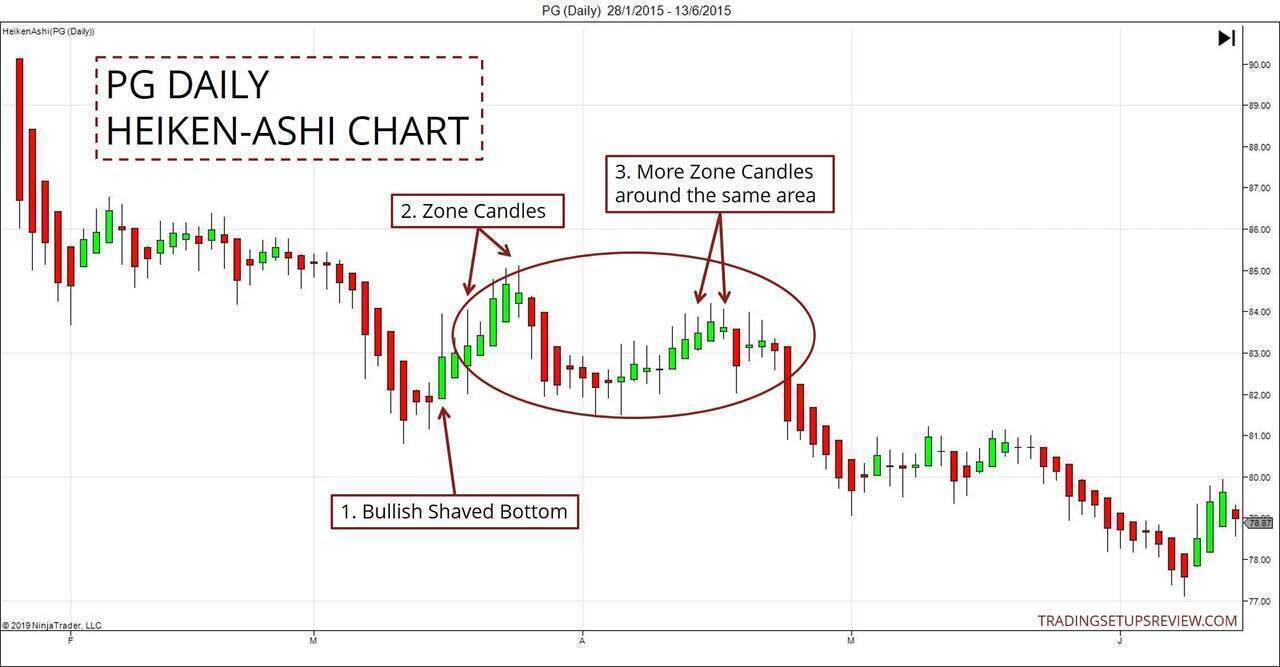
- This was a Bullish Shaved Bottom which indicated bullish momentum.
- These pauses in momentum pointed out the Zone Candles.
- It was a multi-legged pullback that seemed messy. (You can confirm this with the standard candlestick chart below.) However, the Zone Candles worked well to point out zones that contain low-risk entries.
Normal Candlestick Chart
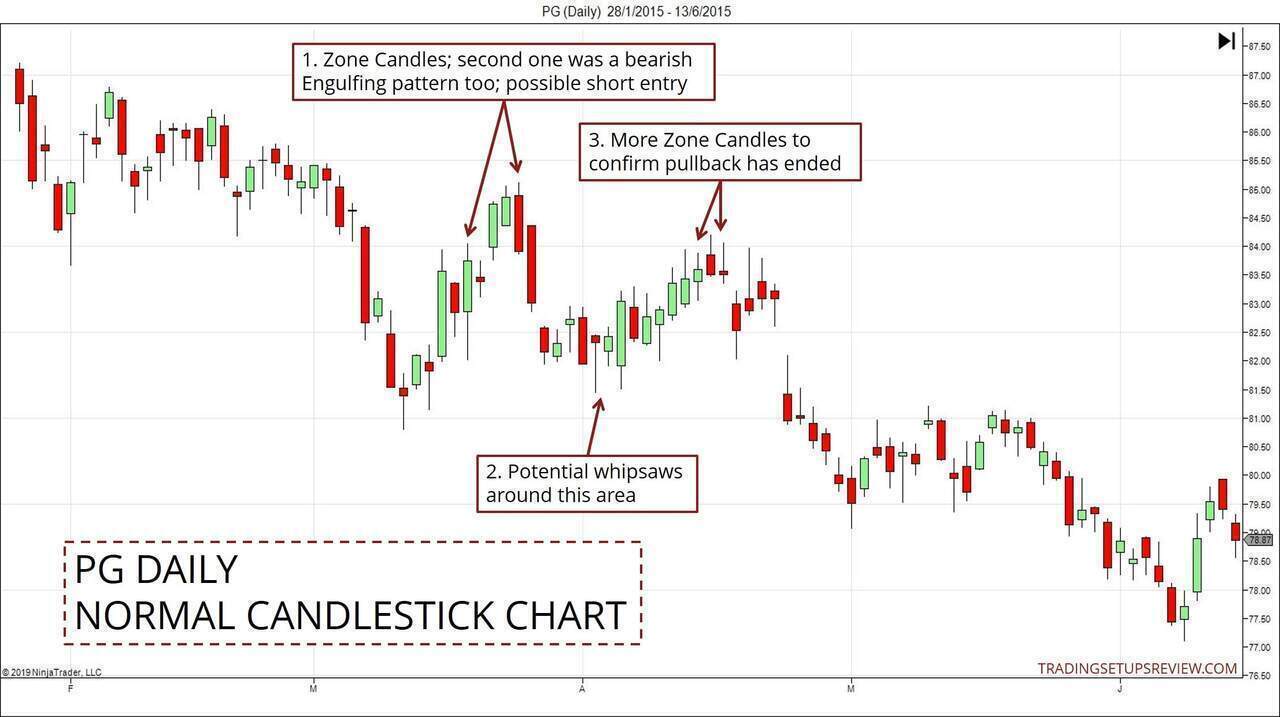
- These were the first two Zone Candles according to our Heiken-Ashi chart analysis. The second Zone Candle was also a bearish Engulfing pattern. It offered a reasonable short setup.
- This area exposed most pullback traders to whipsaws.
- However, if you had waited for later Zone Candles to form, you would have avoided the mess of whipsaws.
Heiken-Ashi Pullback Zone Trading Tips
The advantage of tracking trading zones (as opposed to triggers) is that it allows flexible entry techniques. These are a few possibilities:
- Candlestick/bar patterns - Even a simple two-bar reversal works if the context is right.
- Entry with a limit order around the middle of the identified zone - It’s a good idea to use this approach with a volatility stop-loss.
- Oscillator entries - E.g., oversold or overbought signals from Stochastic 5,3,3.
To trade pullbacks, you must first know how to determine the market bias. You can experiment with any method you prefer.
For this tutorial, I did not go into the specifics of trend determination. But in case you’re wondering, for the examples above, I used the first method described in this guide.
Finally, remember that Heiken-Ashi charts offer clarity at the expense of price action details. If you want to decipher specific price action movements, OHLC charts are essential.
OHLC charts include both candlestick and bar charts. And you can learn how to analyze them in my price action trading course.