4-Hour MACD Forex Trading Strategy
By Galen Woods ‐ 4 min read
Learn how to trade forex pairs in the 4-hour time-frame with this MACD forex trading strategy. The unique use of MACD helps to pinpoint trade entries.
Philip Nel started a thread at ForexFactory forum discussing the 4-hour MACD Forex Trading Strategy. It is an impressive forum thread. It began in 2007 and it is still active now. (It has 1338 pages and growing.)
This trading strategy focuses on finding patterns (for e.g. double top and head and shoulders) on the MACD indicator. Trading patterns off the indicator instead of price reminds me of the Woodies CCI.
(Learn: Trading with MACD)
This trading strategy uses five moving averages as support and resistance points. Set them up:
- 365 exponential moving average (EMA)
- 200 simple moving average (SMA)
- 89 SMA
- 21 EMA
- 8 EMA
We are not forgetting the namesake of this trading strategy. The settings for MACD are:
- 5 for fast EMA
- 13 for slow EMA
- 1 for the signal line
- Add horizontal lines at +0.0015, +0.003, +0.0045, -0.0015, -0.003, and -0.0045
Rules for 4-Hour MACD Forex Trading Strategy
This MACD forex trading strategy has many possible setups. Philip Nel recommended trend continuation setups for beginners. I interpreted the strategy and came up with the following trading rules to trade continuations. These rules side-stepped the need to look for chart patterns.
Long Trade
- Price is above 89 EMA
- MACD is above zero
- MACD falls
- Buy once MACD rises (if MACD is still above zero)
Short Trade
- Price is below 89 EMA
- MACD is below zero
- MACD rises
- Sell once MACD falls (if MACD is still below zero)
4-Hour MACD Forex Trading Examples
Winning Trade - Short Trade
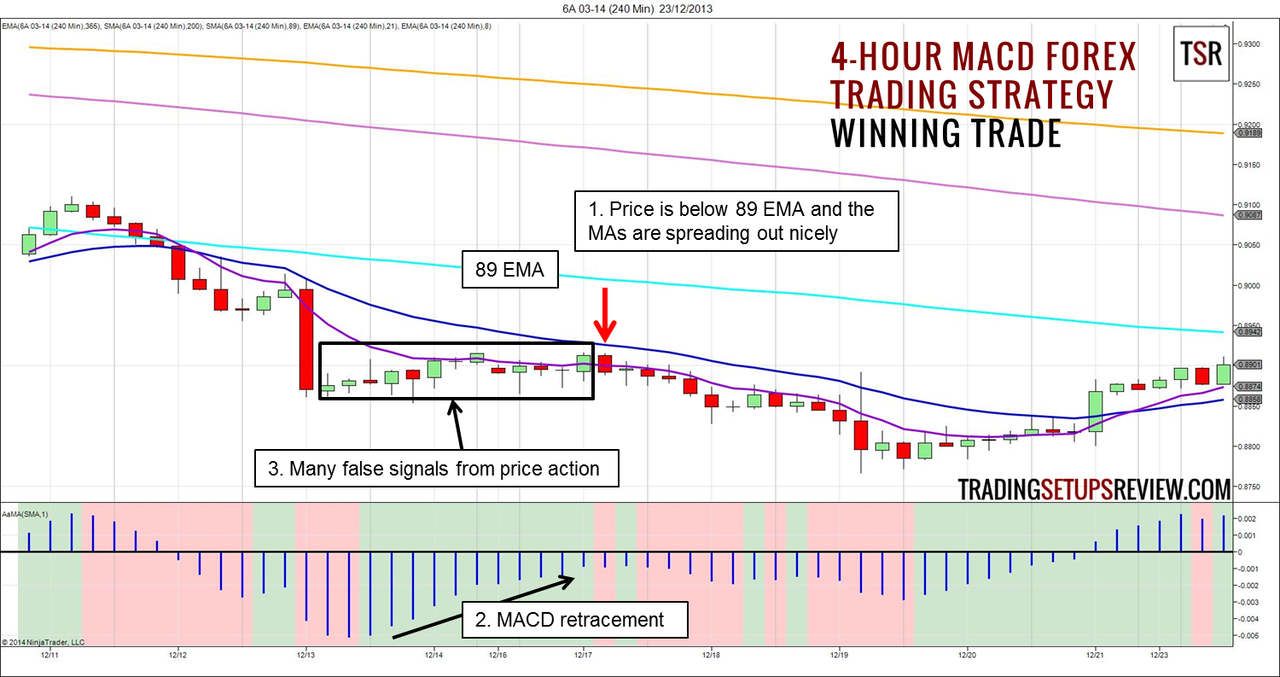
This is a 4-hour chart of the 6A futures (AUD/USD) with the five moving averages in different colors. The background color of the MACD indicator shows if MACD is increasing or decreasing. I left out the horizontal lines as we are not using them for our review.
This chart shows a trend continuation after around two days of consolidation.
- Price is below 89 EMA and the five moving averages are spreading out nicely. These are signs of a clear trend.
- Shortly after the strong bear thrust bar, the MACD started to rise. Before the MACD rose above zero, it decreased and gave us a short signal. This short trade brought the trend past the earlier extreme.
- Look at the price action during the MACD pullback. Price was in a tight trading range with narrow bars and several false break-outs. In this case, the MACD added value by uncovering the bullish momentum to keep us out of the market until the momentum turned bearish.
Losing Trade - Short Trade
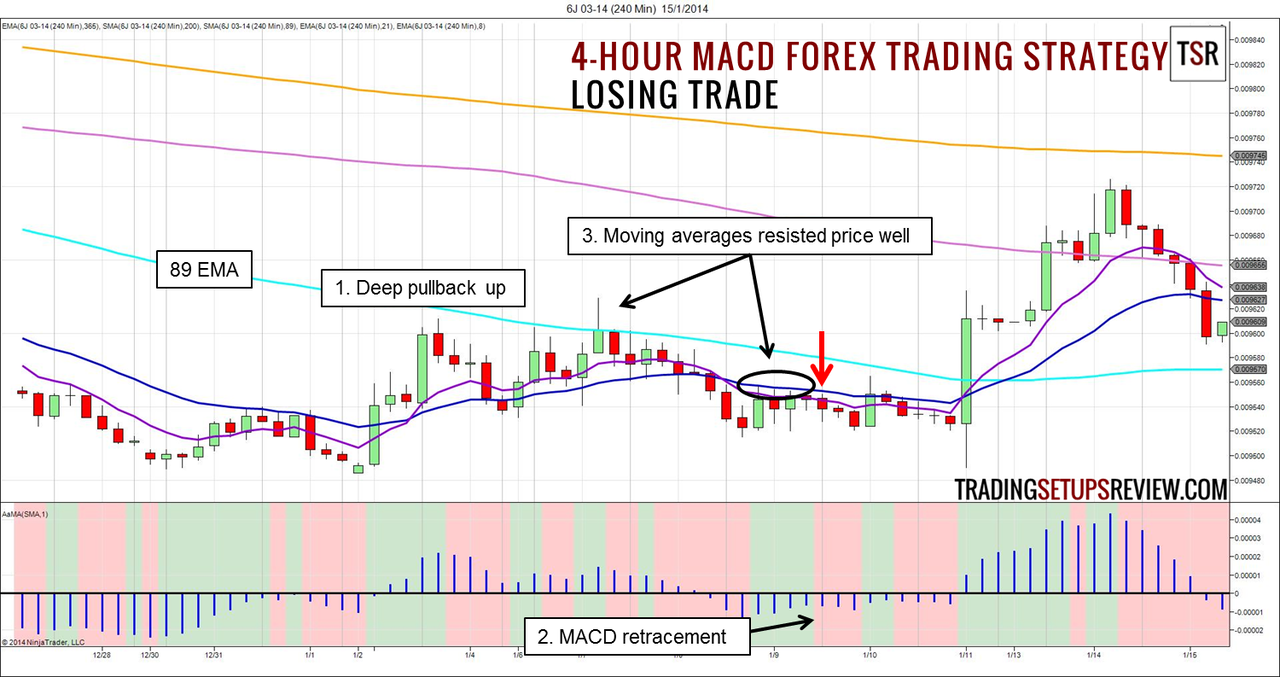
This is a 4-hour chart of 6J futures contract (JYP/USD). It shows the end of a long down trend.
- This pullback was deeper than the earlier pullbacks. As the down trend has been effective for a long period, this complex pullback was expected, and perhaps even necessary for the trend to continue.
- The MACD indicator increased as price stayed below 89 EMA.
- The moving averages rejected price down. The price action supported the short MACD signal. However, the trade did not turn out well.
Given a wider stop and a conservative target, we might have a winning trade. However, the bullish bar (three bars after entry) should have stopped out most traders.
Review - 4-Hour MACD Forex Trading Strategy
This trading strategy is a momentum trading strategy like the 5-minute MOMO trade and Elder’s Impulse System. MACD is the common denominator of these trading strategies.
However, the setting of the MACD indicator in this trading strategy removes its signal line. Essentially, the MACD has become a price oscillator.
Also, the five moving averages are too much for me. While they offer a support and resistance framework, they clutter the charts.
Nonetheless, this strategy is effective in picking up retracement trading setups. It gives a decent starting point for momentum trading on higher time-frames. (4-hour and above)
The 4-hour time-frame is unique to forex markets as it splits a 24-hour session into 6 bars. To have more fun with this strategy, try it on the daily chart.
In our review, we focused on trading trend continuations. Avoid MACD signals near or beyond the last extreme of the trend. This is because this strategy makes use of the principle of momentum preceding price. If price has already gone beyond the last trend extreme, then the price has already caught up with momentum. The sweet spot of our trade timing is gone.
Remember that this trading strategy presents far more opportunities than the continuation trades we looked at. The thousand-page forum thread has everything you need to learn about this trading strategy.
In particular, look out for Philip Nel’s trade management advice. He scales into a position if the stop-loss is too far away to cut his overall risk. It’s an interesting idea to explore.
Afraid that your strategy will fail in other time-frames? Learn a simple two-bar pattern that you can find on all time-frames.