This website or its third-party tools use cookies which are necessary to its functioning and required to improve your experience. By clicking the consent button, you agree to allow the site to use, collect and/or store cookies.
Please click the consent button to view this website.
I accept
Deny cookies Go Back
  • Price Action Trading Course
  • Trading Setups
  • Topics ↓
    • Price Action Trading
    • Day Trading
    • Trader Development
    • Site Map
  • TSR Trading Guides
  • Trading Resources
    • Trading Journal Software
    • Our Partners
    • Support Us
  • Member Login

Trading Setups Review

Trading Strategies, Guides, and Articles for Active Technical Traders

Forex Tester 5 - Software for traders by traders

You are here: Home / Trading Setups / Camelback Trading Technique

Camelback Trading Technique

By Galen Woods in Trading Setups on January 6, 2014

The Camelback trading technique comes from Joe Ross’ trading manual. Its uses a moving average channel and an exponential moving average to keep traders on the right side of the market.

Trading Rules – Camelback Trading Technique

Long Trading Strategy

  1. Price is above the 40-period moving average of bar highs
  2. Slope of 15-period exponential moving average is not flat or negative
  3. Wait for a bar with a lower low (signal bar)
  4. Buy one tick above signal bar

Short Trading Strategy

  1. Price is below the 40-period moving average of bar lows
  2. Slope of 15-period exponential moving average is not flat or positive
  3. Wait for a bar with a higher high (signal bar)
  4. Sell one tick below signal bar

Camelback Trading Examples

Winning Trade – Bullish Setup

Camelback Trading Winning Trade
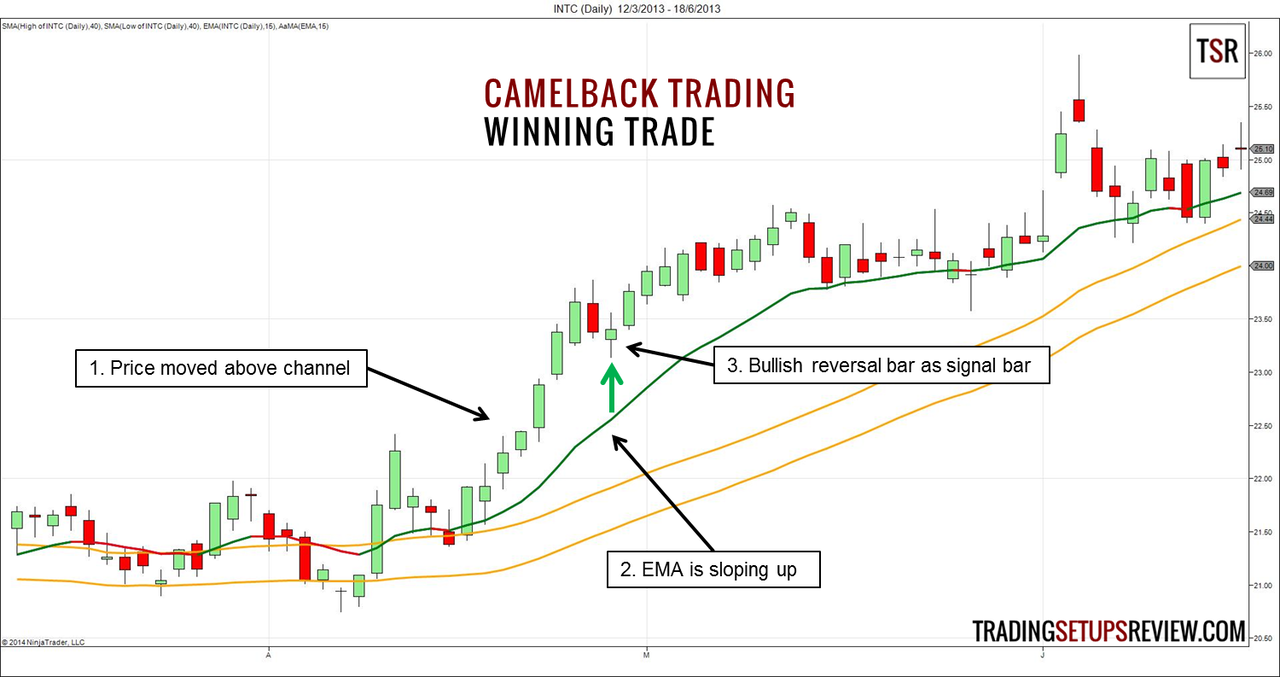
This daily chart of Intel Corp shows a long Camelback trading setup after a strong up thrust.

  1. Price rose above the 40-period moving average channel and moved far beyond it. The seven consecutive bullish bars point out the obvious upwards momentum.
  2. The exponential moving average should keep us out of sideways market. It is sloping up nicely as expected.
  3. The signal bar was also a bullish reversal bar and gave us a great entry into a long trade.

This was the first trade after price moved above the channel. For continuation trading strategies, the first trade has higher odds of success.

Losing Trade – Bearish Setup

Camelback Trading Losing Trade
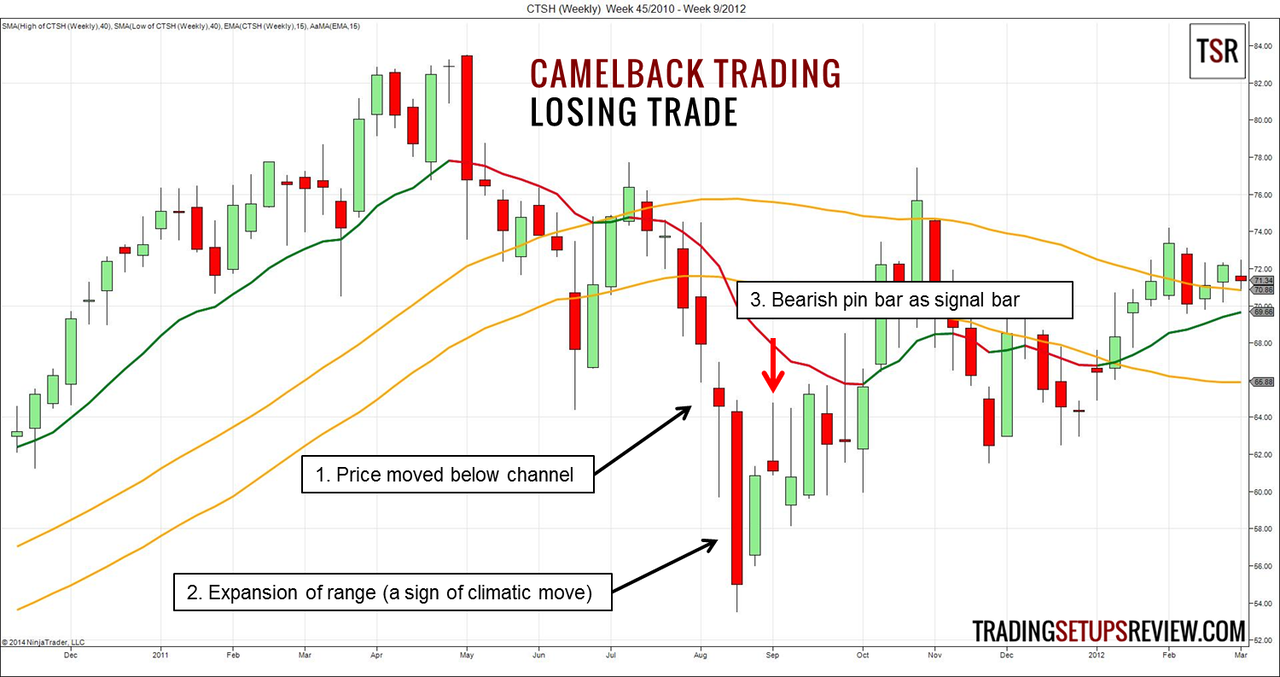
This is a weekly chart of Cognizant Technology Solutions Corp. It shows a Camelback trading setup that failed within two weeks.

  1. Price moved below the channel with strong momentum.
  2. However, there was an obvious wide-range bar, which was a sign of climatic and exhaustive moves.
  3. Following a bullish inside bar, a bearish pin bar set up the short trade. While the bearish pin bar looked good, we lost on this trade.

Review –  Camelback Trading Technique

The Camelback trading technique tries to find trending markets using two tools: the 40-period moving average channel and the 15-period exponential moving average.

Moving average channels are useful for staying out of sideways market. They turn a simple moving average into a zone of support and resistance.

(Read: Jake Bernstein’s Moving Average Channel Day Trade & DMA Channel Trading)

The 15-period exponential moving average will prevent trades when there is a slightly deeper pullback. Hence, this trading strategy is looking for shallow pullbacks in strong trends.

The tricky part of trading shallow pullbacks in strong trends is to tell strong trends apart from climatic moves. Climatic moves are signs of exhaustion and price will find it difficult to continue trending without a significant pullback.

Buying a shallow pullback after a climatic bullish move is a low probability trade. The same goes for selling a shallow pullback after a bearish climax.

How do we avoid climatic moves?

Avoid high volume bars. While impulsive moves should have increasing volume, extremely high volume is a sign of climatic moves. Also, watch out for bar range expansion. In climaxes, bar range tend to expand.

Joe Ross has a trade management strategy that involves splitting your position into three parts. You need to trade at least three contracts to put this in practice. If you want to learn more about it, you can refer to the trading manual.

Read more about Moving Average, Trading Trend

If Trading Setups Review has helped you trade better, please support us on Ko-fi.

Support me on Ko-fi

Thank you for being awesome.

You can also check out other ways to support us here.

Or, please continue exploring what we have to offer…

How To Increase Your Trading Profits by 3729% And Cut Commissions by 80%

Instantly Improve Your Trading Strategy with Support and Resistance

7 Top Audiobooks To Boost Your Trading Mindset (Get Two Audiobooks Free)

Double Top and Bottom Trading With Bollinger Bands

Eight Questions To Help You With Price Action Bar Analysis

Leave a Reply Cancel reply

Your email address will not be published. Required fields are marked *

Trading Course Banner

Search Trading Setups Review

Recommended For You

Seven Free Forex Trading Tools You Should Be Using

Flipping Support and Resistance for Swing Trading

What is the Best Day Trading Indicator?

How To Identify Demand and Supply Using Price Action

How To Map The Market With Range Bars And Volume Spikes

4 Types Of Basic Trade Setups

A Simple Way to Look at Price Action – Trend Bars

Top Trading Books

Top 10 Volume Trading Books

7 Forex Trading Books To Get You Started

18 Trading Psychology Books To Help You Trade Better

Top 10 Price Action Trading Books

7 Trading Books For Your Library


If Trading Setups Review has helped you trade better, please consider supporting us on Ko-fi.

Support me on Ko-fi

Or, check out other ways to support us here.

Thank you for being awesome.


Get a Free Course Chapter from Galen Woods' Day Trading With Price Action Course [PDF]

Plus, our latest trading guides and tips in right your inbox.

Trading Setups Review

  • Support Us
  • Contact Us
  • About Us
  • Privacy Policy
  • Affiliate Disclaimer
  • Full Risk Disclosure

Learn More

  • Day Trading With Price Action Course
  • TSR Trading Guides
  • Trading Setups
  • Trading Articles
  • Trading Books
  • Site Map

Futures and forex trading contains substantial risk and is not for every investor. An investor could potentially lose all or more than the initial investment. Risk capital is money that can be lost without jeopardizing ones financial security or life style. Only risk capital should be used for trading and only those with sufficient risk capital should consider trading. Past performance is not necessarily indicative of future results.


The website contents are only for educational purposes. All trades are random examples selected to present the trading setups and are not real trades. All trademarks belong to their respective owners. We are not registered with any regulating body that allows us to give financial and investment advice.


Trading Setups Review © 2012–2022

Anti-Climax Pattern - Free Course Chapter

Learn a new powerful price pattern today!

Download for free now.