Jjrvat's Price Action Trading Approach
By Galen Woods ‐ 8 min read
Learn to design your price action trading rules with Jjrvat's trading approach. Stop struggling and find your market perspective for long-term success.
A price action trading approach is not as specific as a setup or strategy. But it is far more useful because it offers market perspectives that will empower you to form your own strategy. In this article, you’ll learn about a scalp trading approach imparted by jjrvat on Elite Trader, a popular trading forum, back in 2008.
Bear in mind that we are discussing an approach and not a rigid setup. You can design the setup parameters yourself once you appreciate the ideas underlying this strategy.
If you read the entire forum thread, you’ll find that jjrvat’s discussion clarifies the difference between:
- Trading an indicator and;
- Using an indicator to trade price action.
Now, let’s dive into the core approach.
- The basic idea here is to have a slow-moving average to define the market’s macro direction.
- Then, use a fast-moving average to help define price waves.
- Once you perceive clear higher highs and higher lows (or lower lows and lower highs), you can determine a bullish or bearish market structure.
- From that point, try to enter the market on a pullback.
Learn: Use Market Swings and Candlesticks To Your Advantage
Trading Rules - Jjrvat’s Price-based Trading
The following rules are not set in stone. Adapt them to your trading profile.
Here, the exact parameters are secondary. Consistency is the key.
Trading Tools
- A 240-period weighted moving average (WMA) for highlighting the macro direction.
- A 21-period Hull moving average (HMA) for clarifying price waves with its slope.
The Hull moving average is a smooth moving average that works very well for tracking price swings. Learn about the HMA from its inventor: Alan Hull.
Rules for Long Trade
- The 240-period WMA is sloping up.
- The 21-period HMA highlights higher highs and higher lows.
- Wait for the HMA to start pulling back downwards.
- Go long when the price closes above the HMA.
However, if the pullback goes below the last swing low (forming a lower low), the setup becomes invalid.
Rules for Short Trade
- The 240-period WMA is sloping down.
- The 21-period HMA highlights lower highs and lower lows.
- Wait for the HMA to start pulling back upwards.
- Go short when the price closes below the HMA
However, if the pullback rises above the last swing high (forming a higher high), the setup becomes invalid.
These rules offer a focal point for your analysis. But feel free to override them if you have valid reasons to do so. In a nutshell, exercise your discretion as a trader.
Valid reasons are often rooted in your price action observations. You’ll see examples of it below.
Trading Examples - Jjrvat’s Price-based Trading
Before we move on to the chart examples, let’s address a sticking point.
In the examples below, we apply this approach to the daily (and even monthly) timeframes. But isn’t this a scalping setup? How does this work?
Here, the idea of a scalp is to capture a single price wave. You can apply it regardless of your trading time frame. This premise will also guide us in our profit-taking.
Read: 15-Minute Opening Scalp Trade
Example #1: FDAX 3-Minute
This is an intraday trading example from the German FDAX contract.
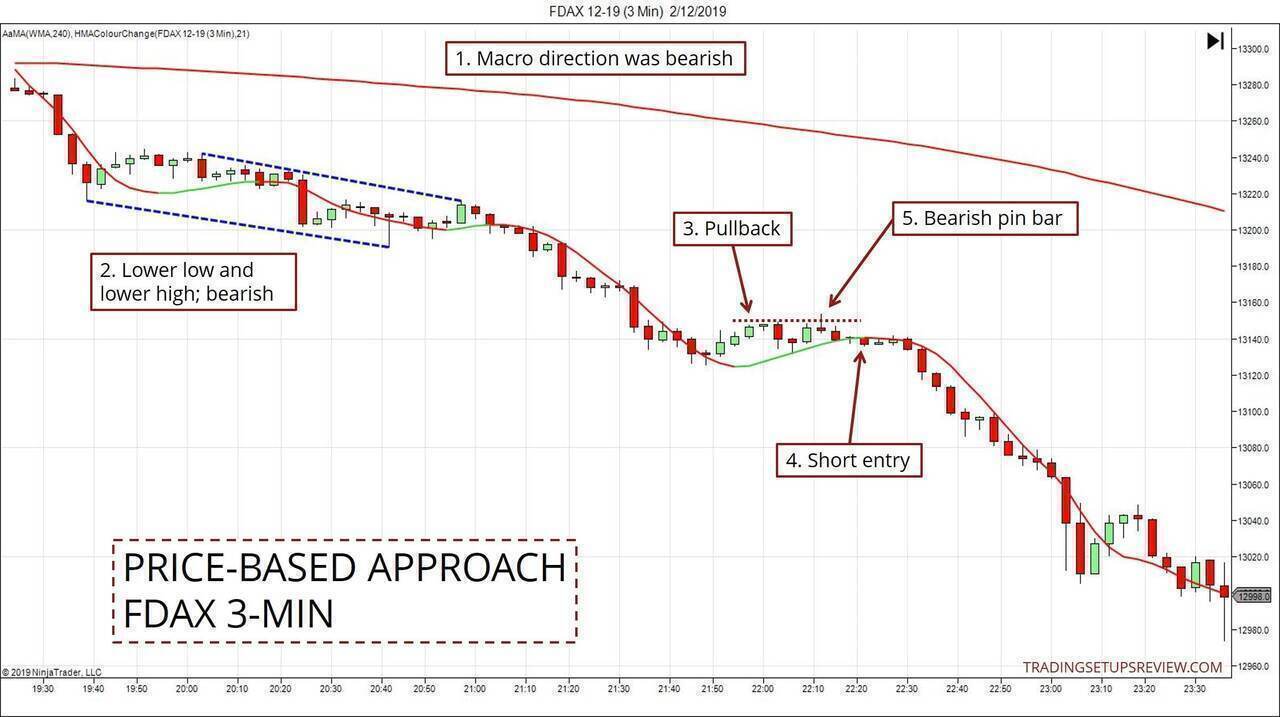
- The WMA was sloping down and pointed to a bearish bias.
- The changing slope of the HMA highlighted a set of lower swing low and lower swing high. It confirmed the bearish market.
- The HMA alerted us to the next pullback here.
- This bar closed below the HMA and triggered a short trade.
- Now, let’s focus on this bearish pin bar. If you look beyond the HMA and concentrate on the price action, this bar made a minor higher high. It broke the market structure we needed. However, the bearish pin bar also signaled that the market rejected the bullish attempt.
Hence, overall, it was still an acceptable short setup.
As you get familiar with this approach, you’ll learn that the technical rules are just for guidance.
Example #2: Stock Swing Trading (Winning Trade)
The candlestick chart below shows the daily prices of Coamerica Incorporated listed on NYSE.
For easy visual analysis, the WMA and HMA change their colors according to their slopes.
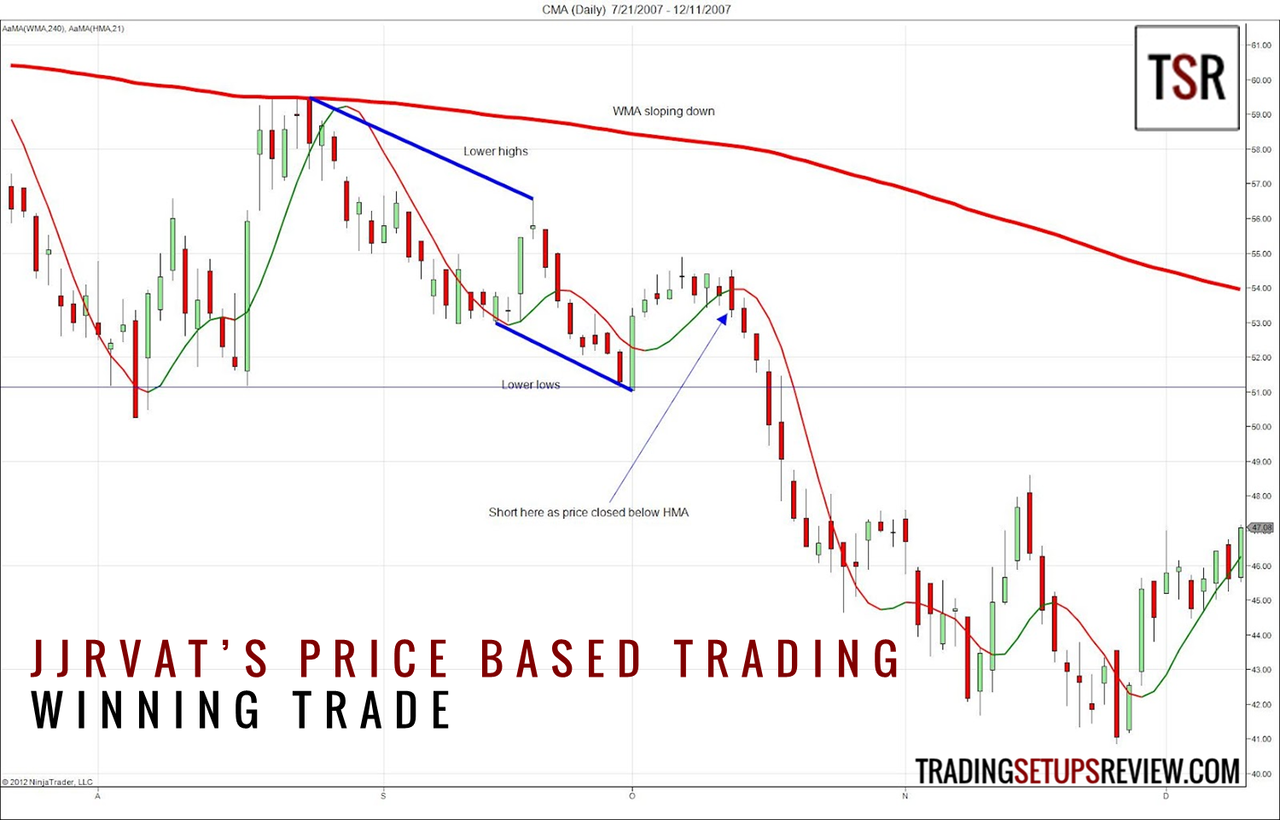
- Here, the WMA was sloping downwards, indicating a bearish macro bias.
- Using the waves highlighted by the HMA, we could discern clear lower highs and lower lows. This swing structure supported a downtrend.
- During the pullback that followed, a short setup presented itself as price closed below the HMA.
Holding the position until the end of the downswing led to solid profits.
Further Price Action Analysis
The lower low formed a double bottom with a previous swing low around the blue horizontal line.
Despite an initial strong bull bar pushing off that double bottom, the upward momentum soon stalled, and dojis developed.
Interpreting this short-lived bullish thrust as a bull trap makes this short setup more attractive.
Example #3: Losing Trade
This is a daily chart of Kohl’s Corporation listed on NYSE.
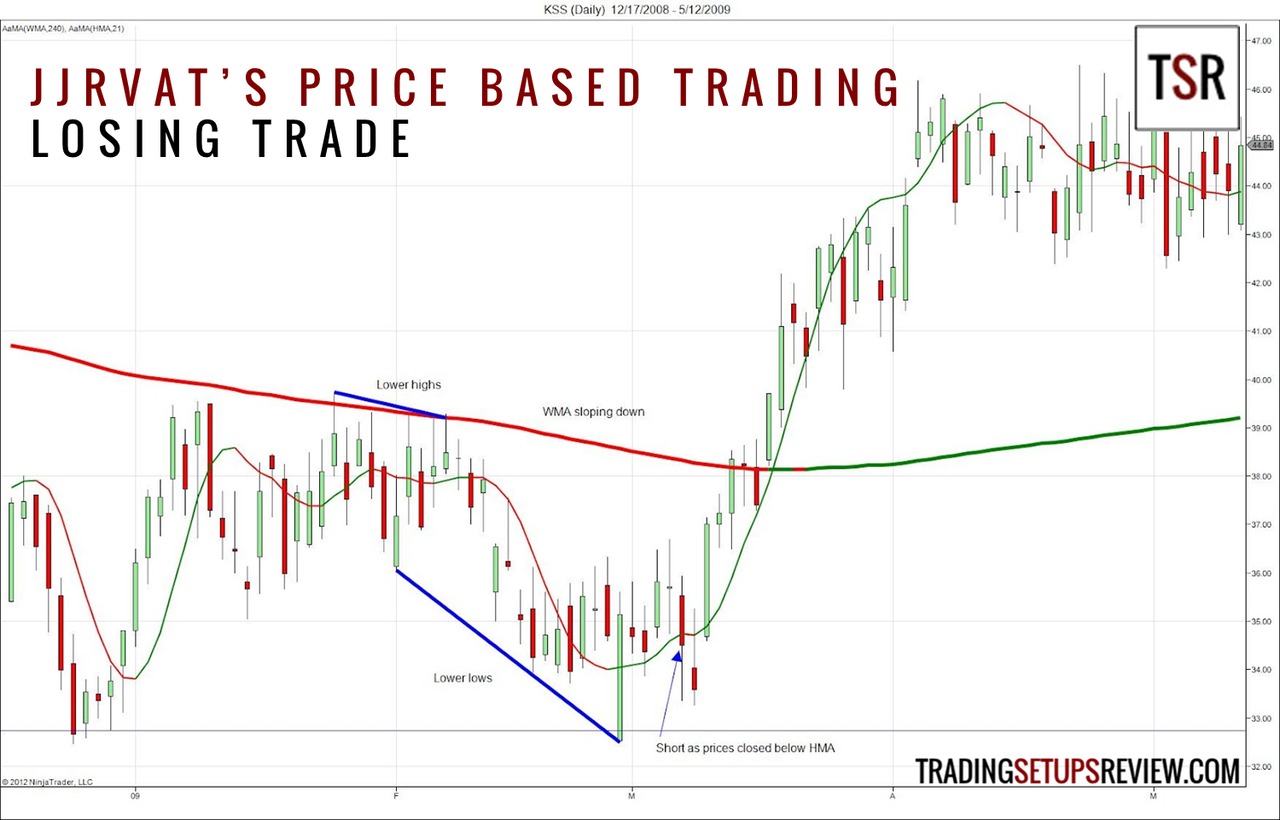
- The red WMA highlighted the negative slope, implying a bearish bias.
- The thick blue lines highlighted the lower highs and lower lows, as defined by the HMA.
- During the subsequent pullback, prices closed below the HMA, and we shorted.
After stalling for a day, the market reversed abruptly into a bull trend.
Let’s see if we can figure out why this trade failed.
We saw lower highs and lower lows. There were indeed lower highs if we were trading the indicator: HMA.
But, recall that this is a price-based approach, and the HMA only serves to highlight, but not define, the market structure.
If you look beyond the indicator colors to focus on price action, you’ll find that the lower highs were barely perceptible. Most of the candlesticks overlapped with the nearly flat HMA. It was a sign that the HMA’s slope was not reliable for clarifying price waves at that point.
Hence, a trading range was likely, and the market structure supporting a short trade was weakened.
Example #4: Forex Trading
This one-hour chart comes from the forex market (EURUSD).
This example is close to a textbook example. As an exercise, try to compare how the price waves look here with the losing example above.
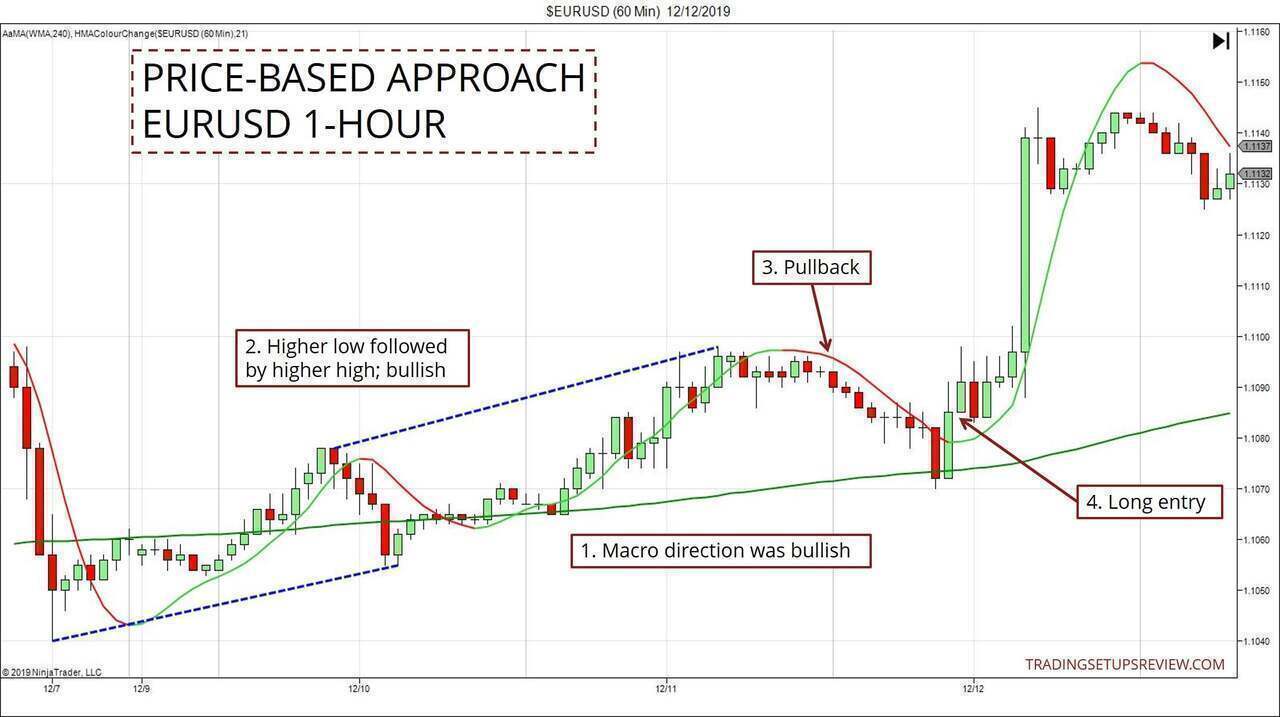
- The order of analysis is critical. Always stay with the trend. Here, the rising WMA pointed to a bullish backdrop.
- The neat HMA waves highlighted a solid bullish structure with a higher low, followed by a higher high.
- This pullback down was orderly. This characteristic usually bodes well for pullback trades.
- The powerful two-bar reversal brought the market up above the HMA and triggered a long trade.
Example #5: Timing Long Term Investments
Price action methods are versatile. We should keep our minds open about their applications.
Although this method was first introduced for day trading, it is also interesting to apply it for timing long-term investments (if you are so inclined).
The chart below shows the monthly candlesticks from the SPY, a U.S. market ETF.
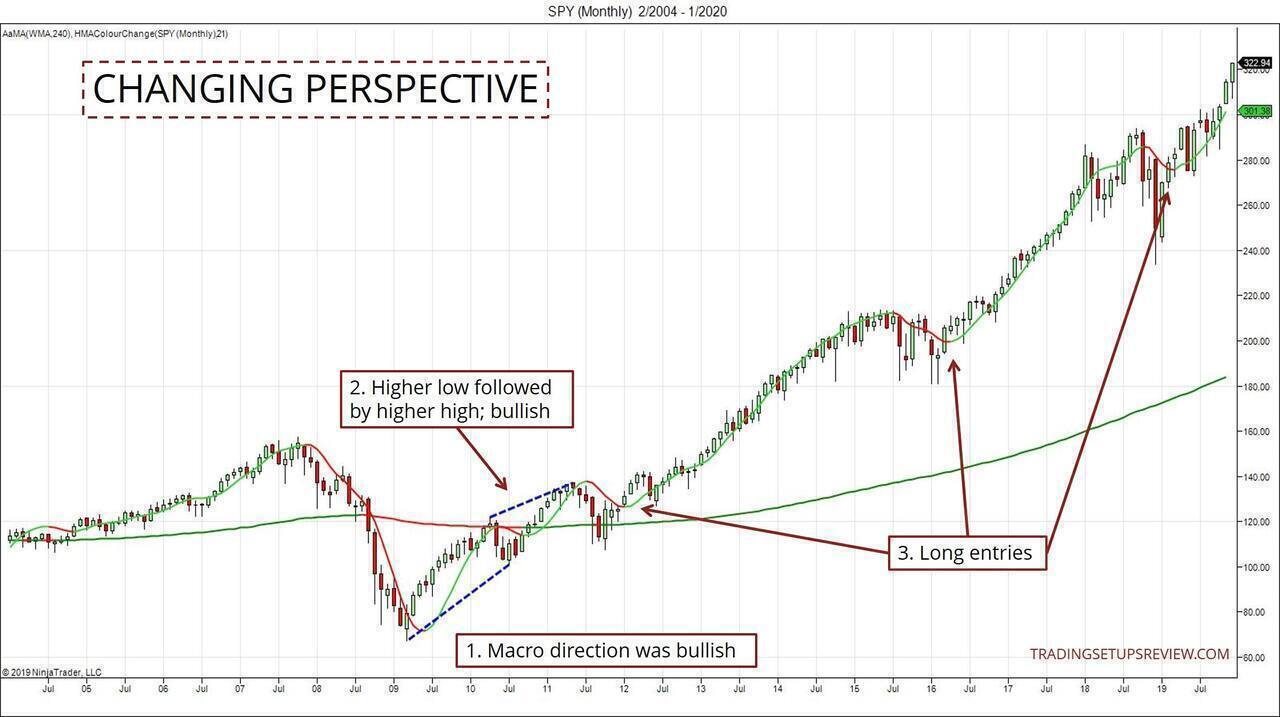
- Many investors hold a long bias when they consider the market with a long-term horizon. If that is the case for you, you can remove the WMA as it adds little value to that premise.
- This means that we are looking out for a bullish market structure before considering a long-term position. This was the first set of higher low and higher high after the 2008 crash.
- These are possible long entries from since then.
The price waves are smooth and nice in this example. You can track them easily.
But as each candlestick represents a month, patience is the key challenge.
Review - Jjrvat’s Price-based Approach
This is one of my favorite trading approaches. Despite using two moving averages, it focuses heavily on price action.
The moving averages offer an initial market analysis. Use them to focus your analysis but see beyond the lines and colors.
One fundamental principle here is the order of analysis.
Analyze the following in this exact sequence:
- Macro direction
- Price waves
- Trade trigger
In other words, context is vital. Figure out the context before thinking of placing any trade.
Many new traders spend all their time looking for the Holy Grail trigger without taking a step back to look at the bigger picture.
You need not stick to using a WMA and an HMA. Select trading tools that you find compelling, as long as you follow the same order of analysis.
There are two things to bear in mind when you use this trading approach.
- First, you are trading price action and not indicators. Do not get lost following indicators like the losing example above.
- Next, this is an approach. It has many nuances when it comes to real trading. Read the original forum thread by jjrvat to understand these aspects before experimenting with this approach.
When the price action falls in line with your HMA parameters, the price waves are tracked almost perfectly by the HMA. In those cases, it’s tempting to treat this approach as the Holy Grail.
But you will find that near-perfect tracking of price waves is not common. So never rely entirely on the HMA. Learn to spot when price action and HMA are telling different stories. This is the key to employing this method successfully.
The article was first published on 11 March 2012 and updated on 12 February 2020.